2.3 & 2.9 and 2.4: Population Dynamics and Composition: Key Concepts and Trends
1/44
There's no tags or description
Looks like no tags are added yet.
Name | Mastery | Learn | Test | Matching | Spaced |
|---|
No study sessions yet.
45 Terms
Fertility
Factors that influence the birth rate in a population.
Crude Birth Rate (CBR)
The number of live births occurring in one year per 1,000 people.
Total Fertility Rate (TFR)
Average number of children who would be born per woman during her childbearing years.
Mortality
Factors that influence the death rate in a population.
Life Expectancy
The number of years the average person will live.
Crude Death Rate (CDR)
The number of deaths occurring in one year per 1,000 people.
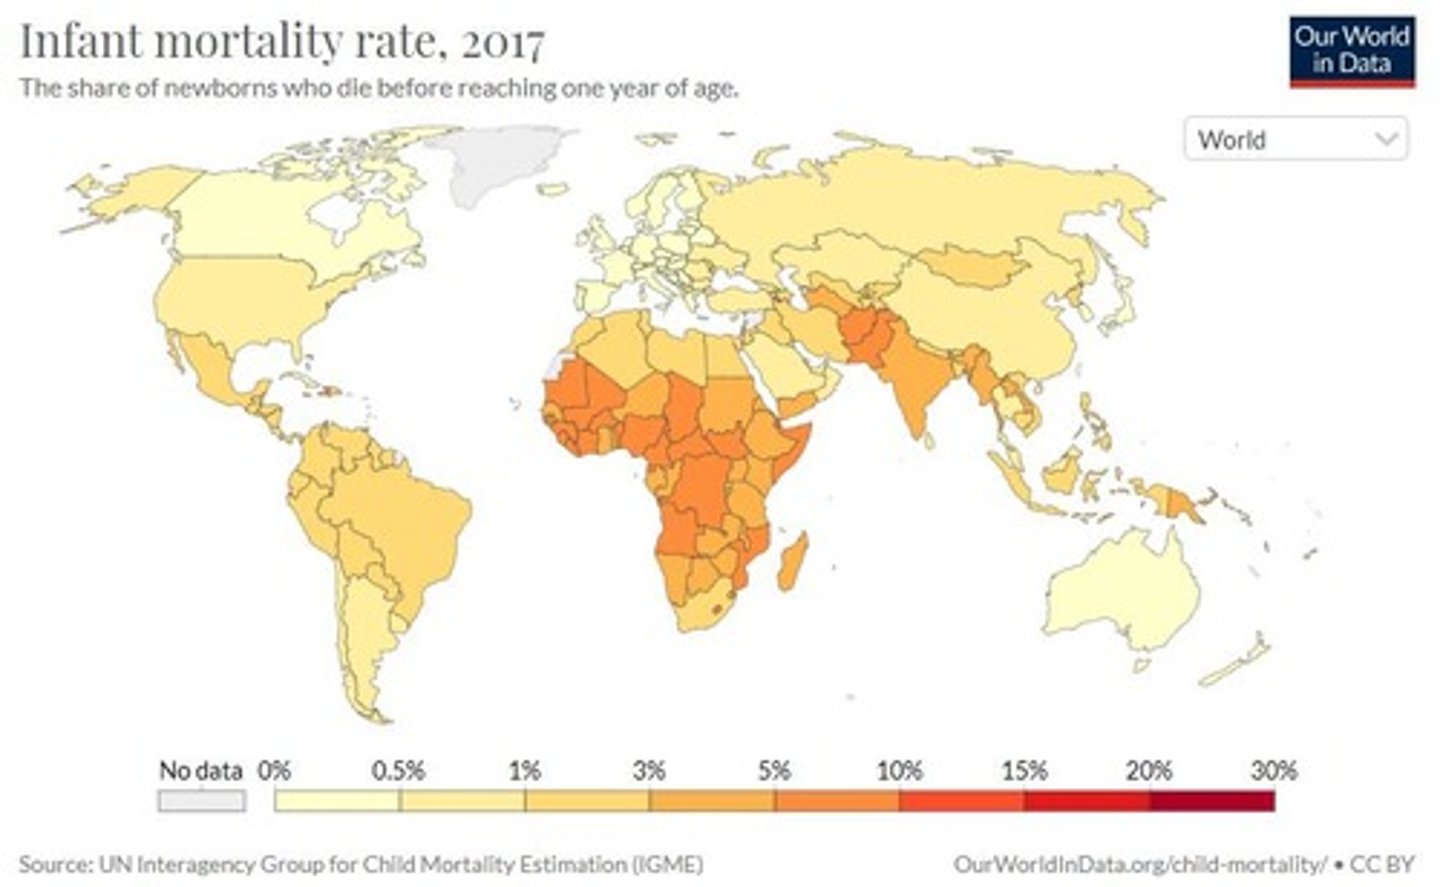
Infant Mortality Rate (IMR)
The number of children who die before one year of age.
Natural Increase Rate (NIR)
The rate of population growth that does not account for migration, expressed in a percentage.
Population Growth Rate
A measure that accounts for migration, calculated as Births - Deaths + Immigrants - Emigrants.
Doubling Time
The number of years in which a population will double assuming the growth rate remains stable.
2nd Agricultural Revolution
A period around 1750 that contributed to population growth through advancements in agriculture.
Industrial Revolution
A period that began around 1750 leading to rapid urbanization and population growth.
NIR in Niger
3.8%.
NIR in Spain
-0.11%.
Economic Factors
Influences on population growth and decline related to economic conditions.
Social Factors
Influences on population growth and decline related to societal norms and cultural expectations.
Political Factors
Influences on population growth and decline related to government policies and political stability.
Natural Factors
Influences on population growth and decline related to environmental conditions.
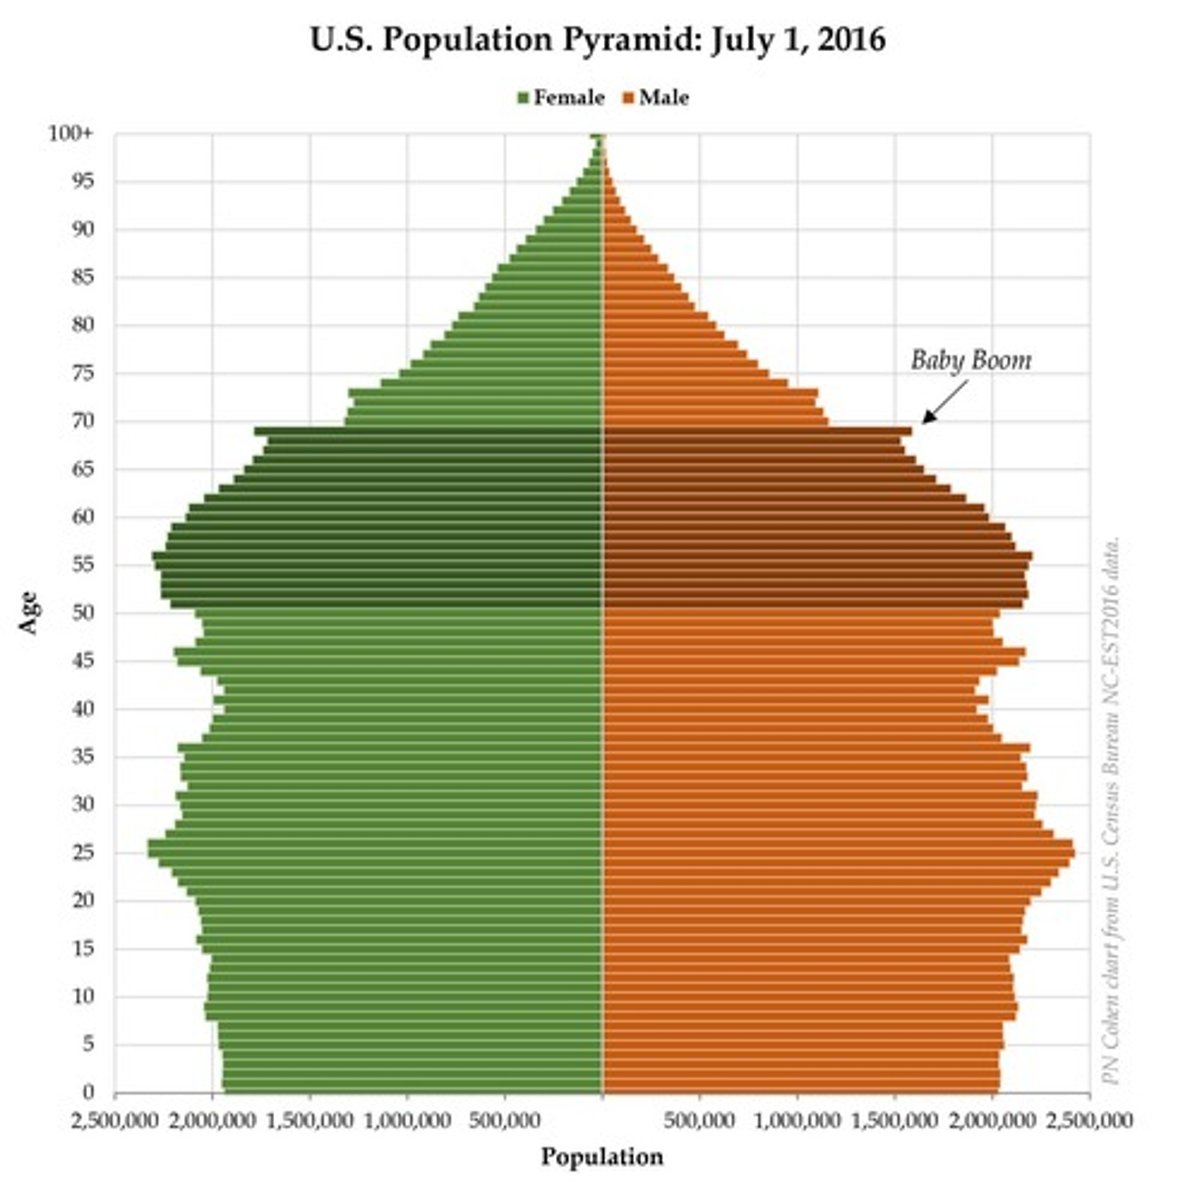
United States Baby Boom
A significant increase in birth rates in the U.S. from 1946 to 1965 following World War II.
Population Growth in LDCs
Most population growth today is occurring in Less Developed Countries, particularly in Asia and Africa.
First 1 billion
The world population reached its first billion in 1804.
Advances in Healthcare & Sanitation
Improvements that have contributed to increased life expectancy and population growth.
Rapid Urbanization
A significant movement of populations from rural to urban areas contributing to population growth.
Population Composition
Elements of population structure including age and sex ratio.
Population Structure
What percentage of the population are children? The elderly? Male? Female?
Population Pyramids
Graphical representation used to show the population structure/composition of a location.
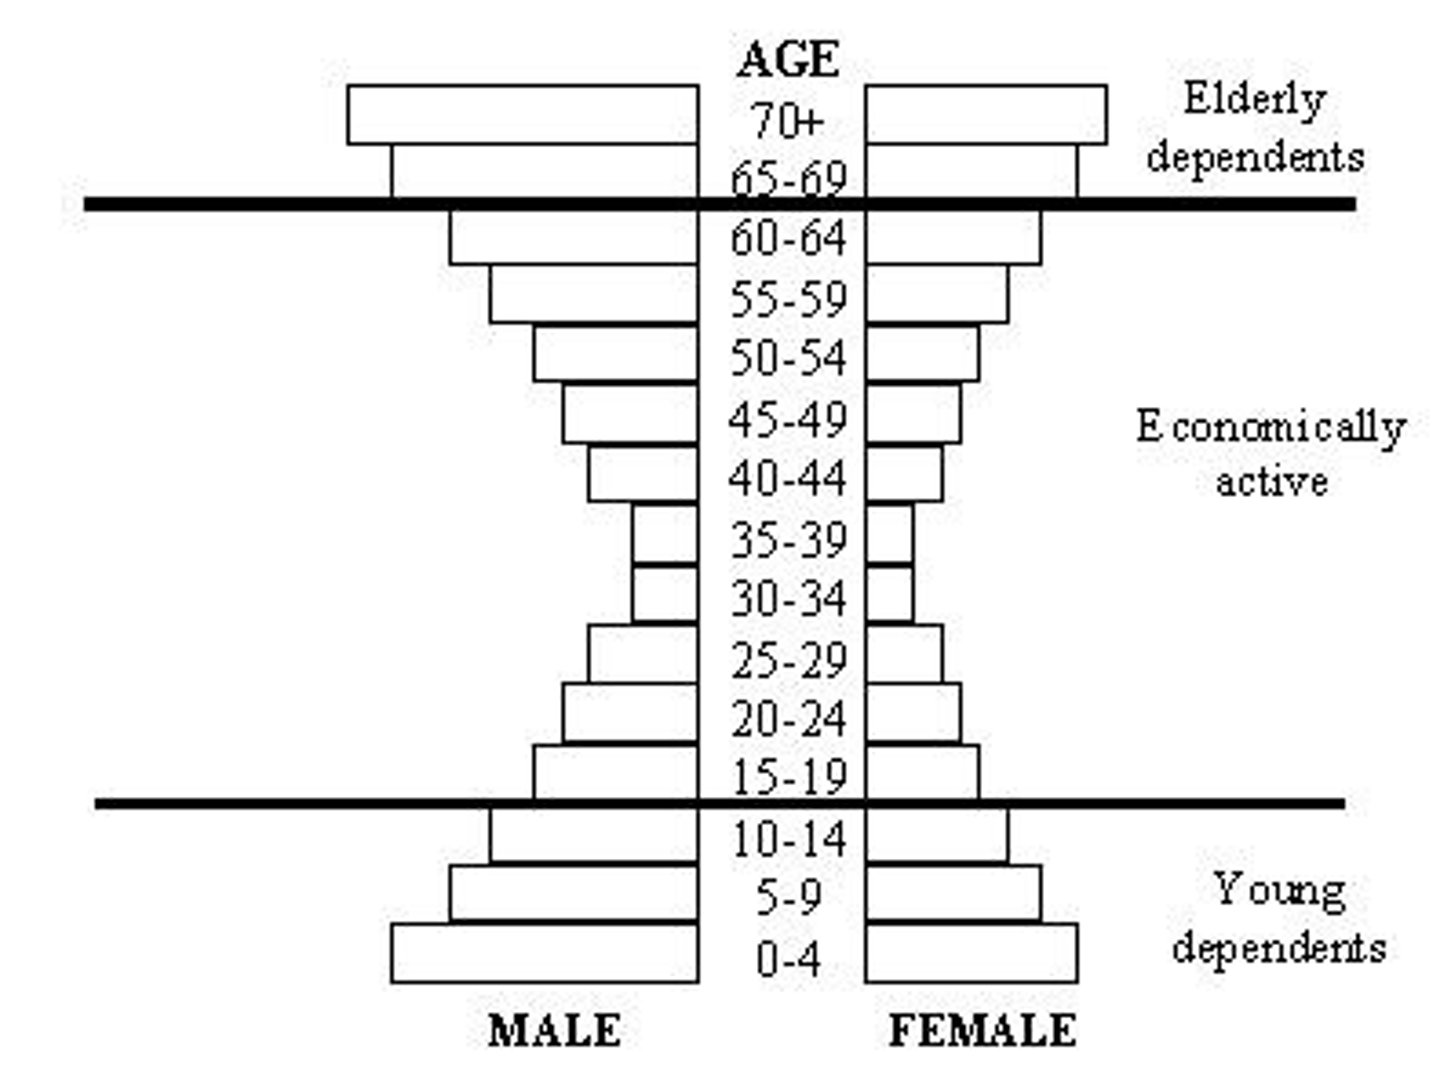
Dependency Ratio
The number of people in a dependent age group divided by the number of people in the working-age group multiplied by 100.
Youth Dependency
The portion of the population that is under the age of 15.
Elderly Dependency
The portion of the population that is over the age of 65.
Impacts of High Dependency Ratio
Higher taxes on the working population to support those not working.
Aging Population Consequences
Political, social, and economic impacts including increased healthcare costs.
Sex Ratio
The proportion of males to females in a population.
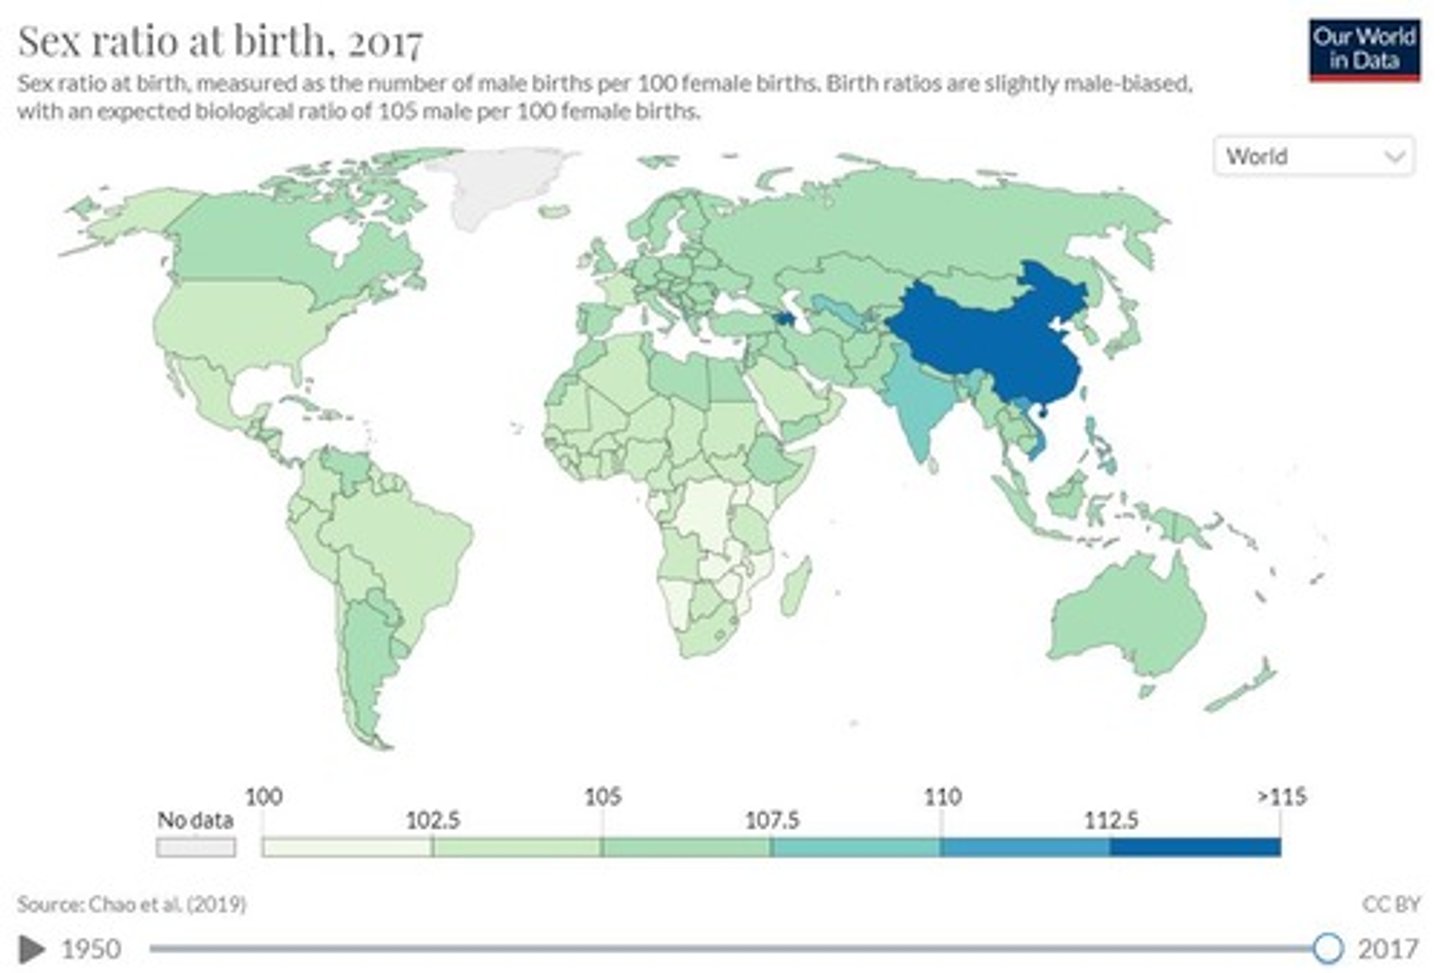
Factors Affecting Sex Ratio
Causes such as war, insufficient healthcare for women, migration, and gendercide.
Life Expectancy for Russian Women
76 years old.
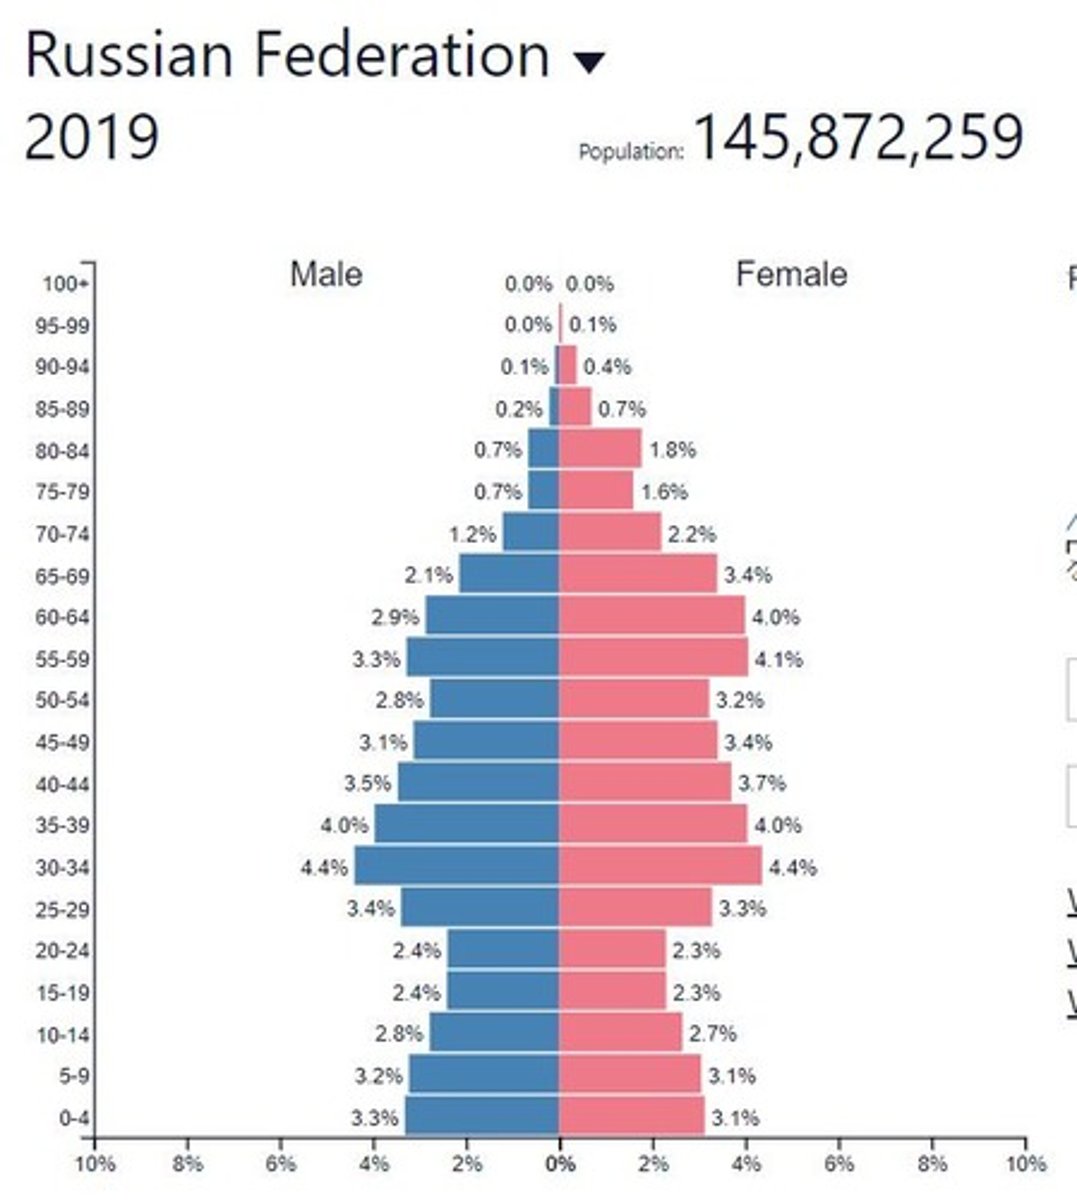
Life Expectancy for Russian Men
64 years old.
Aging Population Employment Opportunities
Growth in elder care industry jobs such as geriatric physical therapists and in-home healthcare providers.
Political Activity of the Elderly
Typically the most politically active group, influencing issues like healthcare and retirement.
Population Growth Assessment
Population pyramids are used to assess population growth and decline.
Population Composition Analysis
Geographers analyze patterns of age structure and sex ratio across different regions.
Consequences of Aging Population
Increased demand for healthcare and social support services.
Cultural Changes in Family Structure
Traditional families where the bride moves into her husband's family are changing.
Healthcare Costs with Aging Population
As life expectancy increases, so do healthcare costs.
Political Perspectives of the Elderly
Elderly individuals have different perspectives on political issues due to their experiences.
Historical Impact on Sex Ratio
More women ages 80 & up due to higher male mortality during World War II.
Population Composition Mapping
Patterns of age structure and sex ratio can be mapped and analyzed at different scales.