Central Nervous System PART III
1/210
There's no tags or description
Looks like no tags are added yet.
Name | Mastery | Learn | Test | Matching | Spaced |
|---|
No study sessions yet.
211 Terms
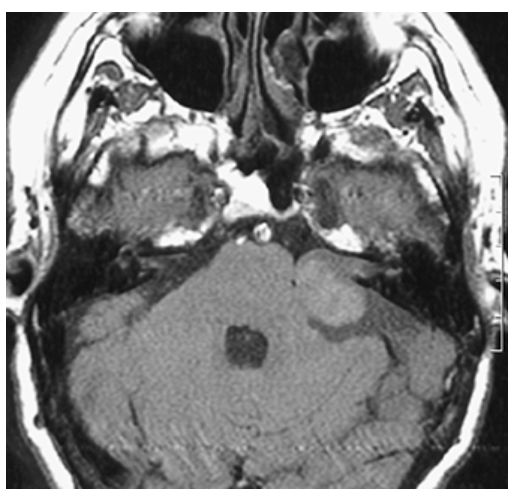
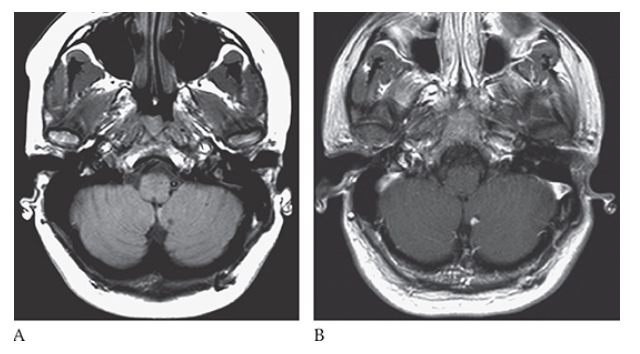
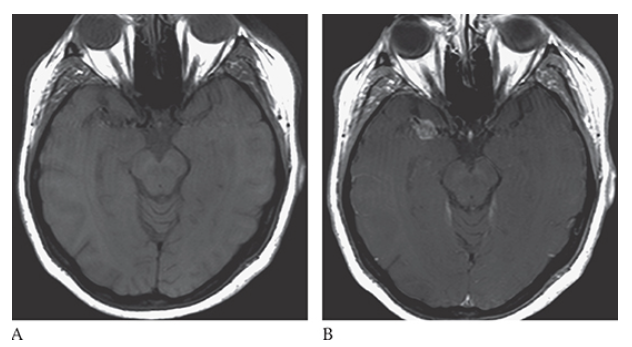
Acoustic Neuroma. Noncontrast T1-weighted axial image demonstrating round isointense mass at the left cerebellopontine (CP) angle.
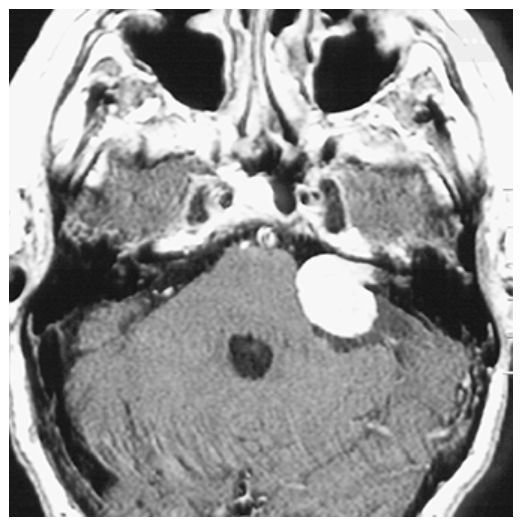
Acoustic Neuroma. Postcontrast T1-weighted axial image demonstrating an intense contrast enhancing extraaxial mass at the left cerebellopontine angle close to the left internal auditory canal (IAC) consistent with an acoustic neuroma.
Astrocytoma. Axial NECT of the head shows a low-attenuation mass in the left temporal lobe with surrounding edema.
Astrocytoma. Axial CECT shows mild enhancement of the mass which contains areas of necrosis.
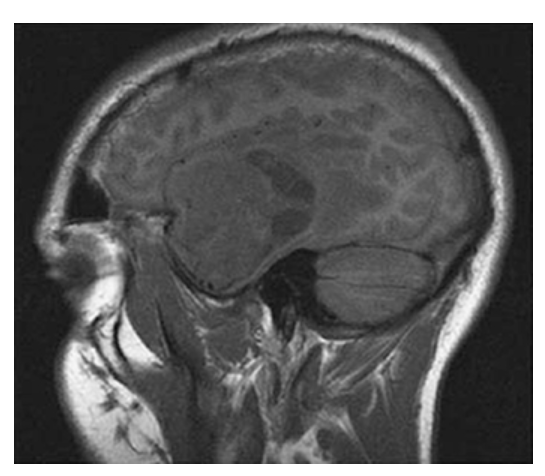
Astrocytoma. Sagittal T1W image shows an isointense mass in the left temporal lobe with surrounding low signal edema.
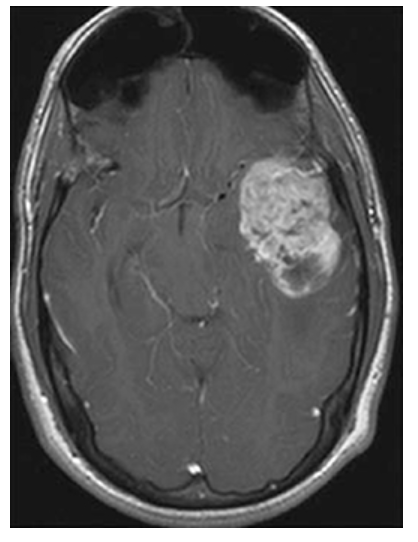
Astrocytoma. Postcontrast axial T1W image shows enhancement of the mass in the left temporal lobe. There is mass effect on the surrounding brain with effacement of the left ambient cistern.
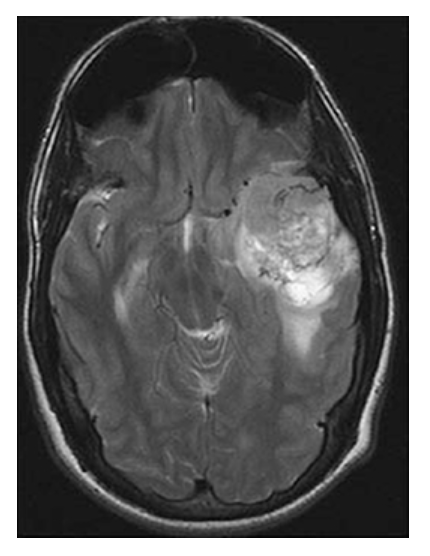
Astrocytoma. Axial T2W image shows the left temporal mass with surrounding high-signal edema.
Brain Metastasis. Axial T2W image shows the left parietal mass with high central signal likely due to necrosis and high signal in the surrounding white matter due to vasogenic edema.
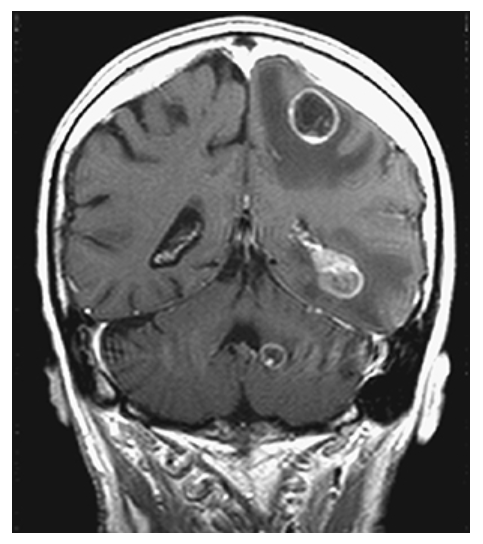
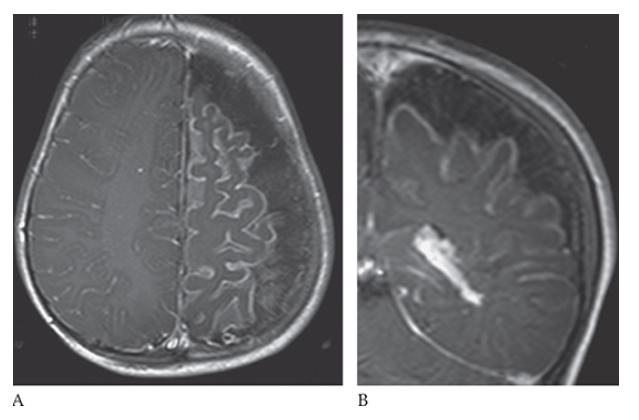
Brain Metastasis. Postcontrast T1W coronal MR shows multiple enhancing lesions with surrounding low-signal edema involving the gray-white junction, white matter, and cerebellum.
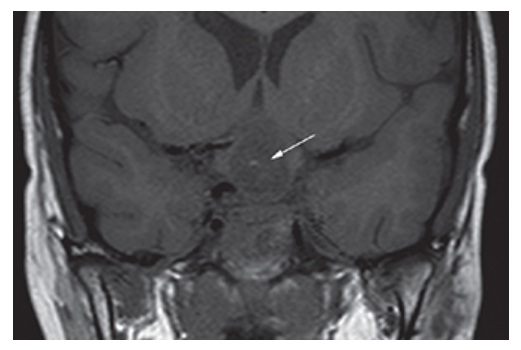
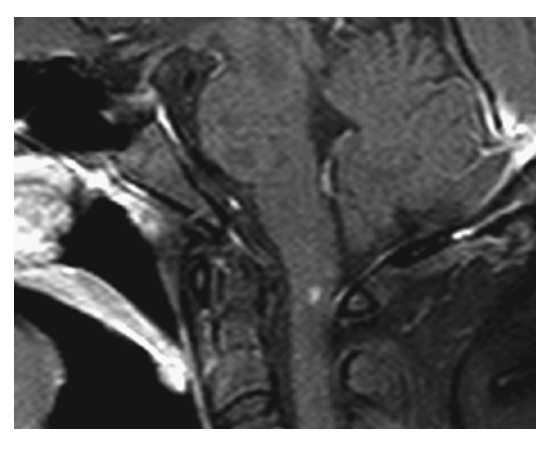
Craniopharyngioma. Coronal T1W MR image shows a low-signal suprasellar mass (arrow) with small focus of increased signal which enhances with contrast.
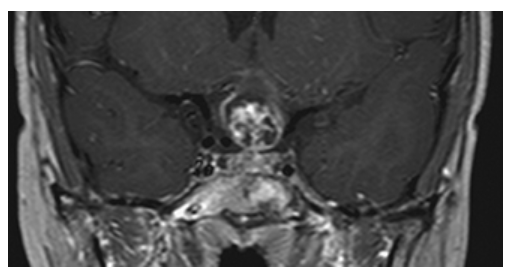
Craniopharyngioma. Postcontrast T1W coronal MR.
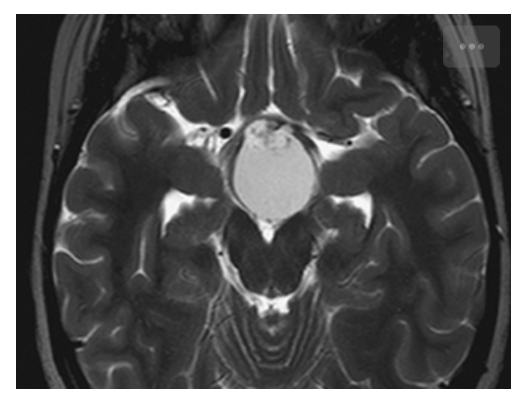
Craniopharyngioma. T2W axial image shows high signal within the cystic component of the mass. The punctate areas of low signal are due to calcification.
Craniopharyngioma. Axial NECT shows dense calcifications within a suprasellar mass consistent with a craniopharyngioma.
Ependymoma. Axial NECT shows a large mass with calcifications arising from the fourth ventricle and extending posteriorly. There is also hydrocephalus due to obstruction of cerebral spinal fluid (CSF) flow by the mass.
Ependymoma. Sagittal T2W image shows the large irregular mass arising from the fourth ventricle, compressing the cerebellum and herniating down the spinal canal. There is also severe hydrocephalus due to obstruction of CSF flow.
Ependymoma. Postcontrast T1W sagittal image shows irregular enhancement of the mass.
What is A
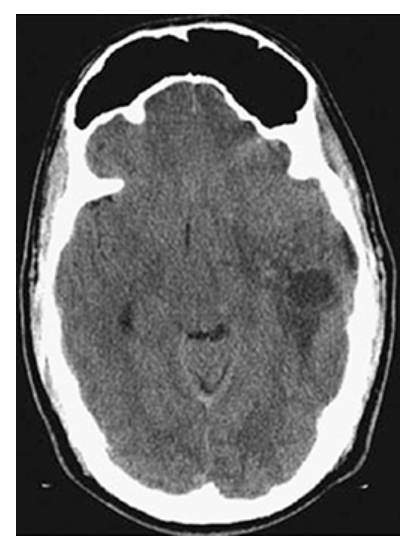
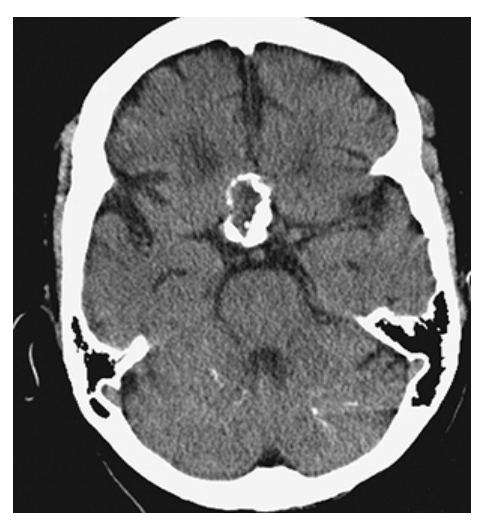
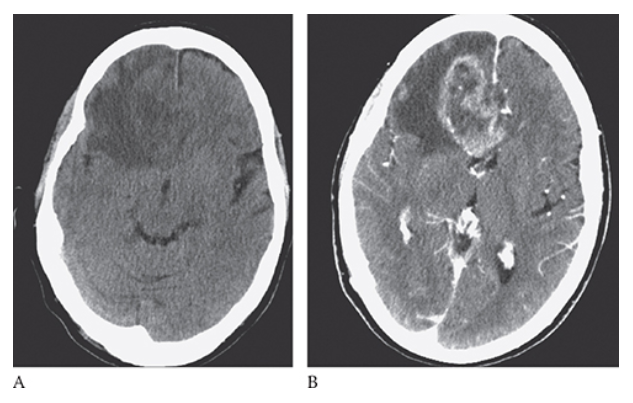
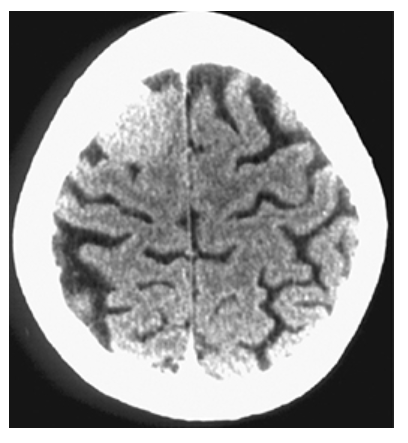
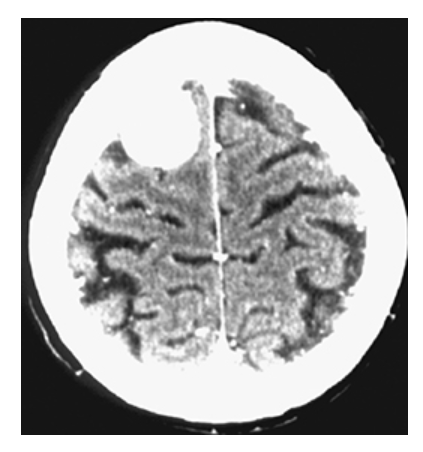
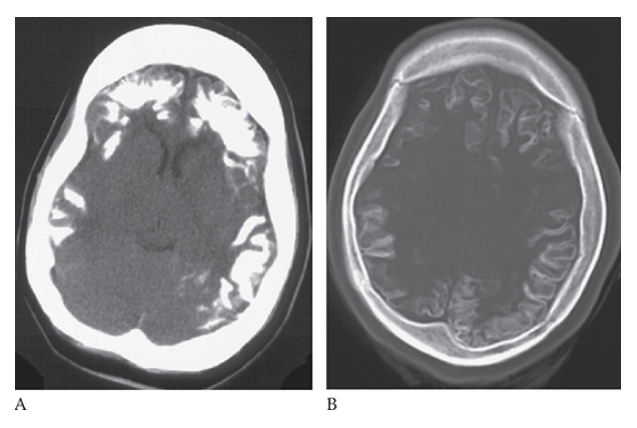
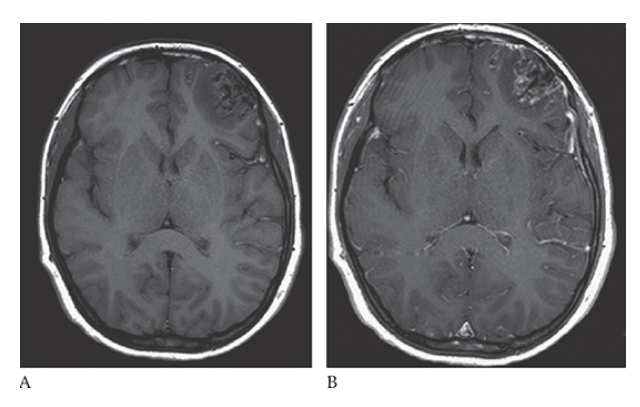
Glioblastoma Multiforme. Pre-axial CT images show a large peripherally enhancing centrally necrotic mass in the right frontal lobe which is extending across the white matter tracts of the anterior corpus callosum. Note the surrounding edema and mass effect resulting in midline shift.

What is B
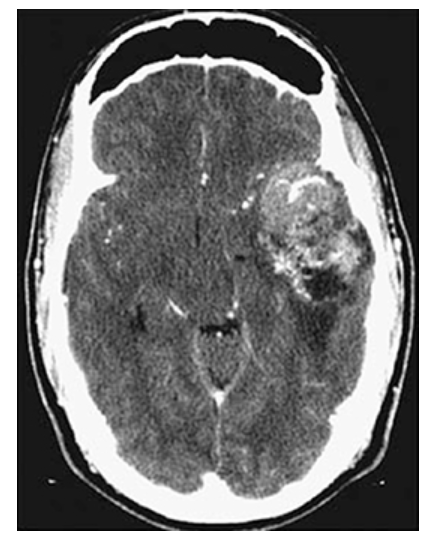
Glioblastoma Multiforme. postcontrast axial CT images show a large peripherally enhancing centrally necrotic mass in the right frontal lobe which is extending across the white matter tracts of the anterior corpus callosum. Note the surrounding edema and mass effect resulting in midline shift.
What is A
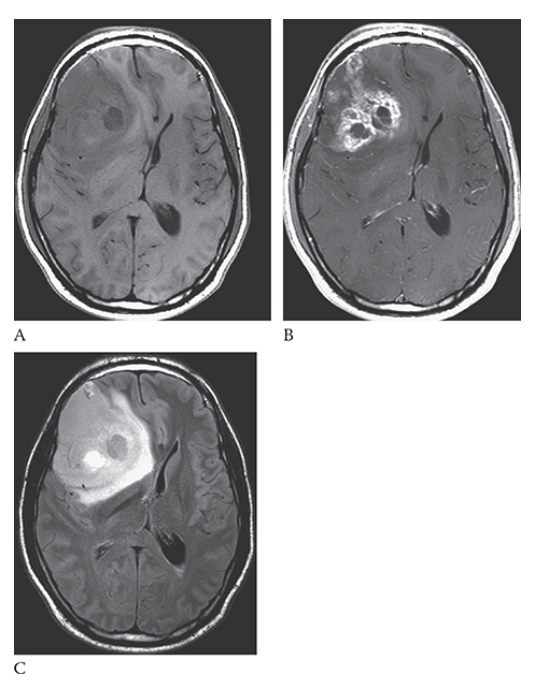
Glioblastoma Multiforme. shows an isointense mass with low-signal central necrosis and surrounding edema. Postcontrast T1W image

What is B
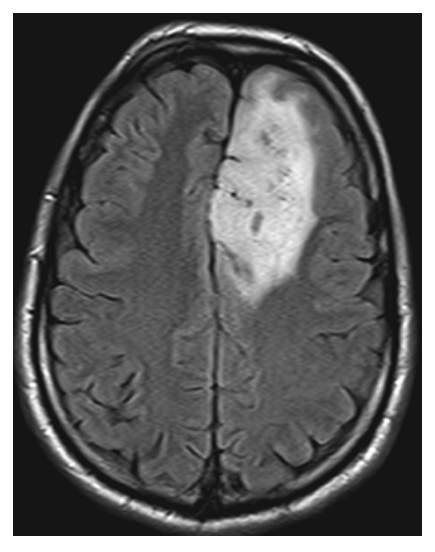
Glioblastoma Multiforme.hows peripheral irregular enhancement. FLAIR image

What is C
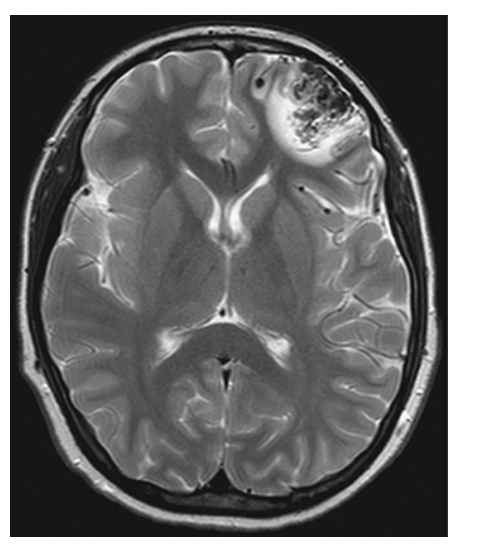
Glioblastoma Multiforme. shows high-signal edema.
Lipoma. Axial NECT shows a small, very low-attenuation mass in the midline consistent with a lipoma.

What is A
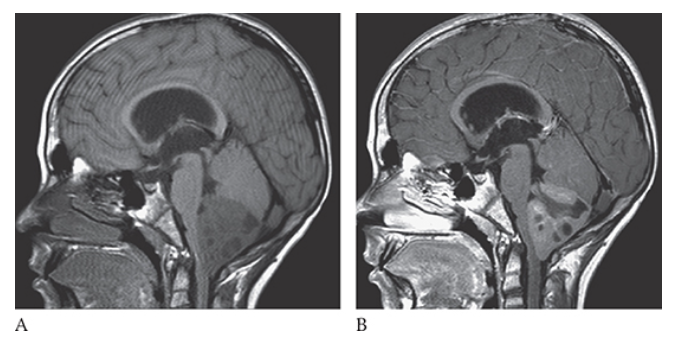
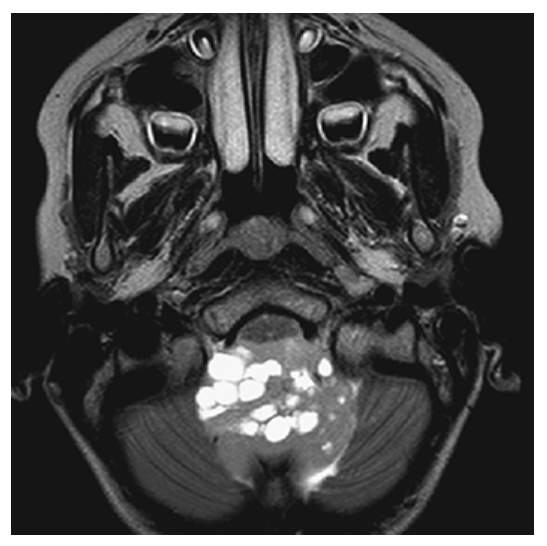
Lipoma. T1W axial and sagittal
What is B
Lipoma. T1W axial images show small high-signal-intensity masses in both cerebellopontine angles.
What is A
Medulloblastoma. Sagittal T1W image shows a large low-signal fourth ventricular mass with multiple cystic areas. The solid component enhances with gadolinium

What is B
Medulloblastoma. Sagittal T1W image Also note the hydrocephalus due to obstruction of CSF flow.
Medulloblastoma. Axial T2W image shows hyperintense cystic areas within the mass.
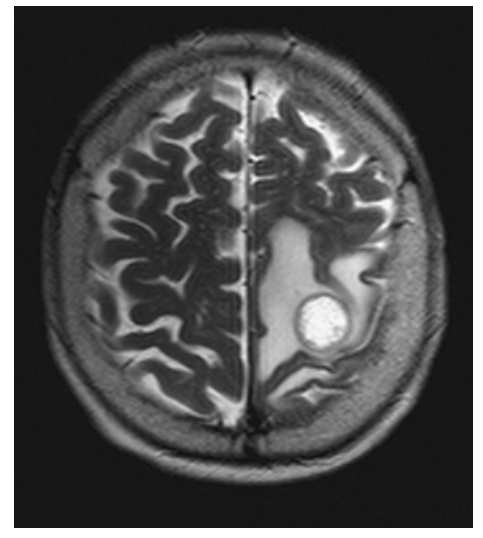
Meningioma. Noncontrast CT shows round, high-density mass over the convexity of the right parietal lobe.
Meningioma. Postcontrast CT image shows a round, markedly contrast-enhancing mass over the convexity of the right parietal lobe.

What is A
Meningioma. T1-weighted axial MR image shows an isointense left parasagittal meningioma and postcontrast T1-weighted images in the axial

What is B
Meningioma. T1-weighted axial MR image shows an isointense left parasagittal meningioma coronal

What is C
Meningioma. T1-weighted axial MR image shows an isointense left parasagittal meningioma and sagittal
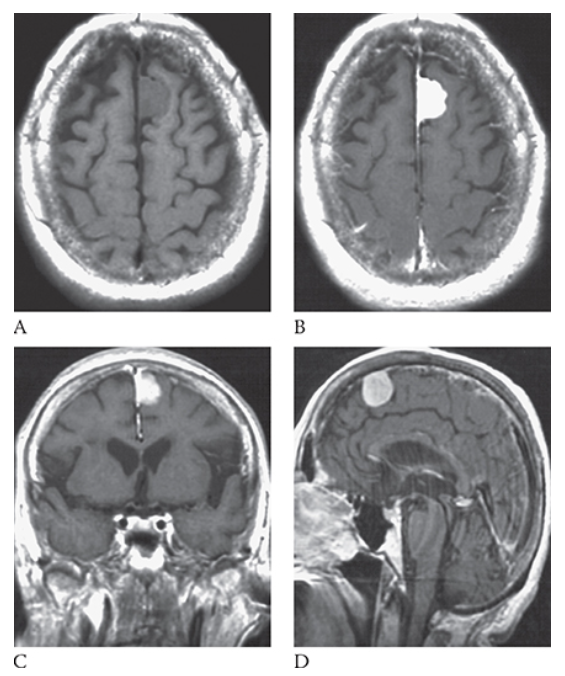
What is D
Meningioma. T1-weighted axial MR image shows an isointense left parasagittal meningioma planes.
Oligodendroglioma. Axial NECT shows an ill-defined partially calcified mass with surrounding edema in the left frontal lobe white matter.
Oligodendroglioma. Axial T1W image shows an ill-defined mass in the left frontal lobe that is isointense to the surrounding gray matter.
Oligodendroglioma. Postgadolinium T1W image shows minimal peripheral enhancement of the mass.
Oligodendroglioma. Axial FLAIR shows a heterogeneous, hyperintense mass in the left frontal lobe which is fairly well circumscribed with some mild surrounding edema.
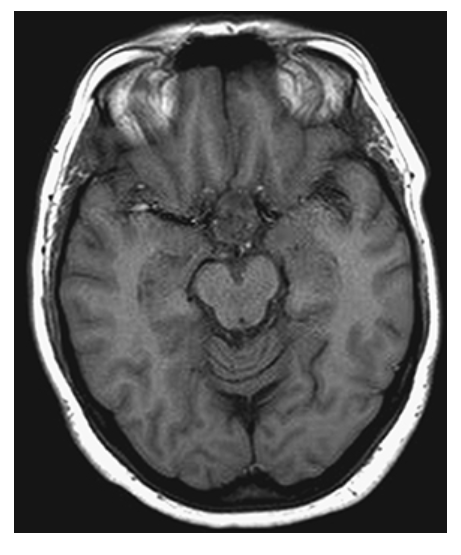
Pituitary Adenoma. Axial T1W MR shows a sellar mass that is isointense to the surrounding gray matter.

What is A
Pituitary Adenoma. Axial and coronal
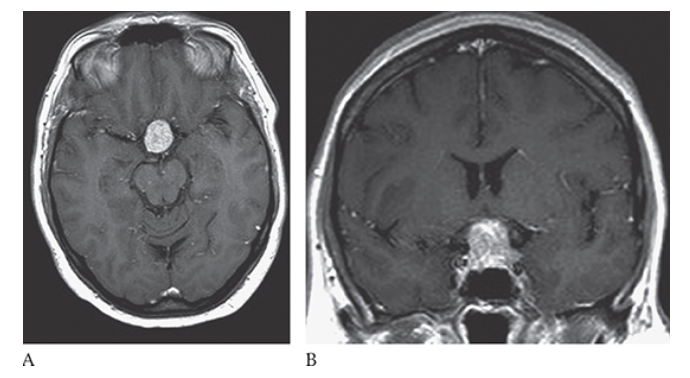
What is B
Pituitary Adenoma. Axial postcontrast T1W images show heterogeneous enhancement of the mass consistent with a pituitary macroadenoma.
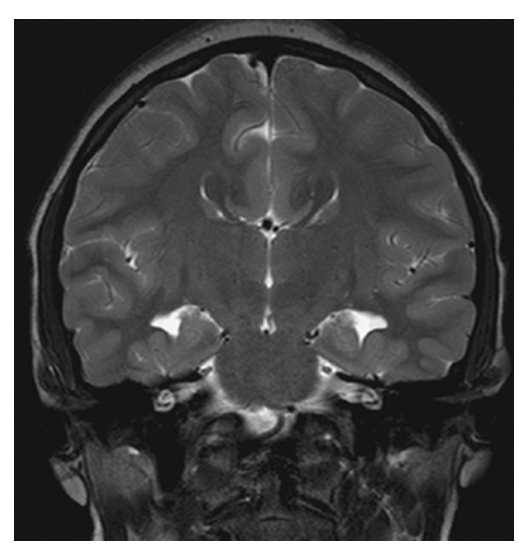
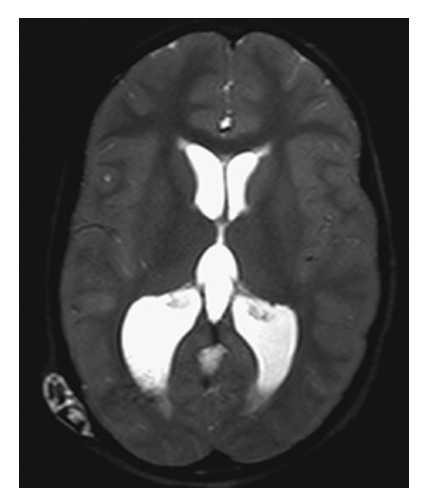
Agenesis of the Corpus Callosum. Coronal T2W image shows agenesis of the corpus callosum with widely spaced lateral ventricle and continuity of the third ventricle with the interhemispheric fissure.
What is A
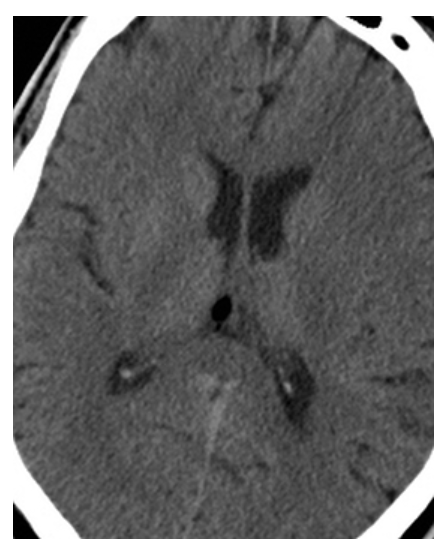
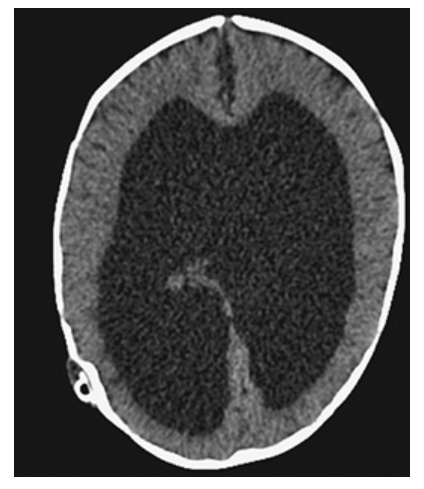
Agenesis of the Corpus Callosum. Axial CT and axial T1W MR

What is B
Agenesis of the Corpus Callosum. Axial CT show enlarged and parallel lateral ventricles with a “race car” configuration and no corpus callosum.
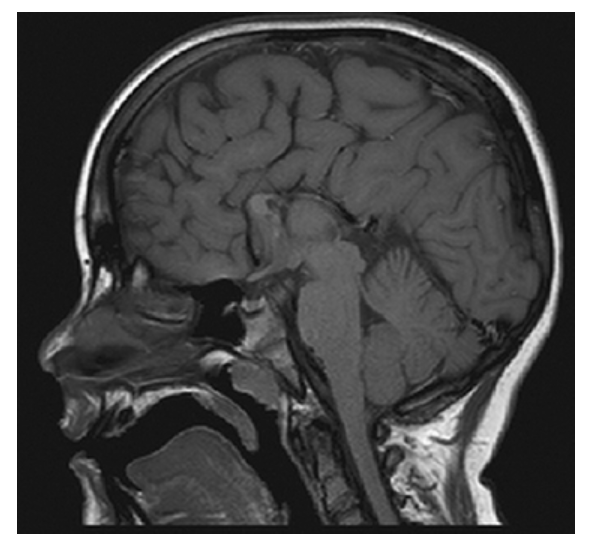
Agenesis of the Corpus Callosum. Sagittal T1W image shows congenital absence of the corpus callosum with radially oriented gyri and the absence of the cingulate gyrus.
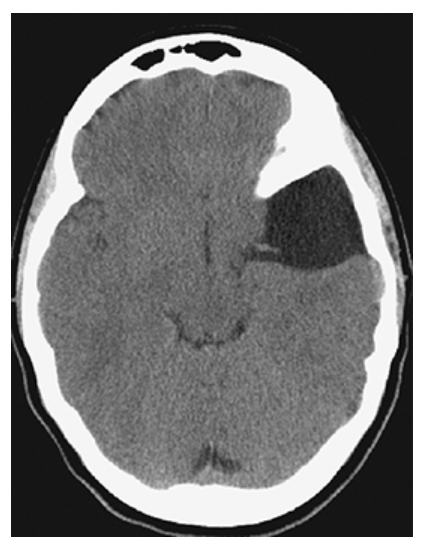
Arachnoid Cyst. Axial NECT shows a CSF density well circumscribed extra-axial fluid collection in the left middle cranial fossa with posterior displacement of the left temporal lobe.
What is A
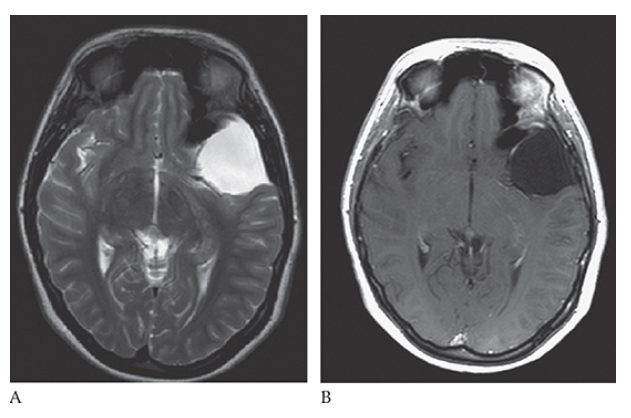
Arachnoid Cyst. Axial T2W and T1W C+

What is B
Arachnoid Cyst. Axial T2W images follow the signal characteristics of the CSF.
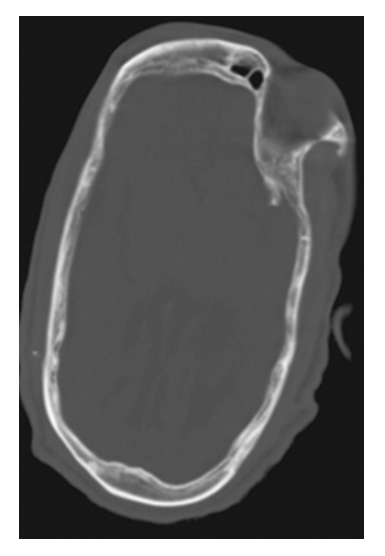
Crainosynostosis. Axial NECT shows elongation of the calvarium in the antero-posterior dimension and narrowing in the transverse dimension.
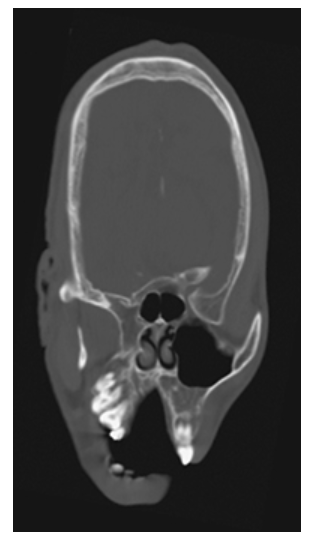
Crainosynostosis. Coronal NECT shows premature complete fusion of the sagittal suture.
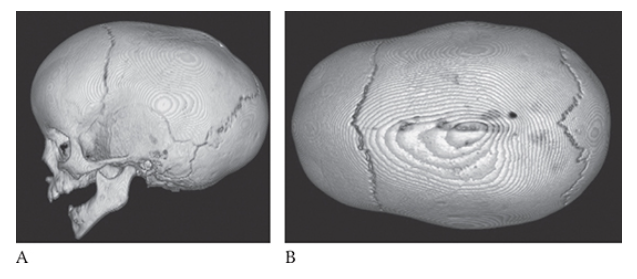
What is A
Crainosynostosis. Lateral 3D reconstructed image and above view

What is B
Crainosynostosis. Lateral 3D reconstructed image image of the skull show complete fusion of the sagittal suture and elongation of the skull in the AP dimension.
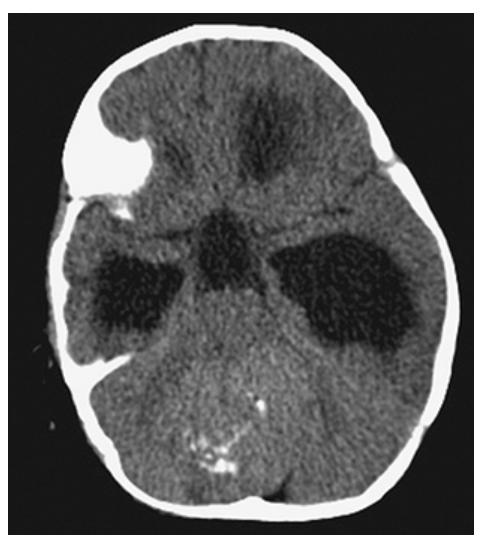
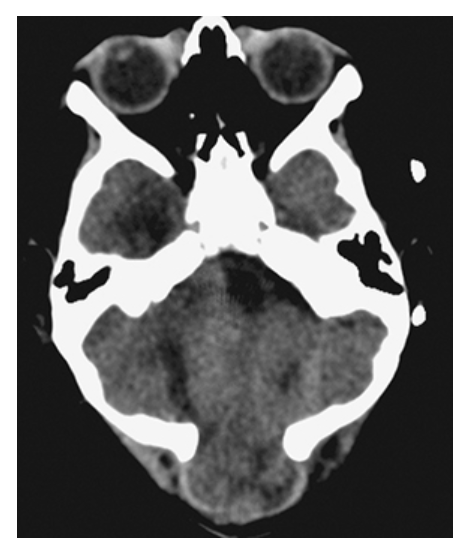
Dandy-Walker Syndrome. Axial NECT shows a large posterior fossa with a CSF density cyst, hypoplastic cerebellar hemispheres, and absence of the vermis.
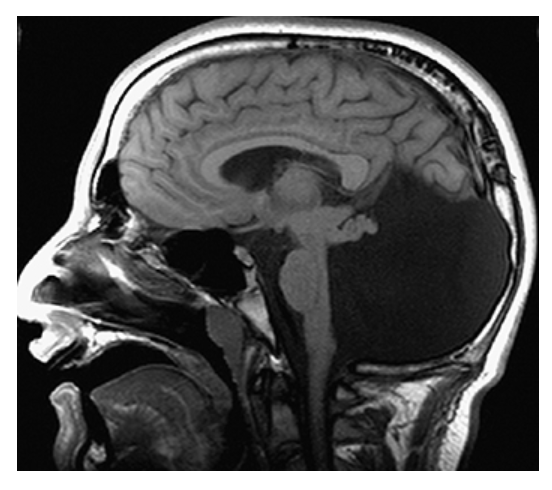
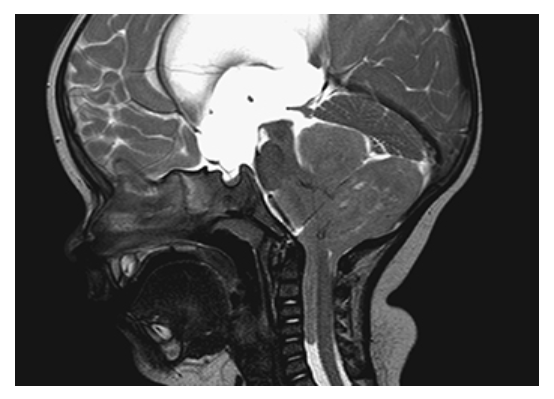
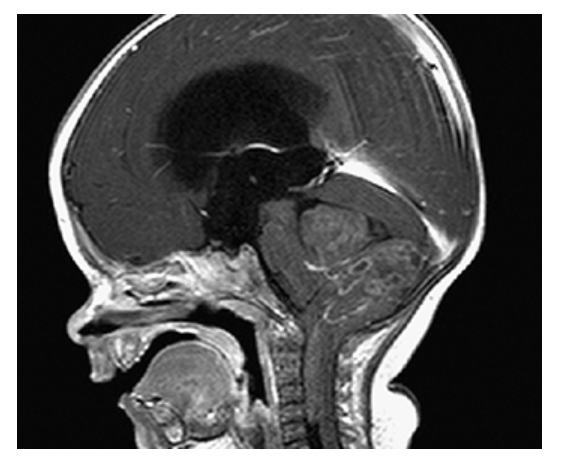
Dandy-Walker Syndrome. Sagittal T1W image shows a massively dilated fourth ventricle, expanded posterior fossa, high-riding torcula, and hypoplastic cerebellum.
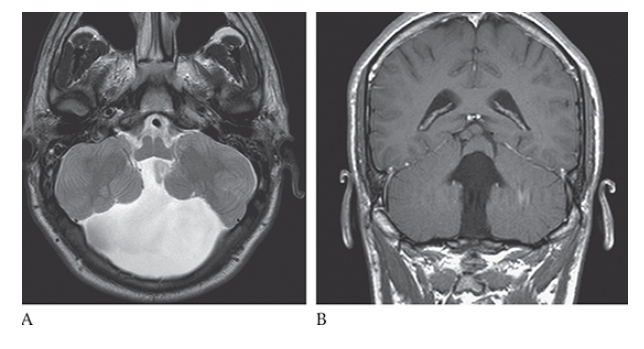
What is A
Dandy-Walker Syndrome. Axial T2W and coronal T1W

What is B
Dandy-Walker Syndrome. Axial T2W show absence of the cerebellar vermis.
Encephalocele. Axial NECT shows a small amount of brain protruding posteriorly through a midline defect in the occipital bone.

What is A
Encephalocele. Axial T1W and T2W
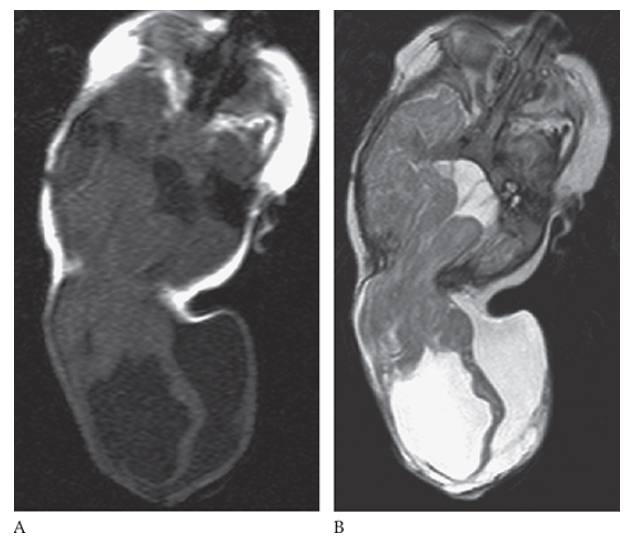
What is B
Encephalocele. Axial T1W images showing herniation of the brain through a defect in the posterior skull.
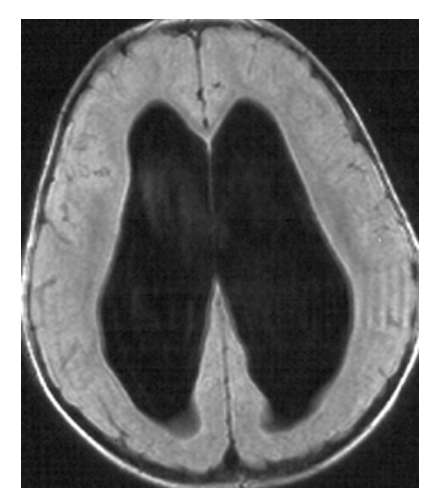
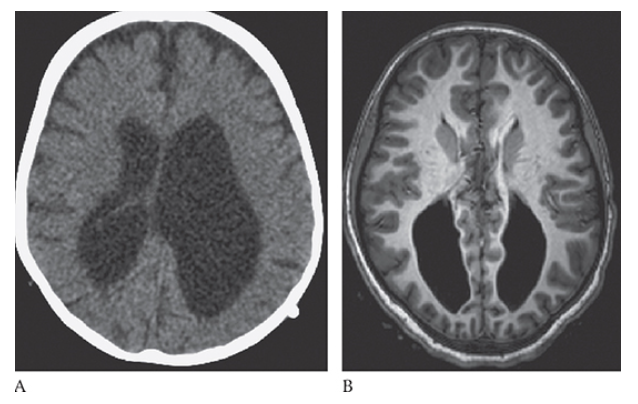
Hydrocephalus. T1-weighted axial MRI shows markedly dilated lateral ventricles with low-signal CSF.
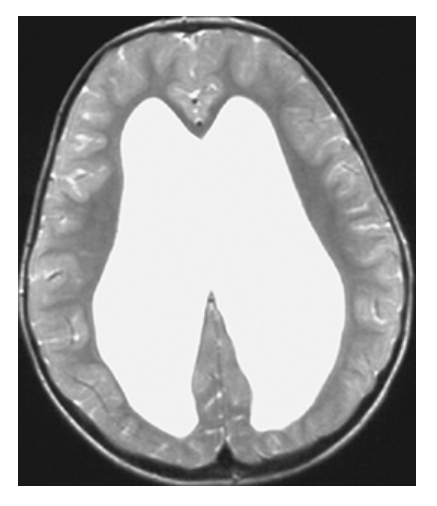
Hydrocephalus. T2-weighted axial MRI shows high-signal CSF of the markedly dilated lateral ventricles.
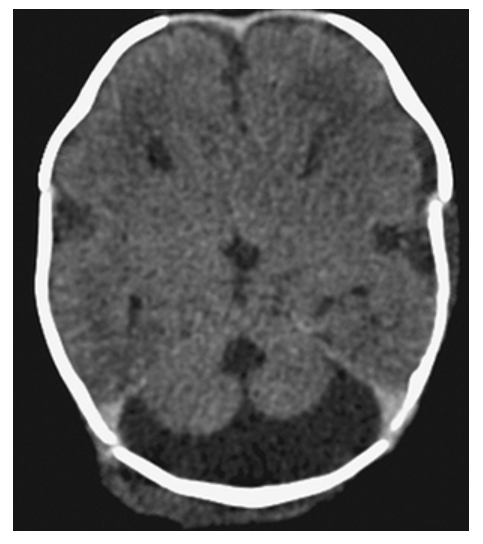
Hydrocephalus. Axial NECT shows markedly dilated lateral ventricles.
Hydrocephalus. T2W axial image shows high-signal CSF within markedly dilated lateral ventricles as a result of a shunt malfunction (fluid leaking around shunt in right parieto-occipital soft tissues).
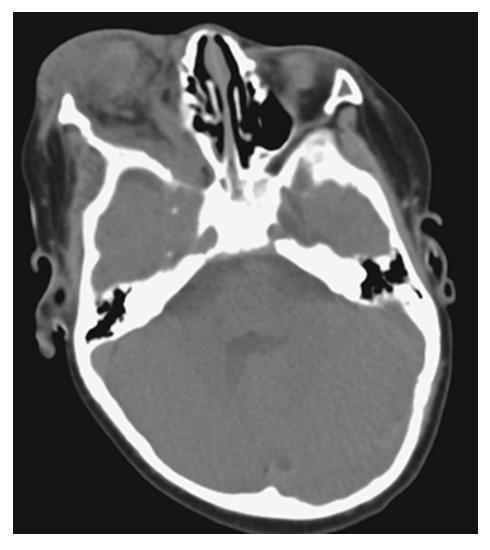
Neurofibromatosis (NF1). Axial NECT shows a soft tissue density infiltrative mass of the right orbit with moderate exophthalmos.
What is A
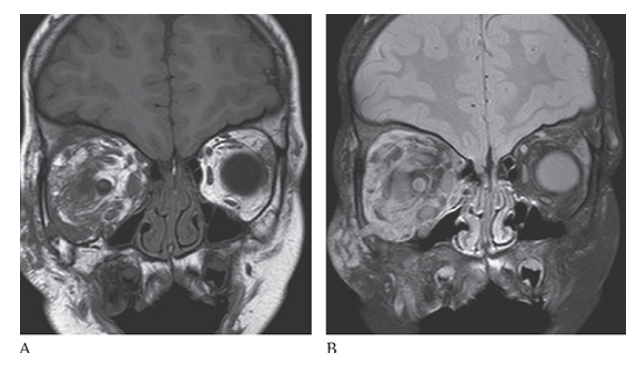
Neurofibromatosis (NF1). Coronal T1W image shows low-signal-intensity mass within the right orbit which is bright on T2W images

What is B
Neurofibromatosis (NF1). Coronal T1W image consistent with a plexiform neurofibroma.
What is A
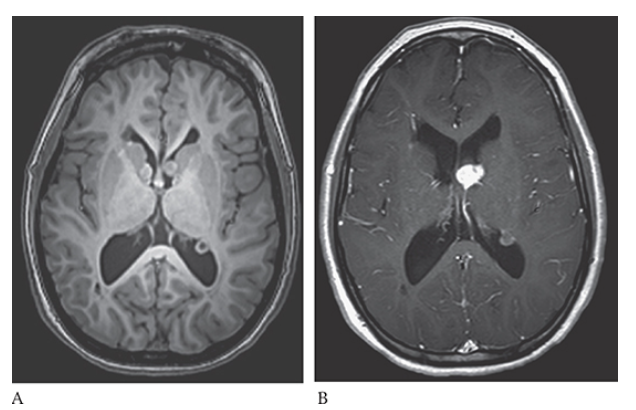
Tuberous Sclerosis. PD axial and postcontrast T1W

What is B
Tuberous Sclerosis. PD axial contrast shows an enhancing left subependymal giant cell astrocytoma in the foramen of Monroe and an enhancing subependymal nodule in the trigone of the left lateral ventricle.
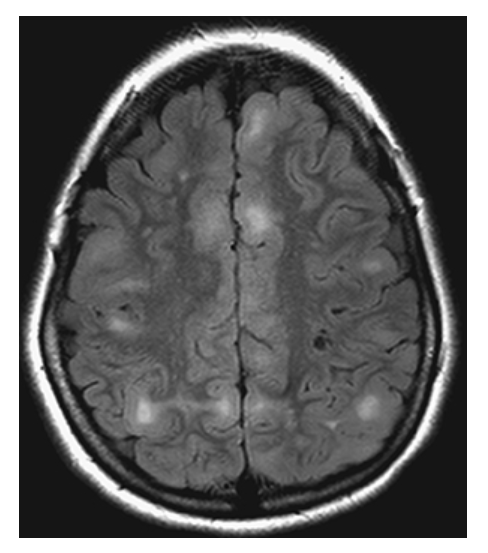
Tuberous Sclerosis. Axial FLAIR shows multiple hyperintense cortical and subcortical nodules and small low-signal-intensity cystic lesions.

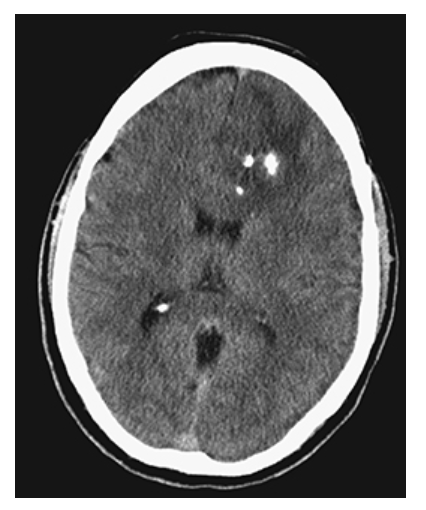
What is A
Sturge-Weber Syndrome. Noncontrast CT images of the brain and bone window
What is B
Sturge-Weber Syndrome. Noncontrast CT images of the brain demonstrate bilateral frontal and parietal cortical calcifications.
What is A
Sturge-Weber Syndrome. Postcontrast T1W axial and coronal

What is B
Sturge-Weber Syndrome. Postcontrast T1W axial images show cerebral atrophy.
What is A
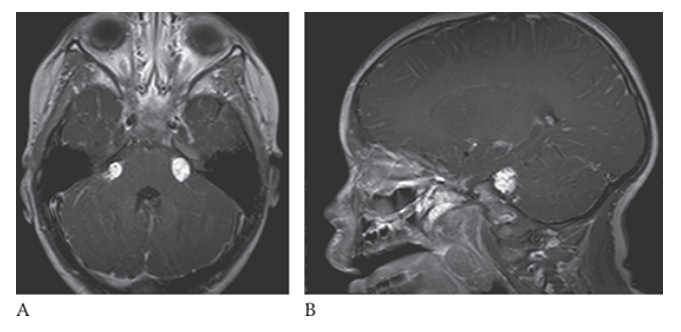
Von Hippel-Lindau Disease. Axial T1W shows a small hypointense nodule in the medial aspect of the left cerebellar hemisphere which enhances with contrast administration T1W with gadolinium

What is B
Von Hippel-Lindau Disease. Axial T1W
Von Hippel-Lindau Disease. A small enhancing nodule is seen on a sagittal T1W image with gadolinium. These are likely hemangioblastomas in this patient with Von Hippel-Lindau (VHL) disease.

What is A
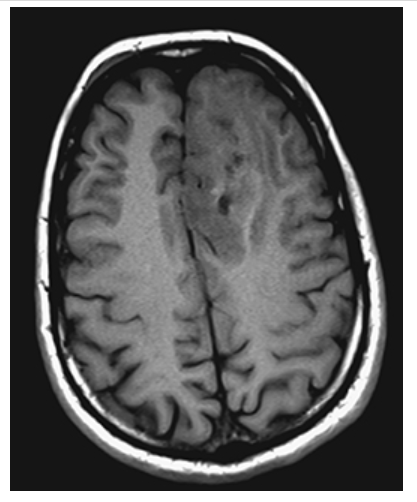
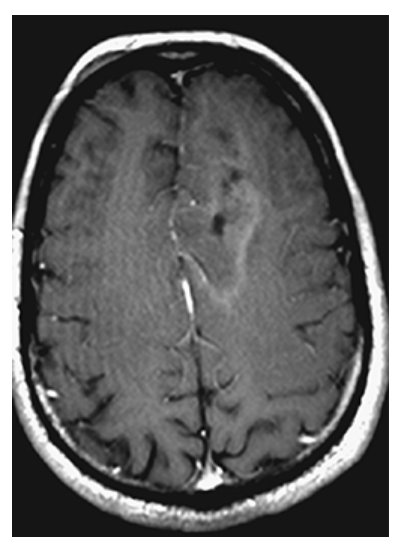
Arteriovenous Malformation. Axial T1W pre- and postcontrast
What is B
Arteriovenous Malformation. Axial T1W pre- enhanced images show a left frontal lobe mass with surrounding edema, minimal peripheral enhancement, and “worm”-like flow voids.
Arteriovenous Malformation. T2W axial image shows hyperintense edema around the mass of “worm-like” flow voids.
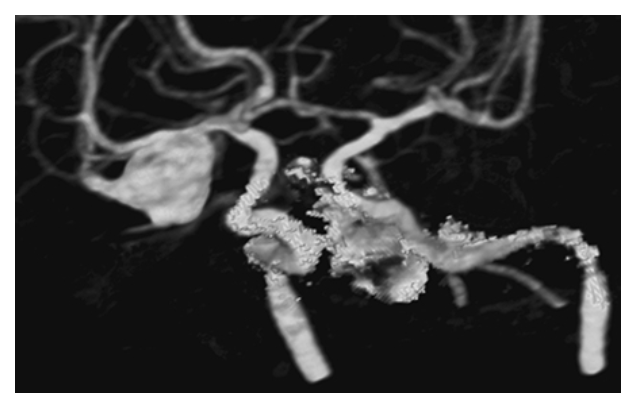
Intracranial Aneurysm. Computed tomography angiography (CTA) 3D reconstruction shows a large right M1 middle cerebral artery (MCA) aneurysm.

What is A
Intracranial Aneurysm. Axial T1W pre- and postcontrast
What is B
Intracranial Aneurysm. Axial T1W pre-enhanced images show an enhancing mass in the region of the right MCA.
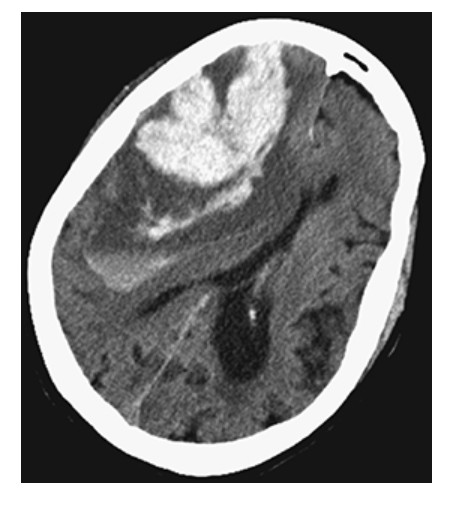
Intracerebral Hemorrhage. Axial NECT shows a large hyperdense region in the right parietal lobe consistent with acute hemorrhage. This is surrounded by low-attenuation cerebral edema. Note the mass effect and midline shift.
What is A
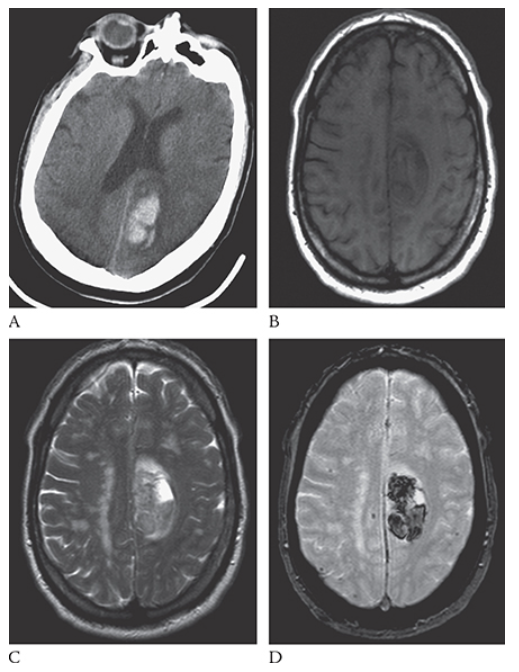
Intracerebral Hemorrhage. Axial NECT image shows an acute hemorrhage in the left posterior parietal lobe. Note the blunting of the left ventricle. An axial T1W image

What is B
Intracerebral Hemorrhage. Axial NECT image shows this area as isointense to hypointense. T2W axial image
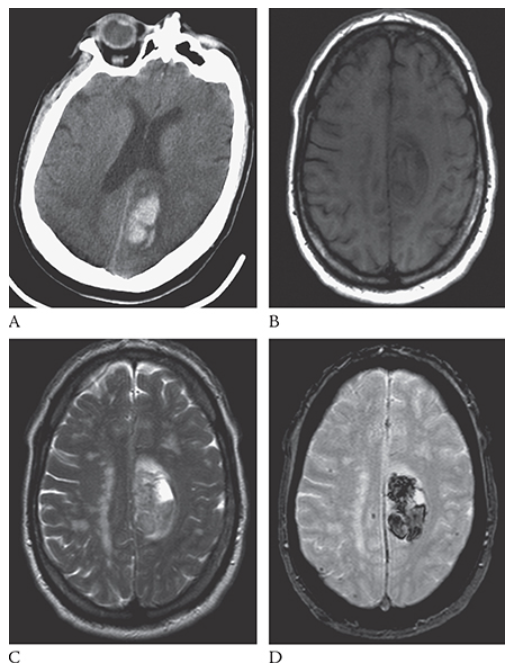
What is C
Intracerebral Hemorrhage. Axial NECT image shows the blood to be mildly hyperintense. Gradient echo axial MR

What is D
Intracerebral Hemorrhage. Axial NECT image shows the blood products to be hypointense.

What is A
Ischemic Stroke. Axial T1W image shows an area of low signal in the white matter and increased signal of the gray matter in the right posterior parietal lobe. An axial T2W image
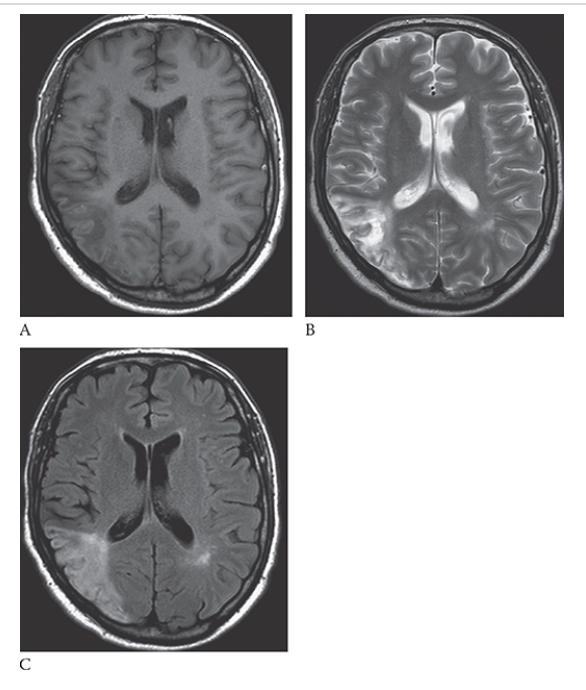
What is B
Ischemic Stroke. Axial T1W image shows increased signal in this area consistent with edema. FLAIR

What is C
Ischemic Stroke. Axial T1W image shows increased signal in the white and gray matter in this region.

What is A
Ischemic Stroke. The portions of the area are bright on diffusion-weighted imaging but this is also bright on the apparent diffusion coefficient (ADC) map
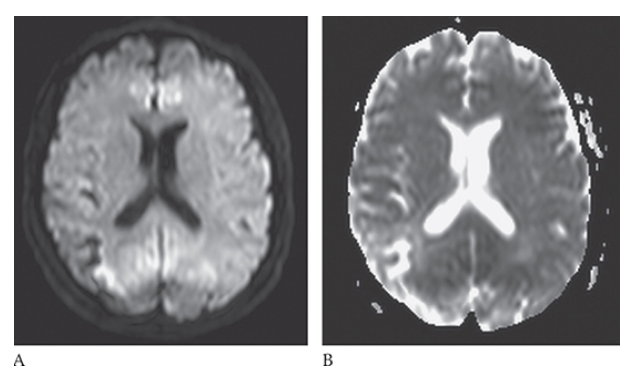
What is B
Ischemic Stroke. The portions of the area are bright on diffusion-weighted imaging consistent with a subacute infarct.

What is A
Ischemic Stroke. In an acute stroke the diffusion will be bright and the ADC map will be dark
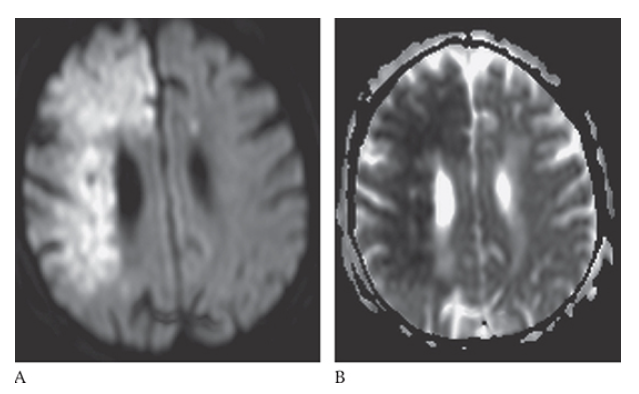
What is B
Ischemic Stroke. In an acute stroke the diffusion will be bright
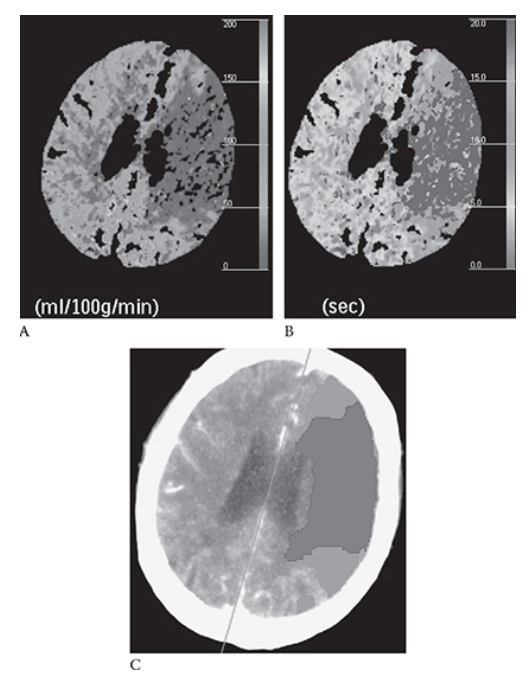
What is A
Ischemic Stroke. Same patient as in Figure 5 with the left MCA stroke. Shows decreased cerebral perfusion to this area (blue) Mean transit time is prolonged (blue)

What is B
Ischemic Stroke. Same patient as in Figure 5 with the left MCA stroke. Shows decreased cerebral perfusion to this area (blue) In image

What is C
Ischemic Stroke. Same patient as in Figure 5 with the left MCA stroke. Shows decreased cerebral perfusion to this area (blue) red represents an infarct; green represents the penumbra of threatened (at risk) ischemic brain that may potentially be saved with an intervention. (see Color Insert).

What is A
Ischemic Stroke. NECT axial image shows a hyperdense left MCA. There is decreased attenuation in the left MCA territory
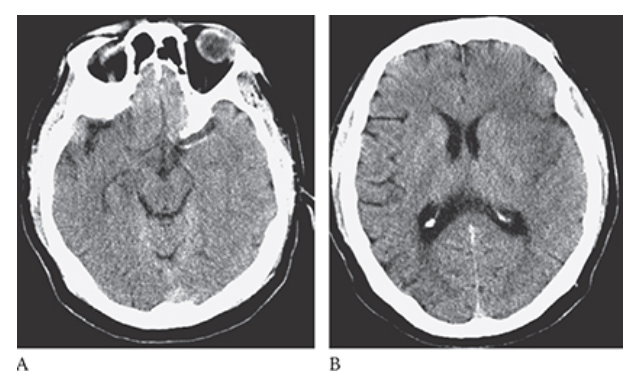
What is B
Ischemic Stroke. NECT axial image in the same patient and loss of the gray with differentiation resulting in the “insular ribbon sign.”
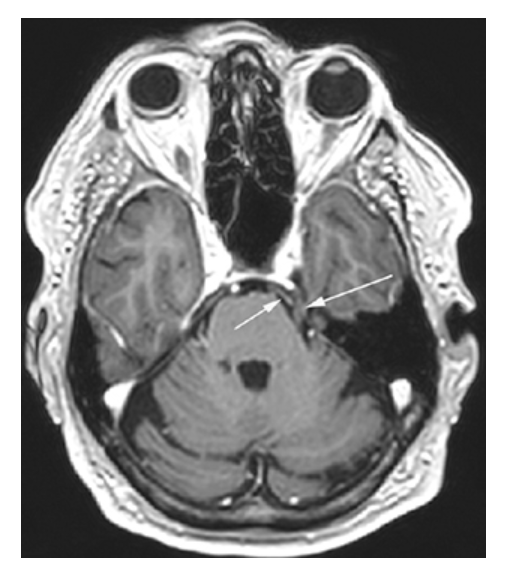
Neurovascular Compression Syndrome. MRA-TOF shows contact between the left posterior cerebral artery (PCA) (short arrow) and the left trigeminal nerve CN 5 (long arrow). In this individual, the vascular loop induced trigeminal neuralgia.