Unit 1: Thinking Geographically
1/49
Earn XP
Description and Tags
Name | Mastery | Learn | Test | Matching | Spaced | Call with Kai |
|---|
No analytics yet
Send a link to your students to track their progress
50 Terms
Reference Maps
maps that show landforms or places, such as physical maps (show mountains, rivers,) and political maps (countries, cities)
Thematic Maps
maps that are used to display specific information about an area
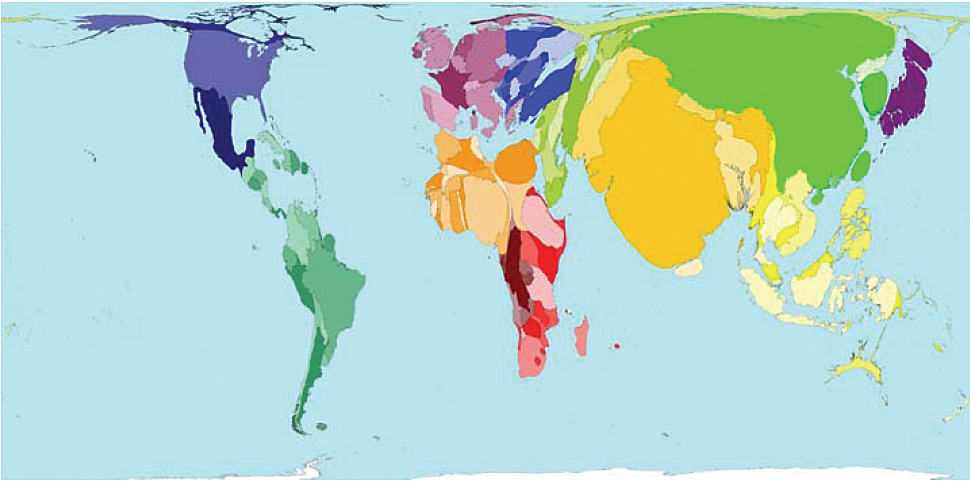
Cartogram
a thematic map that conveys information by distorting space

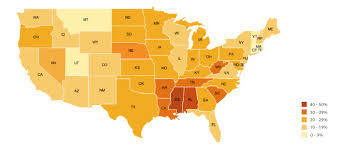
Choropleth Map
a thematic map that uses shading or coloring to show statistical data

Dot Density Map
a thematic map that uses dots or other symbols to display numbers of occurrences

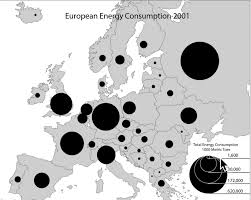
Graduated Symbols Map
a thematic map in which the size of a symbol varies in magnitude proportional to the value it represents

Absolute Distance
measurement using a standard unit of of length (ft, km, m, miles)
Relative Distance
the connection or disconnection between two places as a means of social, cultural, and/or economic factors
Absolute Location
location that uses compass direction, latitude/longitude coordinates, or an address
Relative Location
the location of one place in relation to another place, often described using directional terms or distance
Spatial Pattern
the way things are laid out and organized on Earth’s surface
Clustering
a spatial pattern where objects are grouped together (a coastal population)
Dispersal
a spatial pattern where objects are scattered (rural population)
Elevation
a spatial pattern, the height above sea level
Spatial Scale
a hierarchy of space, from global → regional → national → local
Map Distortion
all maps are distorted as a result of projecting a 3-dimensional surface onto a 2-dimensional surface
in area, distance, shape, and/or direction
Map Projection
a way to transfer the 3-dimensional earth onto a 2-dimensional map to reduce distortion
in area, distance, shape, and/or direction
Mercator Projection
Preserves accurate compass direction but distorts area of landmasses relative to each other. Landmasses become increasingly distorted, or large in size, at high latitude near the North and South Poles. Originally created by projecting the Earth’s features onto a cylinder (a cylindrical projection), which results in lines of latitude becoming parallel rather than intersecting leading to tremendous distortion at the poles
Peters Projection
A cylindrical projection that retains accurate sizes of all the world’s landmasses. Reveals how large the landmasses near the equator actually are. Often viewed as a political statement – an attempt to focus attention on the world’s poorest countries.
Fuller Projection
Maintains the accurate size and shape of landmasses but completely rearranges direction. Cardinal directions—north, south, east, and west—no longer have any meaning.
Robinson Projection
An example of an attempt to balance projection errors. Does not maintain accurate area, shape, distance, or direction but minimizes errors in each. Provides an aesthetically pleasing balance, leading to its frequent use by cartographers at organizations such as the National Geographic Society (where the projection was made).
Azimuthal Projection
Planar projections are formed when a flat piece of paper is placed on top of the globe and a light source projects the surrounding areas onto the map. Either the North Pole or the South Pole is oriented at the center of the map, giving the impression of looking up or down at the Earth.