unit 3 price determination
1/29
There's no tags or description
Looks like no tags are added yet.
Name | Mastery | Learn | Test | Matching | Spaced |
|---|
No study sessions yet.
30 Terms
demand def
the quantity of a good or service that consumers are willing and able to buy at a given price
law of demand
price up = demand down
price down = demand up
income effect
as prices go up, real income decreases, leading to a decrease in quantity demanded
substitution effect
as a price of a good goes up, other substitute goods become more competitive
factors effecting demand
Population
Advertising
Substitutes
Income
Fashion / Trends
Interest rates
Complements
supply def
quantity of a good or service producers are willing and able to supply at a given price
factors effecting supply
Productivity
Indirect tax
Number of substitutes
Technology
Substitutes
Weather
Coast of production
free market def
anywhere buyers and sellers meet to exchange goods or services
equilibrium
demand = supply
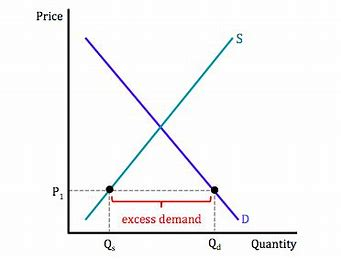
excess demand
signal
incentive
ration
allocate
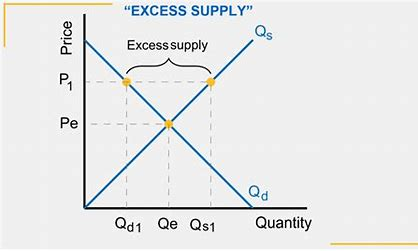
excess supply
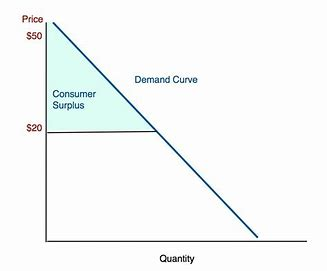
consumer surplus
consumers above P1 are willing to pay more but paid 20 dollars
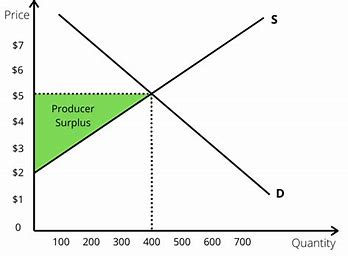
producer surplus
producers below p1 are willing to sell/produce the good for a lower price
joint demand (complements)
demand for one good generates demand for another related good
printers and ink
competitive demand (substitutes)
demand for a good when there are many substitutes available
coke and pepsi
derived demand
demand for a good comes from demand for another good
plane tickets and holidays
composite demand
two goods require the same input to make them
cheese butter
demand up for cheese = less supply of butter
joint supply
a product that can be used to produce multiple goods
an increase in the production of one good leads to an increase in the supply of another
beef and leather
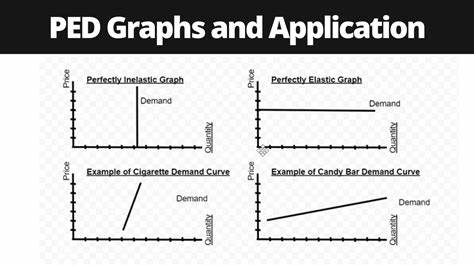
PED
measures the responsiveness of QD given a change in price
(% change in QD / % change in price) x 100
PED is always negative
>1 = elastic, change in QD is proportionally greater than change in price
<1 = inelastic
0 = perfectly inelastic
infinite = perfectly elastic
determinants of PED
number of substitutes
necessity or not
% of income
habit forming
PED elasticity graphs
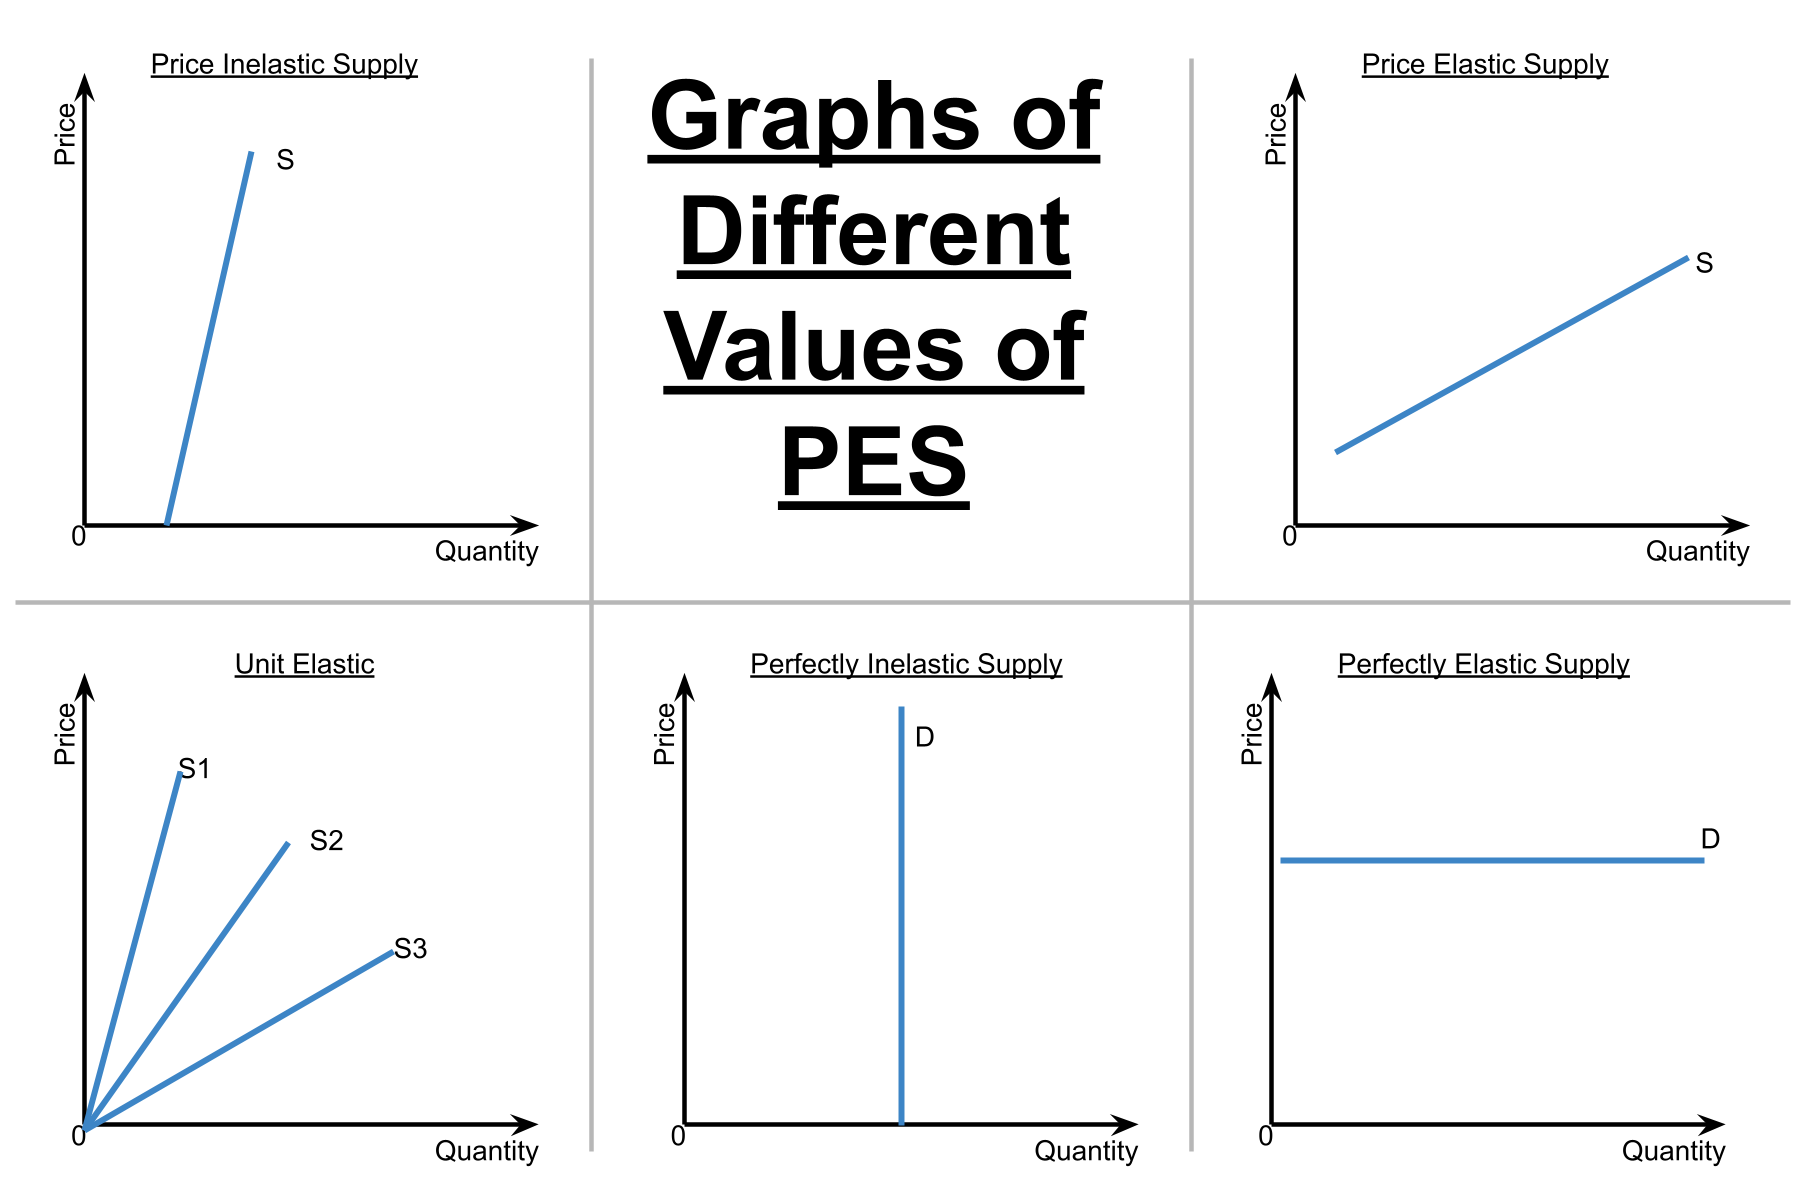
PES
measures the responsiveness of quantity supplied to a change in price
(% change in QS / % change in price) x 100
PES is always positive
>1 = elastic
<1 = inelastic
0 = perfectly inelastic
infinite = perfectly elastic
determinants of PES
time and production speed / lag
more elastic if time in longer they can adject production level
stock
more = easier to meet demand = elastic
space productive capacity
more capacity = easy to increase out put = elastic
substitutes FOP
easier to get = more elastic
PES elasticity graphs
short run vs long run
short run - at least 1 FOP is fixed
long run = all FOP are variable
XED (cross price elasticity)
measures the responsiveness of quantity demand of good A given a change in price of good B
(% change in QD of good A / % change in price of good B) x 100
positive = substitutes
0 to 1 = weak substitute, inelastic
>1 = strong substitute, elastic
negative = complement
0 to -1 =weak complement, inelastic
<-1 = strong complement, elastic
YED (income)
measures the responsiveness of quantity demand given a change in income
(%change in QD / % change in income) X 100
positive = normal good
negative = inferior good
normal good
demand increased as incomes rise
necessities, essential goods
0 to 1, inelastic
luxury goods
>1, elastic
inferior good
demand falls as incomes rise
competing supply
increase in supply of good A causes a decrease in supply of good B
same FOP are required to produce both