PSYC class
1/82
There's no tags or description
Looks like no tags are added yet.
Name | Mastery | Learn | Test | Matching | Spaced | Call with Kai | Chat |
|---|
No analytics yet
Send a link to your students to track their progress
83 Terms
Fill in the blanks
1. Represent and summarize ________, ________, or ________ (from a variety of sources).
2. Represent and summarize the ________ of ________ testing of those course goal 1.
3. ________ and ________ the ________ of the studies testing those course goal 1.
1. Represent and summarize theories, explanations or hypotheses (from a variety of
sources)
2. Represent and summarize the results of studies testing of those theories,
explanations or hypotheses (e.g., graphics, statistical tests, interpretations)
3. Evaluate and critique the quality of the studies testing those theories, explanations
or hypotheses.
Casual model
A causal model is a diagram of the causes of constructs within a theory or explanation.
How is the casual model formatted?
An initiating factor → leads to a mechanism → then leads to an outcome behavior
Why are causal models useful/important?
• Reading about or writing out theories
• Examining parts of theories that studies tested
Case study
in-depth descriptive study of one (or few) using observation, interview and testing
Naturalistic observation
Researcher observes what happens in the natural world as systematically and objectively as possible.
Laboratory observation
Researcher systematically and objectively observes what happens in a more controlled setting and with more sophisticated equipment.
Correlational design
A research strategy designed to determine how two or more variables relate (covary). In contrast to an experimental design, the researchers using a correlational model measure only, they don't manipulate any variables.
Quasi-experimental design
When it is impossible, impractical, or unethical to manipulate a variable, Researcher may rely on differences that occur naturally.
Experimental design
Researcher systematically manipulates one or more variables and measures the effect of this manipulation on other variables, while controlling influence of extraneous variables.
Correlational Design
A non-experimental design that determines how 2 or more variables relate to each other without manipulation.
• This is important because it permits statements about the strength, directions,
and form of relations between variables that cannot be ethically or practically
manipulated in other types of designs.
How is a Quasi-experimental design different compared to correlational and experimental designs?
def: a research design that is like an experiment but does not involve actual manipulation of a variable(s) because it is impossible, impractical, or unethical to manipulate.
• The research instead relies on classified of naturally occurring differences (e.g., gender).
• It is important because it allows us to investigate factors that we would otherwise not be able to examine.
• It is also important to note that it does not allow us to make causal statements because the variable was not manipulated so there could be many uncontrolled extraneous factors confounded with our quasi-variable.
How is an experimental design different compared to correlational or quasi designs?
def: Research in which IVs are manipulated, and behavior is measured (DV) while extraneous variables are controlled.
• For between-subjects factors, participants are randomly assigned to condition.
• For within-subjects’ factors, participants receive all levels, but they are randomly assigned to different treatment orders.
• This design is important to research because it is the only design that permits causal statements and it has the best level of control.
Dependent variables
the thing (variable) that is measured in an experiment. One might think of an experiment as a way of determining whether this variable is dependent on the variable manipulated by the experimenter. In nonexperimental research, it refers to the variable that is affected or a consequence of some other variable or variables.
Independent variables
-- in an experiment it is the variable or variables that are manipulated.
In nonexperimental research, it refers to the variable that is the presumed cause or
antecedent condition of another variable considered in the research.
Controls
when investigating possible relationships among variables, Researcher needs techniques to be confident that the relationships observed reflect the actual facts, rather than some bias, contamination, or mistake in the research procedures.
Achieved by various techniques of control, including, for example, random sampling of subjects, careful design of experimental methods to ensure that extraneous or uncontrolled variables don’t influence the results, measurement of possibly related variables, various statistical procedures, and so on. In fact, much of what is involved in learning to do research may be thought of in terms of learning to achieve appropriate controls in investigation.
Clues to id design (correlational design)
• Asks people how much they do something
• Just measures. No manipulation and No random assignment
• No grouping. Just whatever values participants have on the measure
Type of conclusion allowed:
Association between IV and
DV
Clues to id design (quasi-experimental design)
• Put people into groups based on how their own behavior
• No manipulation and No random assignment
• Grouping into conditions
Type of conclusion allowed:
Association between IV and
DV
Clues to id design (experimental design)
• Experiment decides what person does (experimenter puts people into
groups based on random assignment)
• Some control condition
• Controlling other factors
Type of conclusion allowed:
Causal relationship (ONLY ONE DESIGN CAN HAVE THIS RELATIONSHIP).
(Case Study) Advantages & Disadvantages
adv: rich and exploratory data for later hypotheses, rare/unusual information.
dis: timely, misinterpretation.
(Naturalistic observation) Advantages & Disadvantages
adv: real and authentic, rich descriptive data.
dis: observer bias, little control, researcher may influence behavior.
(laboratory observation) Advantages & Disadvantages
Adv: rich descriptive data; hypotheses for later testing.
Dis: observer bias; researcher may influence behavior; little control (but more than naturalistic); less natural behavior.
(correlational design) Advantages & Disadvantages
Adv: shows strength between 2 variables; hypotheses for later testing.
Dis: third variable problem; directionality problem.
(quasi-experimental design) Advantages & Disadvantages
Adv: shows strength between 2 variables; hypotheses for later testing; good for unethical/impossible manipulation.
Dis: third variable problem; directionality problem.
(experimental design) Advantages & Disadvantages
Adv: allows for causal statements; best level of control.
Dis: findings may not always generalize to outside world.
Constructs
behaviors, motives, attitudes, ideas concepts intended to explain and understand.
Problem
often unobservable
Solution
infer unobservable constructs from observable behaviors and responses
Operational definition
specifying a variable in terms of the procedures, operations, observations, or tests used to measure that variable. Note this is not an experiment. It is a method to explicitly define a construct so that two independent people will interpret it in the same way.
Hypothesis
a testable relationship between two or more variables (or constructs)
3 important elements:
1. Independent variable (IV) – what varies/is manipulated
2. Dependent variable (DV) – what is being measured
3. Type of relationship between them – causal or correlational
Prediction
Operationalizing the constructs within the hypothesis
op def level
Practice scenario: A researcher wanted to examine whether generative
learning strategies lead to better academic performance. To test this,
participants were randomly assigned to either a generative strategy condition
or a non-generative strategy condition, and students’ performance was
assessed by their final exam score.
• What is the IV construct? _________________
• What is the IV Op Def (in correct format)______________
• What is the DV construct? _________________
• What is the DV Op Def? __________________
• What is the IV construct? Generative Learning
• What is the IV Op Def (in correct format) Generative Learning 2 (generative
strategy, non-generative strategy)
• What is the DV construct? Academic Performance
• What is the DV Op Def? Final Exam Score
Title Page
title, author’s names, affiliations, plus heading stuff
Abstract
brief but complete summary of paper (1-2 sentences per section)
Introduction
provide background and motivation for experiments as well as specific hypotheses and predictions
Methods
how the study was conducted in enough information about the study so a reader can repeat it in all its essential details.
Results
outcome of experiment by detailed listing of statistically significant results.
Discussion
restatement and interpretation of result with special care in tying them to theory and related literature
References
all (and only) papers specifically mentioned in the paper
Tables
numbers or text segmented in rows and columns to clarify or highlight methods or results
Figures
graphs, diagrams, or pictures to clarify or highlight a point
Model of a Journal Article – put in the correct order!
• Results
• Methods
• Discussion
• Citation
• Introduction
• 0. Citation
• 1. Introduction
• 2. Methods
• 3. Results
• 4. Discussion
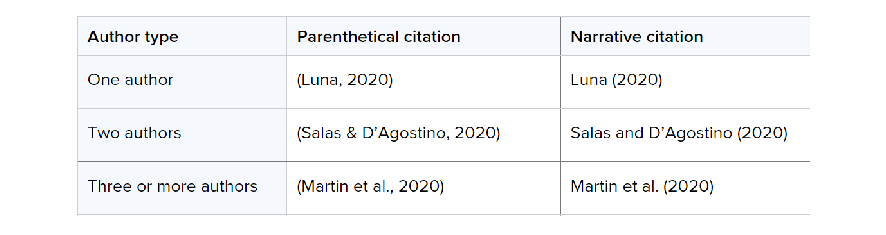
APA Citations
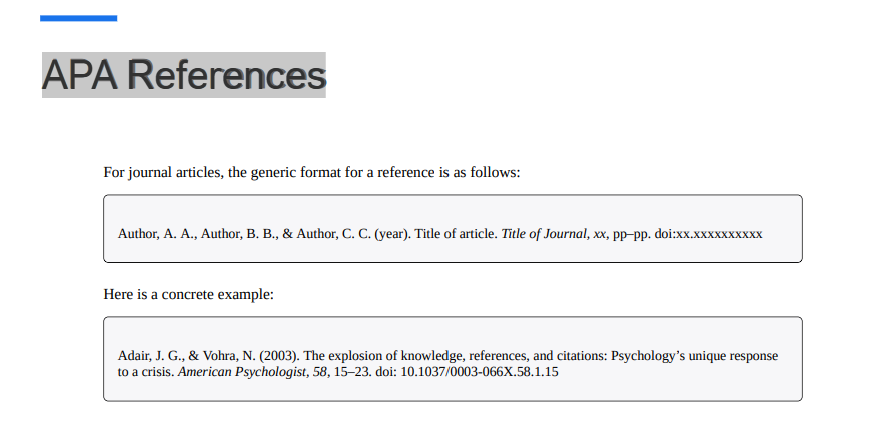
APA References
Try to write out:
1. How it would be cited in the body of the paper:
A. as part of the sentence
B. as a parenthetical
2. How it would look in the reference section of the paper (end of paper).
1. How it would be cited in the body of the paper:
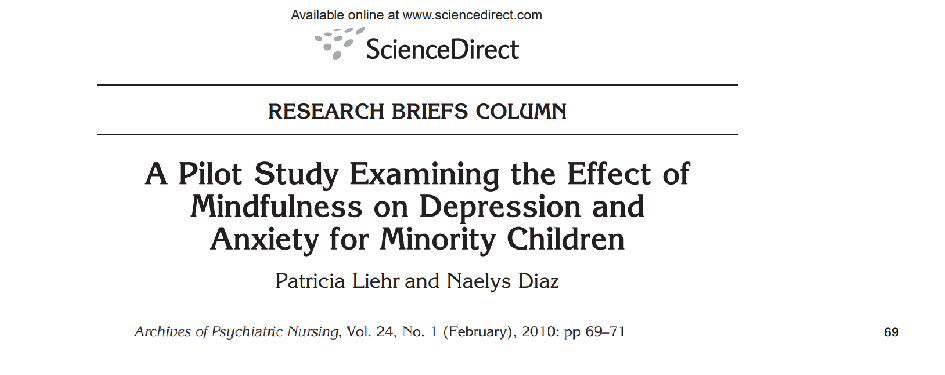
A. as part of the sentence: Liehr and Diaz (2010) tested …
B. as a parenthetical: (Liehr & Diaz, 2010)
2. How it would look in the reference section of the paper (end of paper):
Liehr, P., & Diaz, N. (2010). A pilot study examining the effect of mindfulness on
depression and anxiety for minority children. Archives of Psychiatric
Nursing, 24(1), 69-71.
Validity
the degree to which a test measures what it is said to measure.
Validity = Accuracy
"Does the test measure what it's supposed to measure?"
Reliability
an estimate of the replicability of a test score.
Face validity
(the degree to which) test appears to measure what it is supposed to measure E.g., A test for measuring comprehension of history tests, may ask students to read history material and then write a summary of it or put the events in order. Looking at the test, you can quickly see that comprehension of text is necessary for carrying out the task. Evaluated by judgement call.
Does my measure make sense?
Scenario:
A researcher creates a new depression questionnaire. Students read the questions and say, "These questions definitely look like they're measuring depression."
Why? Nobody actually tested whether it measures depression. They're only saying: "Yeah...this looks like a depression questionnaire." That's appearance.
Think of it like this: Someone designs a math test. Questions include: 8 + 7 15 × 4 25 ÷ 5 You'd probably say, "Looks like a math test." That doesn't prove it's a good math test. It just looks right.
Content validity
(the degree to which) measure reflects the actual material, substance, or content of the variables measured
E.g., For the history text example, you would directly and systematically check all the questions, materials and tasks to determine the degree to which they deal with significant information about learning history. The range of material sampled should be rather complete.
Evaluated by systematically comparing the content of the test to the measurement objectives
Scenario
A professor creates a psychology final exam. She makes sure the exam includes questions from every chapter covered during the semester.
Why?
The important clue is: Every chapter Content validity asks: Did the test cover all parts of the topic?
Imagine your professor taught: Memory Learning Personality Research methods
The final asks questions from all four. That's good content validity.
Construct validity asks: Does it actually measure psychology knowledge?
Criterion-related validity
(the degree to which) measure allows distinctions among participants on some behavioral standard
E.g., do GRE scores permit us to determine who will succeed in grad school Evaluated by showing that scores correlate well with measures of performance at same time or predict scores at a later time
Note: assess relationship between measure and another measure
Concurrent validity
relate measure to other measures taken at the same time
E.g., develop new test to measure aggressiveness in interpersonal relations. When you administer
your new measure you also have teacher rate the subject’s aggressiveness in the classroom. Then test
whether you get a high correlation between your new test and the teacher ratings.
Predictive validity
test whether your measure predicts the future related behavior (at different time)
E.g. give new aggressiveness test and one year later have teachers rate the behavior on degree of
aggressiveness to see if high scores on your new measure were produced from the kids who were
also rated as more aggressive while low scores were produced by the least aggressive kids one year
later.
Concurrent vs predictive:
SAT vs high-school grades vs SAT predicting college grades.
Evaluated by showing that scores correlate well with measures of performance at same time or predict scores at a later time
Construct validity
(the degree to which) test measures the construct it is supposed to measure. E.g., correlation of new measure of text anxiety with standard school adjustment test. If unrelated, then question that your actually measuring test anxiety
Evaluated by correlation with other standard measures of other relevant constructs or by the opinion of experts in the area.
Note: assess relationship between measure and construct
Interrater Reliability
agreement between two sources at the same time
Test-retest Reliability
agreement over a specified period of time
Split-half Reliability
agreement among different parts, internal consistency
Science
is the systematic use of evidence to answer questions.
Characteristics:
Based on empirical evidence (observation and measurement)
Tests hypotheses
Results can be replicated
Open to being wrong and revised with new evidence
Example
A psychologist tests whether sleep improves memory by conducting an experiment.
Psuedoscience
Characteristics:
Relies on anecdotes or testimonials
Doesn't test claims scientifically
Avoids disconfirming evidence
Makes claims that can't really be tested
Examples
Astrology predicting personality
Crystal healing
Psychic readings
These may make claims, but they generally lack strong empirical support.
Empiricism
Knowledge comes from observation and evidence.
Scientists collect data instead of relying on opinions.
Example Instead of saying "I think exercise reduces stress."
Researchers measure exercise stress and analyze the results.
That's empiricism.
Basic Research
Purpose: Increase scientific knowledge.
Not necessarily solving an immediate problem.
Example
Studying how memory works.
No immediate practical goal.
Easy memory
Basic
↓
Builds knowledge.
Applied Research
Purpose: Solve a real-world problem.
Example
Testing whether a new therapy reduces anxiety.
Applied
↓
Applies knowledge.
Common Sense
Ideas people think are obviously true.
Example
"Money buys happiness."
Sometimes true.
Sometimes not.
Common sense isn't scientific evidence.
Folk Psychology
Everyday explanations for behavior.
Examples
"Opposites attract."
"People only use 10% of their brain."
"Children imitate violent TV."
Some are true.
Some aren't.
Science tests them instead of assuming they're true.
Confirmation Bias
People look for evidence supporting what they already believe while ignoring evidence against it.
Example:
You believe left-handed people are more creative.
Every time you meet a creative left-handed person...
You remember it.
When you meet an uncreative left-handed person...
You forget.
That's confirmation bias.
Skepticism
Definition
Scientists question claims until there is good evidence.
Not:
"Deny everything."
Instead:
"Show me the evidence."
Example
Someone says
"This vitamin doubles memory."
A scientist asks
"What studies support that?"
Tolerance for Uncertainty
Definition Being comfortable saying "We don't know yet."
Science rarely proves things with 100% certainty. Scientists accept uncertainty until more evidence is available.
Example
A researcher says "Current evidence suggests this therapy works, but more research is needed."
That's tolerance for uncertainty.
Phenomena
is an observable behavior or mental process that researchers notice and want to understand or explain.
The key point is: not an explanation. It is what happens, not why it happens.
What are theories used for?
A well-supported explanation of a phenomenon that organizes existing evidence and generates new predictions.
Notice: It is NOT just a guess. It explains why something happens.
It is supported by evidence
Explains phenomena
Organize existing knowledge
Generate hypotheses
Guide future research
How are theories tested?
Step 1 Observe a phenomenon.
↓
People who sleep more remember better.
Step 2
Develop a theory.
↓
Sleep improves memory consolidation.
Step 3
Derive hypotheses.
↓
People sleeping 8 hours will recall more words.
Notice: You don't test the theory directly. You test the hypothesis.
Step 4 Conduct research. Collect data. Analyze results.
Step 5 Compare results with the hypothesis. Did the prediction happen?
How are theories revised?
Example:
Theory:
Stress hurts memory.
Researchers discover:
A little stress actually improves memory.
The theory becomes:
High stress hurts memory, but moderate stress may improve it.
The theory was revised.
Visual Flow
Phenomenon
        ↓
Develop Theory
        ↓
Derive Hypothesis
        ↓
Test Hypothesis
        ↓
Collect Evidence
        ↓
Support or Revise TheorySampling
Sampling is the process of selecting a group of people (a sample) from a larger population to participate in a study.
Population
The entire group the researcher wants to study.
Sample
The smaller group that actually participates in the research.
Example:
Population: All college students in the United States.
Sample: 300 randomly selected college students.
Why is sampling important?
Researchers usually cannot study an entire population, so they use a sample. The sample should represent the population as closely as possible so the results can be generalized.
Measurement
the process of observing and recording variables using specific procedures or instruments.
Bar Graph
A bar graph is used to compare differences between groups (categorical variables).
Example:
Group A: Average exam score = 82
Group B: Average exam score = 91
A bar graph clearly compares the two groups.
Exam clue:
If you are comparing separate groups, think BAR GRAPH.
Scatterplot
A scatterplot shows the relationship (correlation) between two quantitative variables.
Example:
Hours Studied (X)
Exam Score (Y)
Each dot represents one participant.
Patterns:
• Positive correlation:
As one variable increases, the other also increases.
Hours Studied ↑
Exam Score ↑
• Negative correlation:
As one variable increases, the other decreases.
Exercise ↑
Stress ↓
• No correlation:
No consistent pattern between the variables.
Exam clue:
If you're looking at the relationship between two measured variables, think SCATTERPLOT.
Why Correlation Does NOT Imply Causation
A correlation means two variables are related.
It does NOT mean one variable causes the other.
Why?
1. Third-variable problem
A third variable may explain the relationship.
Example:
Ice cream sales and drowning deaths both increase in the summer.
Does ice cream cause drowning?
No.
Third variable:
Hot weather.
2. Directionality problem
You may not know which variable came first.
Example:
Social media use and anxiety are positively correlated.
Possibilities:
- Social media increases anxiety.
- Anxiety causes people to use social media more.
- Another variable influences both.
Because of these possibilities, correlational studies cannot establish cause and effect.
Only experimental designs can support causal conclusions.
Appropriate Conclusions From a Correlation
Correct conclusion:
"There is a relationship (association) between the variables."
Incorrect conclusion:
"One variable causes the other."
Testable Research Questions
Characteristics of a good research question:
- Clear
- Specific
- Measurable
- Can be answered with data
Good example:
Does sleeping at least 8 hours improve exam performance among college students?
Researchers can:
- Measure sleep.
- Measure exam scores.
- Analyze the results.
Not testable:
Do dreams have spiritual meaning?
Why?
The question cannot be answered objectively using scientific methods.
How Researchers Evaluate a Research Question
Researchers ask:
• Is it clear?
• Can the variables be measured?
• Can data be collected?
• Can it be answered through observation or experimentation?
• Is it ethical to study?
If the answer is yes to these questions, it is generally considered a good, testable research question.