BIOSTATS- Exam 2
1/75
There's no tags or description
Looks like no tags are added yet.
Name | Mastery | Learn | Test | Matching | Spaced |
|---|
No study sessions yet.
76 Terms
Density Curve
A smooth curve that represents the distribution of a continuous random variable. The area under the curve corresponds to probabilities, with the total area equal to one.
normal distribution
A symmetric, bell-shaped density curve that describes the probabilities of a continuous random variable. It is defined by its mean and standard deviation.
standard normal distribution
normal distribution but the μ = 0 and σ = 1
z-score
distance along horizontal scale (the # σ from the mean)
to get the area to the left of the graph
pnorm(x)
to get the area to the right of the graph
1 - pnorm(x)
to get the area between two values
pnorm(upper) - pnorm(lower)
critical value
a z score on the borderline separating those z scores that are significantly low or significantly high.
za
z score with an area of a to its right.
Central Limit Theorem
the distribution of sample means approaches a normal distribution as the sample size increases, regardless of the original population distribution.
how large must sample be for CLT
n ≥ 30
for a sample (n ≥ 30) OR the original population is normally distributed
the sampling distribution of the sample means will be approximately normally distributed.
μx̄ = μ
Mean of all values of x̄
σx̄ = σ/√n
Standard deviation of all values of x̄
Normal Quantile Plot
graph of points (x, y) where each x value is from the original set of sample data, and each y value is the corresponding z score that is expected from the standard normal distribution
normal distribution
the pattern of the points is reasonably close to a straight line and the points do not show some systematic pattern that is not a straight-line pattern
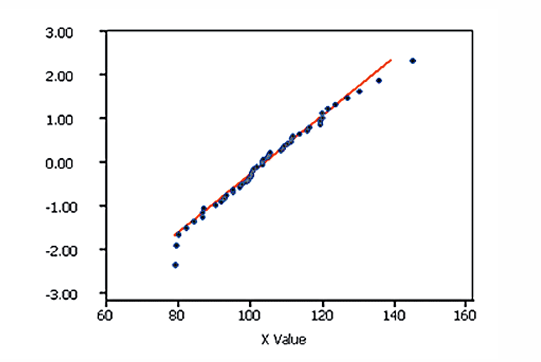
what distribution is this?
Normal
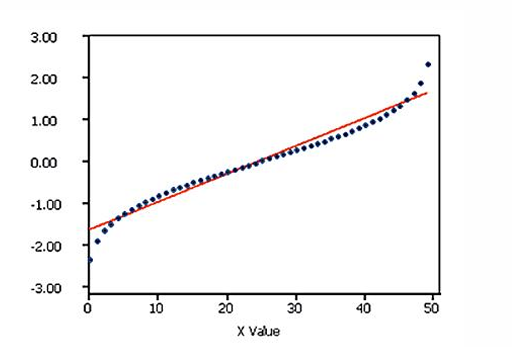
what distribution is this?
not normal; systematic patter
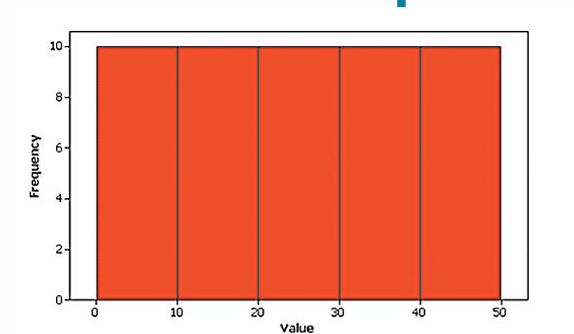
what distribution is this?
uniform
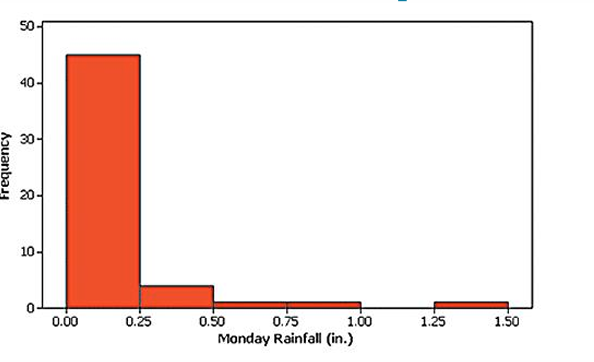
what distribution is this?
skewed
Data transformations
when you transform the data so that the modified values have a normal distribution.
hypothesis
a claim or statement about a property of a population.
hypothesis test (test of significance)
procedure for testing a claim about a property of a population
Null Hypothesis H0
a statement that there is no effect, no difference, or no relationship in the population (any observed difference is due to random chance)
Alternative Hypothesis H1
a statement that there is an effect, a difference, or a relationship in the population (suggests that the null hypothesis is not true)
significance level α
the probability of rejecting the null hypothesis when it is actually true, typically set at 0.05.
What is the sampling distribution for proportions?
Normal (z)
What are the requirements to use the z-test for proportions?
np ≥ 5 and nq ≥ 5
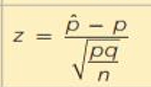
What parameter is tested using this?
Proportion (p)
What test statistic is used when σ is unknown?
t-test
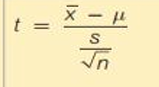
What are the requirements to use the t-distribution for means?
Population is normal or sample size n>30
What is the sampling distribution when σ is unknown?
t-distribution
What test statistic is used when σ is known?
z-test
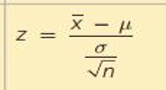
What are the requirements to use the z-distribution for means?
Population is normal or sample size n>30
What is the sampling distribution when σ is known?
Normal (z)
What test statistic is used to test variance?
Chi-square test
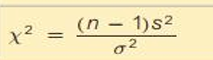
What are the requirements to use the chi-square test?
Population must be strictly normal
What is the sampling distribution for variance?
Chi-square (χ²)
test statistic
a score that tells you how far your sample is from what you'd expect if the null hypothesis were true
critical value method
determines whether to reject the null hypothesis by comparing the test statistic to a critical value.
critical region (rejection region)
the area corresponding to all values of the test statistic that cause us to reject the null hypothesis
critical values
the specific points that define boundaries for the critical region in hypothesis testing.
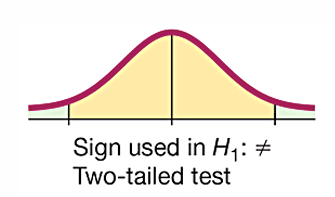
for a two-tailed test, the critical region is in
the two extreme regions (tails) under the curve
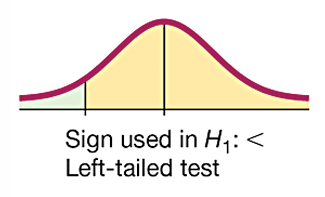
for a left-tailed test the critical region is in
the extreme left region (tail) under the curve
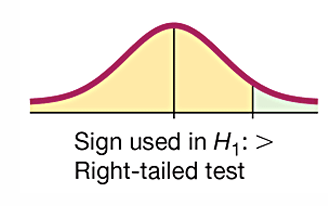
for a right-tailed test the critical region is in
the extreme right region (tail) under the curve.
P-value method
make a decision by comparing the P-value to the significance level
P-value
the probability of observing a test statistic as extreme as the one observed, assuming the null hypothesis is true.
p
population proportion
p̂
sample proportion
if a P-value is > α
fail to reject H0
is P-value is ≤ α
reject H0
type I error
rejecting H0 when it is true
type II error
failing to reject H0 when it is false
conditions for a binomial distribution
• There is a fixed number of trials.
• The trials are independent.
• Each trial has two categories of “success” and “failure.”
• The probability of a success remains the same in all trials.
the Student t-distribution has a mean of
t=0
The standard deviation of the Student t distribution
varies with the sample size and is greater than 1
As the sample size n gets larger, the Student t distribution ____________
gets closer to the standard normal distribution.
all values of X2 are
nonnegative and follow a chi-squared distribution. (not symmetric)
there is a different X2 distribution for
each degree of freedom.
p̄
Pooled Sample Proportion (combines two sample proportions into one)
Pooled sample requirements
samples are from two simple random samples, samples are independent, at least 5 successes and 5 failures in each sample
when is a two tailed test used?
when the claim states that the two proportions are different (but deos not specify which is larger)
what test is used for this claim?
H0: p1 = p2
H1: p1 ≠ p2
Two-tailed test
when is a right-tailed test used?
when the claim states that one proportion is greater than another
what test is used for this claim?
H0: p1 = p2
H1: p1 > p2
Right-tailed test
when is a left-tailed test used?
when the claim states that one proportion is less than another
what test is used for this claim?
H0: p1 = p2
H1: p1 < p2
left tailed test
when the p-value is less than the significance level, we ___
reject the null hypothesis.
when the p-value is greater than the significance level, we ___
fail to reject the null hypothesis.
d̅
represents the mean difference between paired samples in hypothesis testing.
d
individual difference between the two values in a single matched pair
s12
larger of the two sample variances
F-distribution
the dsitribution of the ratio of two sample variances
properties of F-distribution
skewed right (not symmetric), always positive, shape depends on degrees of freedom
if σ12=σ22 (null hypothesis), then F≈ ?
1
when F is larger, that means the
sample variances differ a lot