Quantitative Analysis Exam 1
 Call Kai
 Learn
Learn Practice Test
 Spaced Repetition
 Match
Match Flashcards
 Knowt Play
1/26

There's no tags or description
Looks like no tags are added yet.
Name | Mastery | Learn | Test | Matching | Spaced | Call with Kai | Chat |
|---|
No analytics yet
Send a link to your students to track their progress
27 Terms
Quantitative Analysis
determines how much of a specific substance is present
Qualitative Analysis
identifies what chemical species are present in a sample
Steps of Chemical Analysis
Formulate a question from a general problem
Select analytical procedure based on accuracy, sample size, and cost
Sampling a representative bulk material to analyze
Sample preparation by converting the bulk sample into a suitable form for measurement
Analysis by measuring the concentration of the analyze in replicate samples
Reporting and Interpretation by performing statistical calculation and drawing conclusions

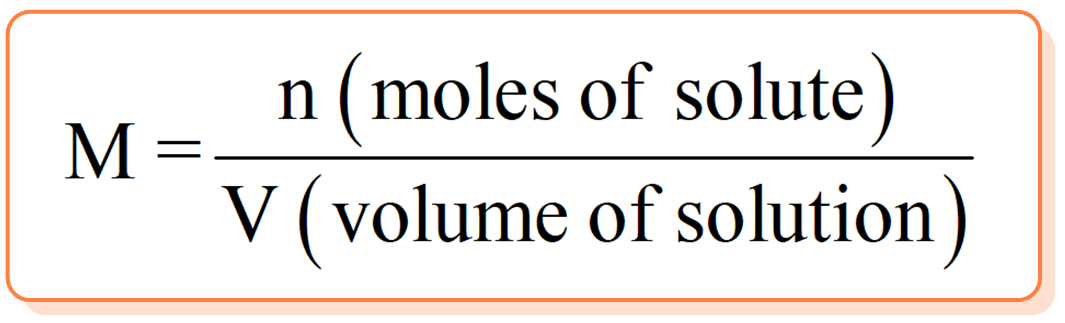
Molarity
moles of solute/liters of solution
Molality
moles of solute/kilograms of solvent
Formal Concentration
total number of formula weights per liter of solution
Percent Composition
mass of solute/mass of solution * 100
Parts Per Million
mass of solute/mass of solution * 106

Dilution

buoyancy correction

Volumetric Glassware
always read the bottom of the liquid meniscus at eye level
Calibrated Class A glassware
accounts for precise temperature and delivery standards
Systematic error
repeatable, traceable, and skews results consistently in one direction; can be eliminated via uncalibrated balance, bad standard
Random Error
unavoidable, unpredictable fluctuations above and below the true mean; cannot be eliminated
addition and subtraction sig figs
answer matches the fewest number of decimals places
Gaussian distribution
bell shaped curve centered at the population mean with width governed by standard deviation
mean
average of a sample set
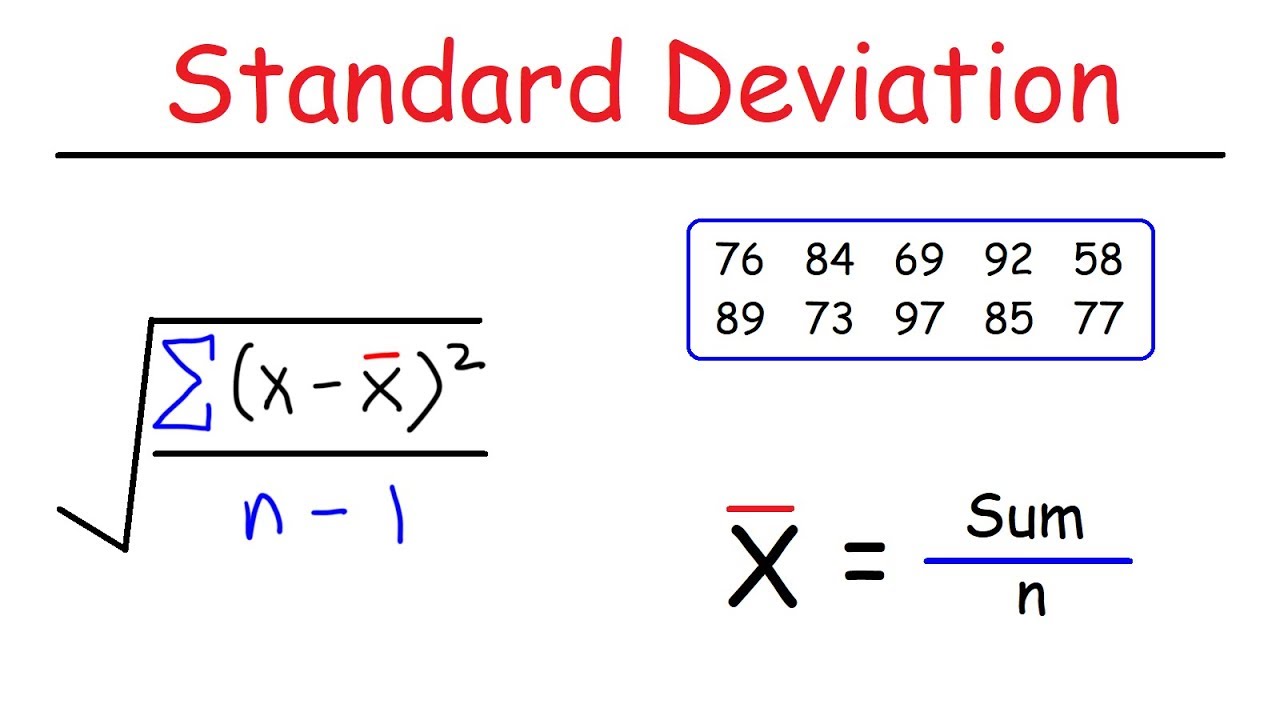
standard deviation
measure of precision
coefficient of variation
standard deviation/mean *100

f test
compares the precision of two methods or sets of data
t test
compares two mean values to see if they differ significantly a a chosen confidence level

g test
identifies statistical outliers
confidence interval
range within which the true mean is expected to lie within given probability
method of least squares
draws the best-fit straight line through data points by minimizing the sum of the vertical deviations squared
Linear range
concentration interval over which instrument response is directly proportional to concentration
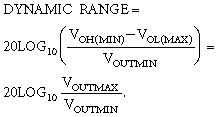
dynamic range
range from the limit of quantitation to where response bends away from linearity
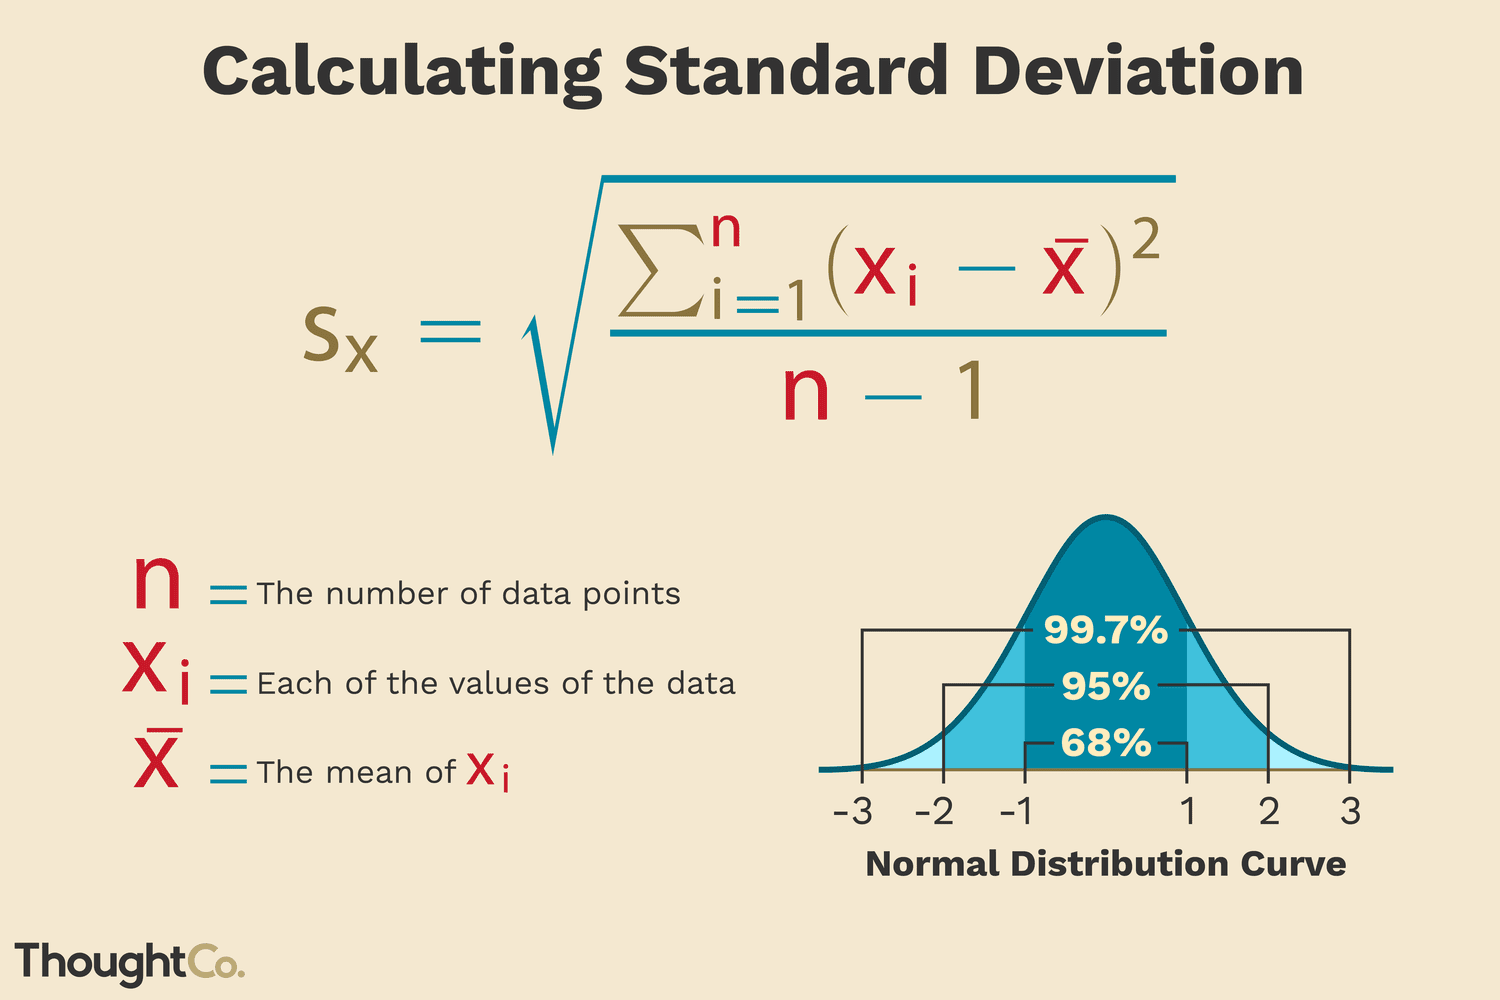
standard deviation
xi = individual measurement
xˉ = sample mean (average)
n = total number of measurements
n−1 = degrees of freedom