5 Extent of chemical reactions
 Call Kai
 Learn
Learn Practice Test
 Spaced Repetition
 Match
Match Flashcards
 Knowt Play
1/25

There's no tags or description
Looks like no tags are added yet.
Name | Mastery | Learn | Test | Matching | Spaced | Call with Kai | Chat |
|---|
No analytics yet
Send a link to your students to track their progress
26 Terms
what are reversible reactions?
equilibrium arrows in which the reactants re-from into products
what are irreversible reactions?
occurs only in the forward direction; reactants do not reform from products
what is the content of reactions?
the amount of product formed at equilibrium
what is yield?
the amount of product formed at equilibrium
what is an equilibrium reactions?
a dynamic reaction where the forwards and reverse reactions are equal - same speed - cancel each other out - concentration becomes constant
must be a closed system
for a system to be at dynamic equilibrium…
concentration must be constant
pressure of the system is constant
temperature of the system is constant
forward/reverse occur at the same time
what is the extent of a reaction?
the degree to which the reactants are converted to products and describes the equilibrium position
how do you calculate percentage yield?
percentage yield = actual / theoretical X 100
what is the equilibrium constant?
a degree of conversion from reactants to products in an equilibrium reaction, that can only be affected by temperature
compares the ratio of concentration:
high K: significant reactions → products conversion significant extent - more products
low K: little conversion of products → reactions low extent - more reactants
Do catalysts have effect on extent?
catalysts have no effect on the extent, they only alter the rate of reactions. Equilibrium position is not changed.
How can equilibrium reactions be represented graphically?
rate V time graphs
concentration V time graphs
what is Le Chatlier’s principle?
the position of equilibrium shifts to counteract the change 3
Describe what occurs in a rate V time graph through the example below:
A(g) ← → B(g) + 2C(g)
Rates of reaction depends on concentration. As A is being used up → concentration drops, therefore rate of reaction drops
As concentration B and C increase → the rate of reaction increases until it reaches equilibrium
what are concentration V time graphs?
graphs with concentration in mols per litre on the y axis and time as the x axis and highlights how different substances have different gradients due to different molar ratios between them
How are adding/subtracting components in a concentration v time graph displayed?
the change is sudden in one of the substances
If there’s an increase in concentration in either the reactant or product, the component being increased will gradually decrease while the other part of the reaction will gradually increase until both sides reach equilibrium → making up for the gained concentration
If there’s an decrease in concentration in either the reactant or product, the component being decreased will gradually increase while the other part of the reaction will gradually decrease until both sides reach equilibrium → making up for the lost concentration
How are temperature changes displayed on concentration v time graph displayed?
the change is a gradual decrease or increase in all substances
treat heat as either a reactant (for endothermic reactions) or a product (for exothermic reactions)
In an endothermic reactions, the heat is a reactant, so if you increase the temperature you’re increasing amount of reactant, and therefore the forward reaction is favoured
If the temperature is decreased your decreasing the amount of reactant, and therefore the backwards reaction is favoured
In an exothermic reactions, the heat is a product, so if you increase the temperature you’re increasing the amount of product, and therefore the backward reaction is favoured
If the temperature is decreased your decreasing the amount of product, and therefore the forward reaction is favoured
what is the relation between K value and temperature?
only factor that affects the k constant
if the reaction is exothermic then the K value decreases as temperature increases
if the reaction is endothermic then the K value increases as temperature decreases
How are volume and pressure changes displayed on concentration v time graph displayed?
if there’s a decrease in volume (increase in pressure) then all components will increase and shift to the side with fewer gaseous moles
if there’s an increase in volume (decrease in pressure) then all components will decrease and shift to the side with more gaseous moles
what is the reaction quotient?
can be calculated at any stage during a reaction
when at equilibrium the reaction quotient is equal to the equilibrium constant
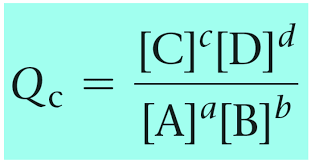
what is the equilibrium constant, K?
concentrations of the ports divided by the reactants at equilibrium → can only be calculated at equilibrium → fixed temperature
can only be affected by temperature
what are the units of K dependent on?
if you double the coefficients, you square K
if you reverse/flip the reaction then K is the reciprocal
if an equation is halved, you will square root it
when is Q and K used?
Q is used when not at equilibrium
K is used when at equilibrium
if Q<K then there is excess in the reactants and a forward reaction is favoured
if Q>K then there is excess in the products and a backward reaction is favoured
Is equilibrium maintained in a closed system or an open system?
equilibrium can only be maintained in a closed system
what occurs in an open system?
Generally, a gas product is present gas in the open system with the system trying to replace the lost gas by shifting towards the product side, therefore only R → P - non-reversible
what must experimenters consider when producing equilibrium products?
producing at an acceptable rate to meet market demands
ensuring that you maximise yield by using Le Chatliers principle
How do you calculate the initial/final concentrations?
though the “ICE” table
n - mole ratio
I - initial concentration
C - change → consumed = - produced = +
E - concentration at equilibrium