Research Methods Midterm 2
1/64
There's no tags or description
Looks like no tags are added yet.
Name | Mastery | Learn | Test | Matching | Spaced | Call with Kai |
|---|
No analytics yet
Send a link to your students to track their progress
65 Terms
sample
set of individuals selected to participate in a study from a larger population
population
entire set of individuals of interest to a researcher
individuals who actually complete a survey affects how well the results generalize to overall population
non-response bias
when a researcher sends out a survey to a sample, but the individuals who complete the survey are not representative of the entire group who was sent the survey
convergent validity
the extent to which your measure correlates with “other” measure
criterion-related validity and concurrent validity are similar to this
have each participant do both your measure, and “other” measure
calculate correlation between scores on your measure and scores on the “other” measure
convergent validity example
Feria’s Love Scale should be highly correlated with extraversion as reported by the person’s spouse
must be a high positive correlation
discernment validity
aka divergent validity
measure should distinguish between the construct being measured and other unrelated constructs
discriminant validity examples
a measure of extraversion should have no correlation with a measure of intelligence
have each measure
calculate correlation between scores on your measure and scores on the “other” measure
a measure of helpfulness should have no correlation with a measure of healthy eating
correlation needs to be near zero
advantages of surveys
measuring attitudes, values, beliefs
ask about past behavior/life history
can provide large amounts of data
disadvantages of surveys
data are affected by participant’s memory, knowledge, etc.
social desirability bias
may misunderstand questions
may not take survey seriously
What is wrong with this survey question:
“Did your mother, father, full-blooded sisters, full-blooded brothers, daughters, or sons ever have a heart attack or myocardial infarction?”
too many relatives listed
may not know what myocardial infarction is
2 diagnoses
simplicity
avoid technical terms
if necessary define prior to asking question
Proposition J says…
Do you approve of Proposition J?
double-barreled question
a question that asks 2 things at the same time
examples of a double-barreled questions
Do you find using a cell phone to be convenient and time-saving?
Should people be allowed to use their cell phones at the airport but not on the plane?
how to solve asking a double-barreled question?
use 2 separate questions
leading question
a question that is written to lead people to respond in one way
may use emotional or non-neutral terms
examples of leading questions
Most people believe that conserving energy is important. What do you think?
Do you believe radical extremists should be allowed to burn the American flag?
Do you favor eliminating the wasteful excess in the public school budget?
negative wording
avoid having negatives like “no” and “not in the question
example of negative wording
Do you feel that the city should not approve the proposed women’s shelter?
response set
the tendency to consistently respond in a certain way
use only 2 extreme points of scale, only the midpoint, etc.
yea-saying and nay-saying
respondent may have a response set to agree or disagree with all items
how to solve yea-saying and nay-saying?
word questions so that agreement means different things
the members of my family spend a lot of time together
I spend most of my weekends with friends
My mood is generally positive.
I am often sad.
close-ended questions
choose from a limited number of response alternatives
advantage of close-ended questions
easy to analyze
disadvantage of close-ended questions
must have a good understanding of what responses are likely to be
open-ended question
free to answer any way they like
advantage of open-ended questions
greater variety - can produce new insights
disadvantage of open-ended questions
difficult to analyze statistically (must code somehow)
different results from close-ended/open-ended questions - Schwarz (1999)
when closed-ended questions with “to think for themselves” as an option, 62% chose it
but when open-ended, only 5% said that
rating scale
choose a numerical value on a predetermined scale
rating scale example
students at SJSU should be required to pass a comprehensive exam in order to graduate
strongly agree 1 2 3 4 5 6 7 strongly disagree
sequence of questions
most interesting and important questions first
sensitive topics later (ex: drug use, sexual behavior)
demographic questions last (ex: age, gender)
group questions by theme
number of alternatives
scales between 4 and 7 options have best reliability (Lozano et al., 2008)
odd number => neutral option
even number => force to lean in one direction
descriptive research question
a research question that asks about the presence of behavior, how frequently it is exhibited, or whether there is a relationship between different behaviors
predictive research question
a research question that asks if one behavior can be predicted from another behavior to allow predictions of future behavior
causal research question
a research question that asks what causes specific behaviors to occur
attrition
or mortality
occurs when participants choose not to complete study
testing effects
occur when participants are tested more than once in a study, with early testing affecting later testing
split-half reliability
method of testing scores’ internal consistency that indicates if the scores are similar on different sets of questions on a survey that address similar topics
Cronbach’s alpha
method of testing scores’ internal consistency that indicates the average correlation between scores on all pairs of items on a survey
correlational study
a type of research design that examines the relationships between multiple dependent variables, without manipulating any of the variable
Pearson r statistic/test
a significance test used to determine whether a linear relationship exists between two variables measured on interval or ratio scales
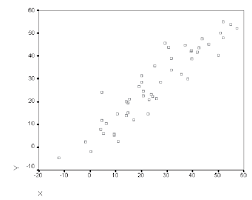
scatterplot
a graph showing the relationship between two dependent variables for a group of individuals
positive correlation
as one variable increases, the other variable tends to increase
stress and blood pressure
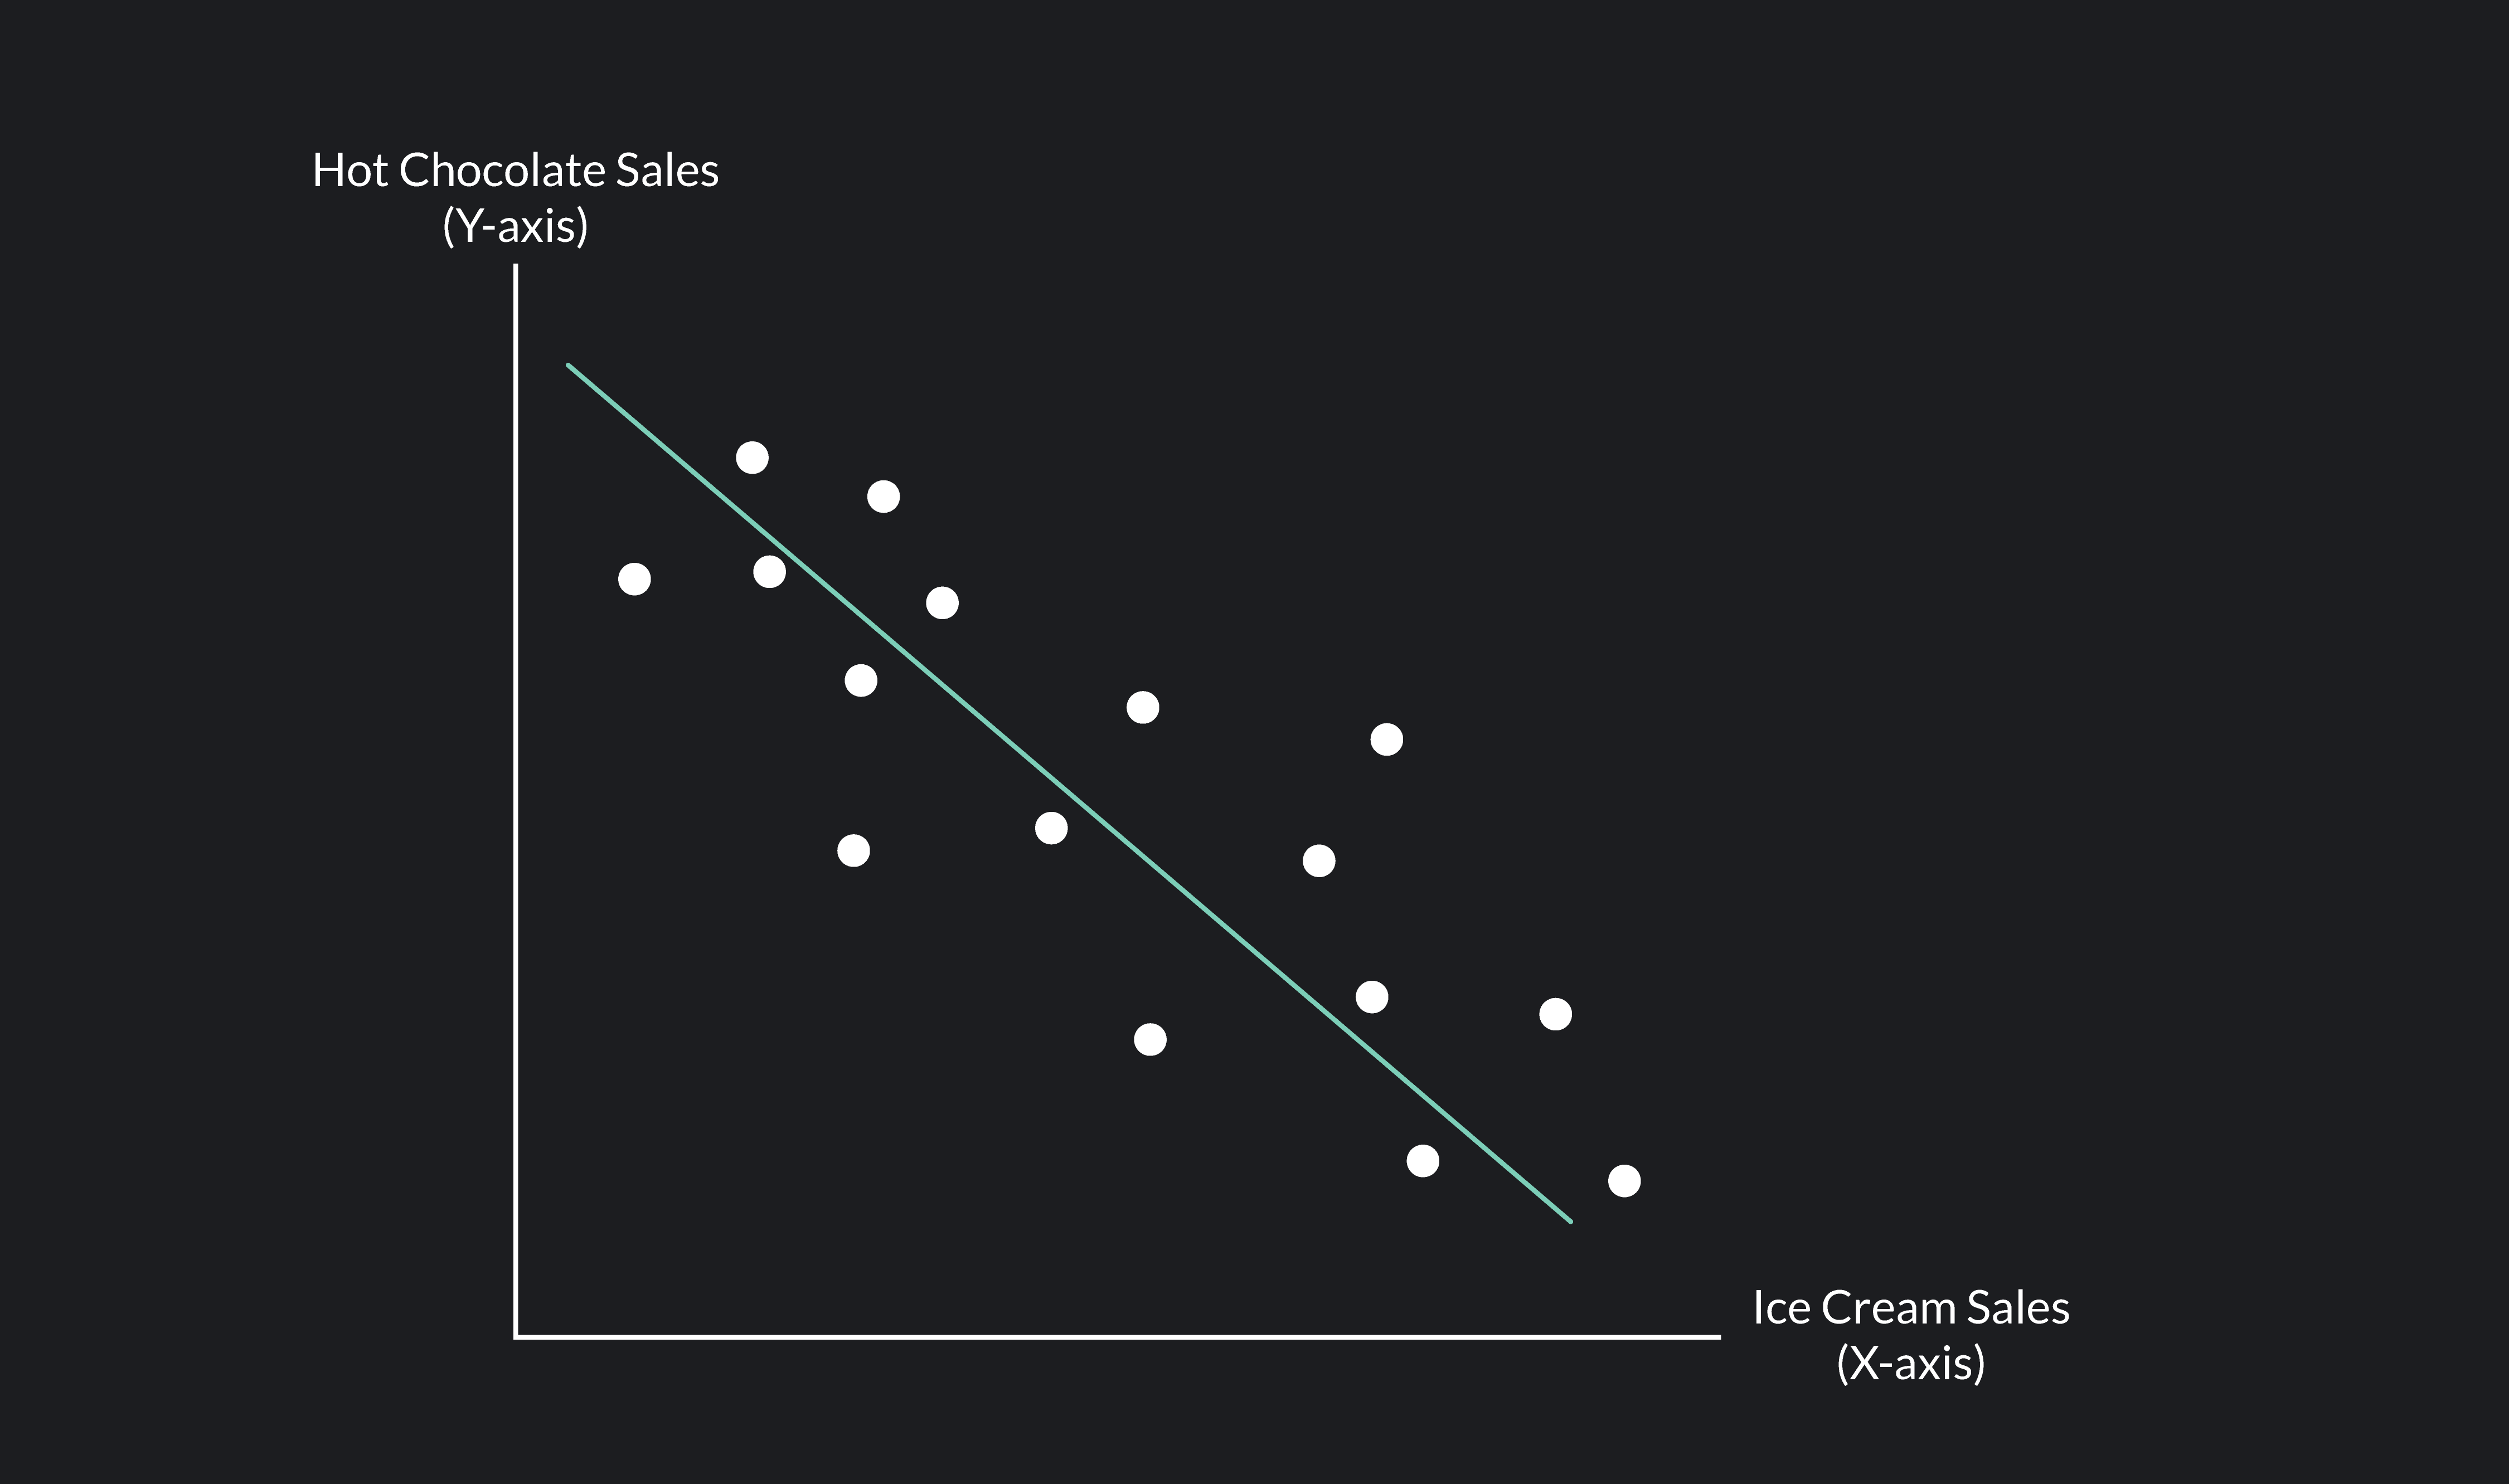
negative correlation
as one variable increases the other variable tends to decrease
screen time and exercise
correlational design
research that allows us to determine if there is a relationship among variables
Griffore et al. (1990) :
self-esteem is positively related to family income, locus of control, and ratings of partner attractiveness and self-attractiveness
raw data vs. proportions example
how many cars are at each speed?
25 accidents at 40mph 2,500 cars 1/100
50 accidents at 60mph 50,000 cars 1/1000
use proportions: number of accidents at each speed / number of cars at each speed
correlation and causation
“Correlation does not imply causation!”
correlation tells us that variables are related, but not why they are related
cause-and-effect conclusions can only be drawn if a variable is manipulated/controlled by researcher (an experimental design)
correlation =/ causation example
significant positive correlation between self-esteem and reading ability
can we conclude:
“high self-esteem causes better reading.”
self-esteem → reading ability
NNOOOO!!!
directionality problem
maybe the causality is the reserve of what we think
directionality problem example
“Good reading ability causes higher self-esteem.”
reading ability → self-esteem
third variable problem
when a third variable accounts for the relationship you found between two variables
third variable problem example
“Parental praise causes better reading ability and higher self-esteem.”
parental praise → self-esteem
parental praise → reading ability
restriction of range
if a correlation is computed from scores that do not represent the full range of possible values → can make relationship look different than it really is
restriction of range example
IQ and creativity
sample of SJSU students: most have IQ between 110 and 130
you conclude no relationship between IQ and creativity, when really there is
nonlinear relationship
Pearson correlation coefficient ® indicates strength of the linear relationship between two variables
positive and negative trends cancel out → about zero correlation
based on correlation coefficient → conclude no relationship
but this is wrong
outlier
an extreme score; a score that is substantially larger or smaller than the other values in the data set
a single outlier can dramatically affect the correlation
large sample (outliers)
one or two outliers usually won’t greatly affect
small sample (outliers)
outlier can have big effect
comparing sample means
mean of each condition is an estimate of population mean
sample means contain random variation
null hypothesis (t-test)
the population mean of the model group is equal to the population mean of the no-model group
alternative hypothesis (t-test)
the population mean of the model group is not equal to the population mean of the no-model group
t-test
begin with assumption that there is no difference (null hypothesis)
if we find p<.05, that means that there is a less than 5% chance of getting the observed results if the null hypothesis is true
statistically significant
null hypothesis (test of correlation)
there is no correlation in the population
the population correlation is zero
alternative hypothesis (test of correlation)
there is a real correlation in the population
the population correlation is non-zero
test of correlation
usually even if the population truly has no correlation, r will be nonzero in our sample
particularly for small samples
begin with assumption that there is no correlation (null hypothesis)
if we find p < .05, that means that there is a less than 5% chance of getting the observed results if the null hypothesis is true