Looks like no one added any tags here yet for you.
Start with:
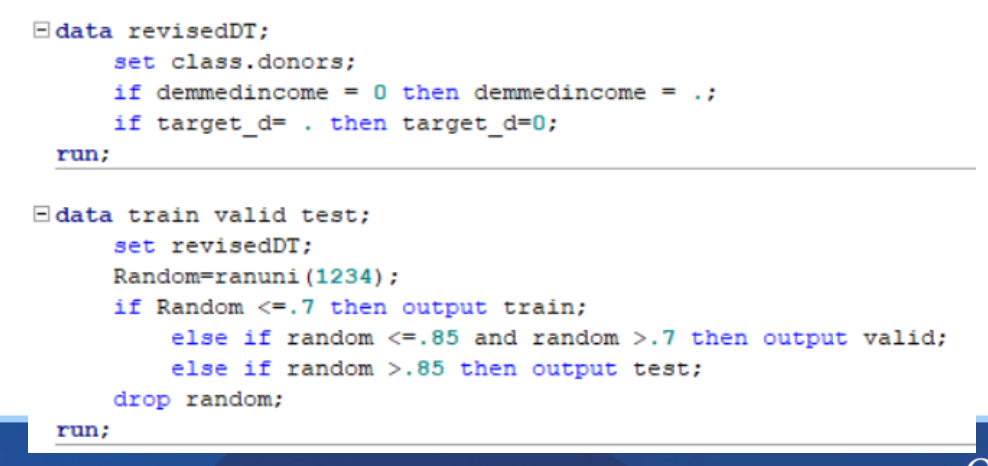
Data setup
trees can handle missing values
note: trees dont have assumptions
With decision tree building we start with:
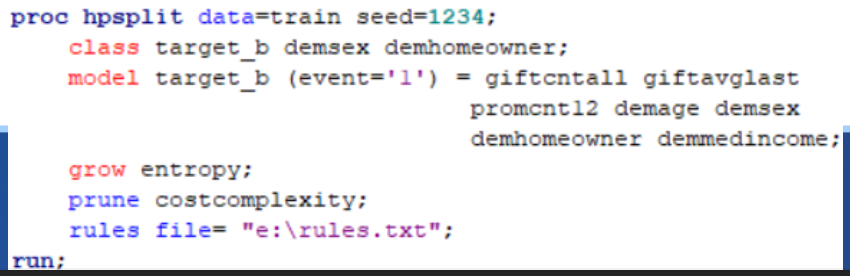
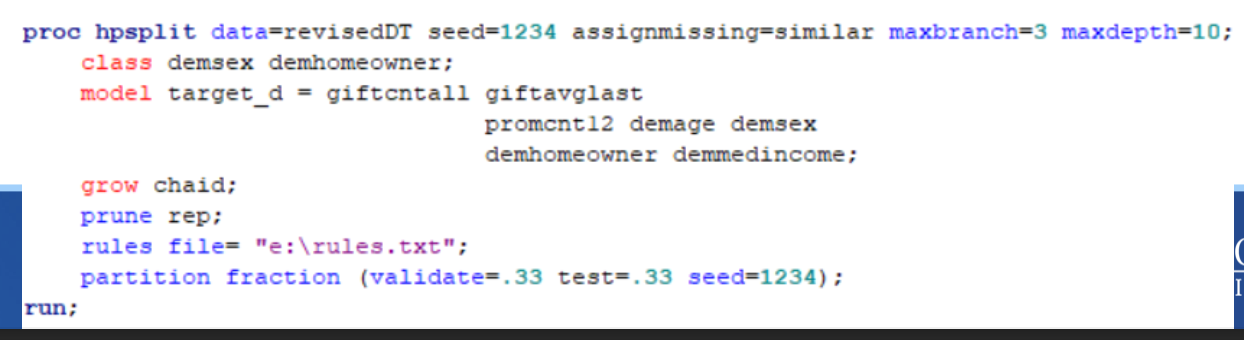
Proc hpsplit
Proc hpsplit
Seed to make sure it is not random
Class- specify classification variables
– Include DV this time!
• Because DT can handle interval DVs
Model statement like before (order matters but doesn’t)
– It will build differently based on order inputted, but we are looking for decisions not answers!!!
Grow- default method is entropy
Prune- default method is costcomplexity
– Balance of error rate and simplicity
Rules file- details of the tree
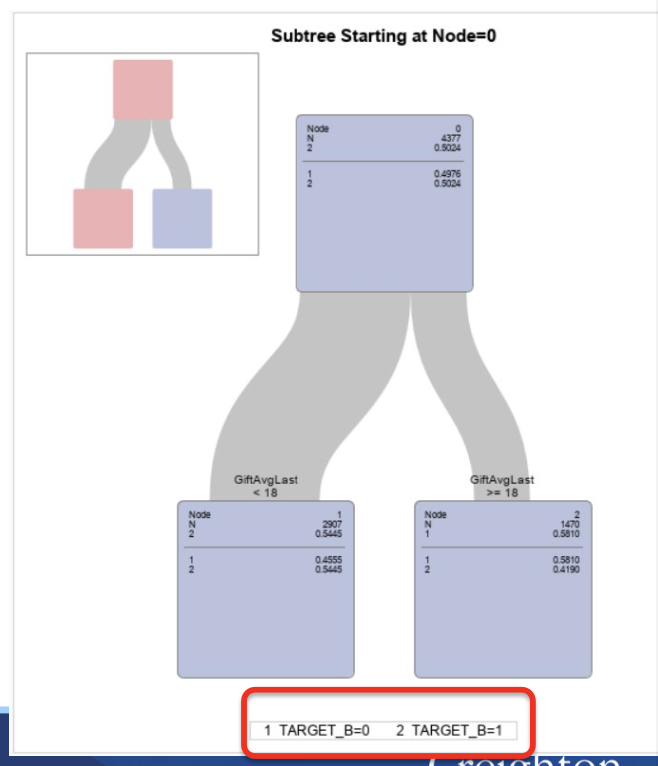
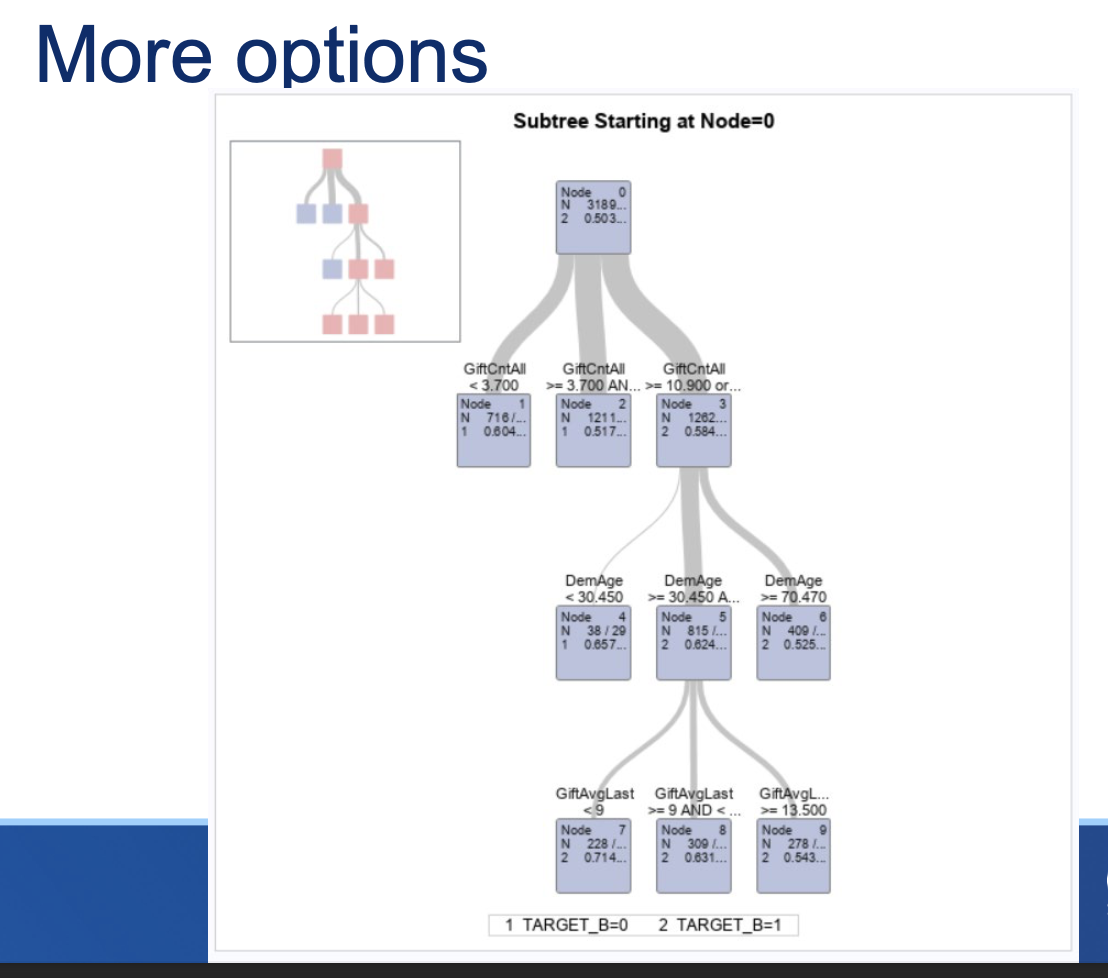
Looking at the tree….
NodeistheNodeID number
Nrepresentsthenumber of observations in that node
2representsthe classification and the % of the variable most common in that node
Belowthelineisthe breakdown of all classifications
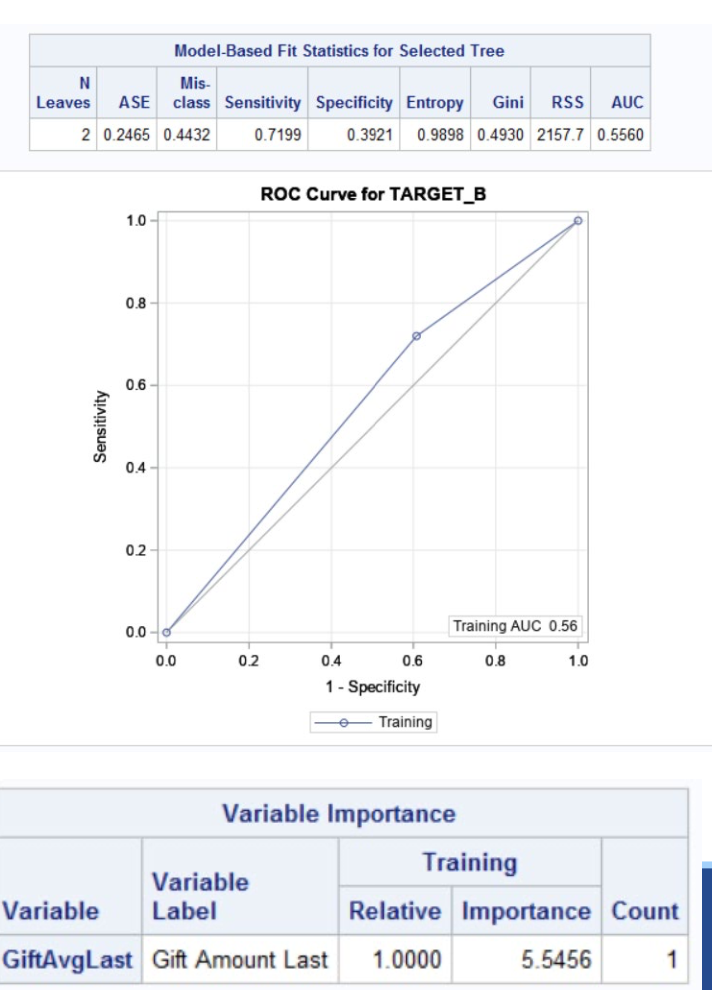
Fit
Confusion Matrix to calculate fit
ROC Curve, just like before
Variable importance shows the importance of each variable in the tree
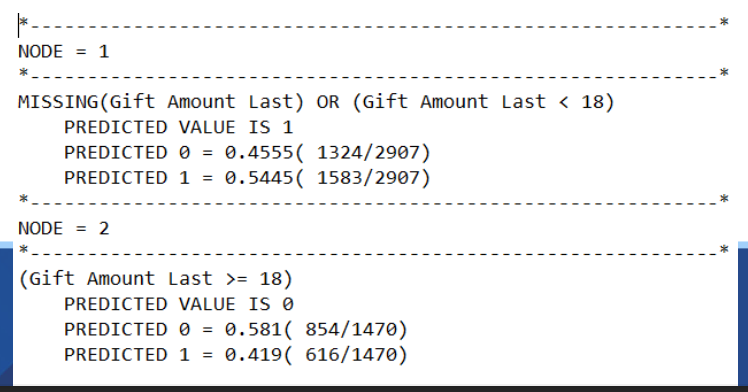
Rules of the leaves
(Only shows the leaf nodes)
If the last gift amount is missing or less than $18, they are predicted to give
If the last gift amount is $18 or more, they are predicted to not give this time.
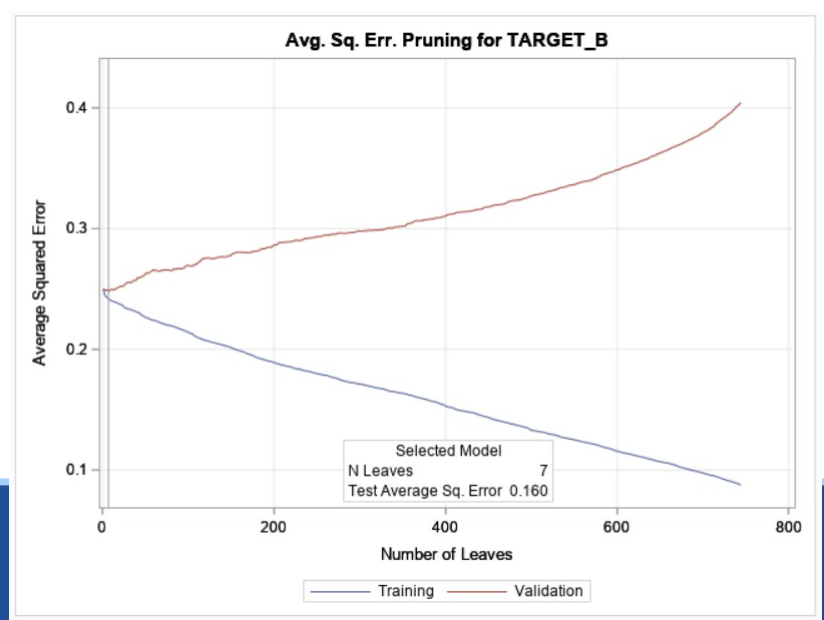
Subtrees (Pruning)
• Selecting an earlier iteration of a tree to avoid overfitting
• Removing branches that have few observations
– Leaf size, Maximum Depth, Method properties
• Test other trees
– Select a different maximum depth
– Change the maximum number of branches
More options → Which are endless!!!!
assignmissing=
Maxbranch=
Maxdepth=
Grow
Prune
Partition
Score
Assignmissing=
-Branch- create a separate branch for missing
– None- remove from analysis (default)
– Popular- assign to the largest child
– Similar- statistically determine the most similar
Maxbranch=
Maximum number of leaves per node
Maxdepth=
Maximum levels of the tree
grow
Chaid- uses a chi square estimate
Prune
Rep- reduced error pruning
Partition
– Build the data for you!
Score
Creates a score data set just like regression
More options include examples like:
How do you determine the best tree?
through using the Subtree assessment plot → where we look for divergence
What does the score data set do?
Allows us to evaluate the model
What are the consequences of a decision tree?
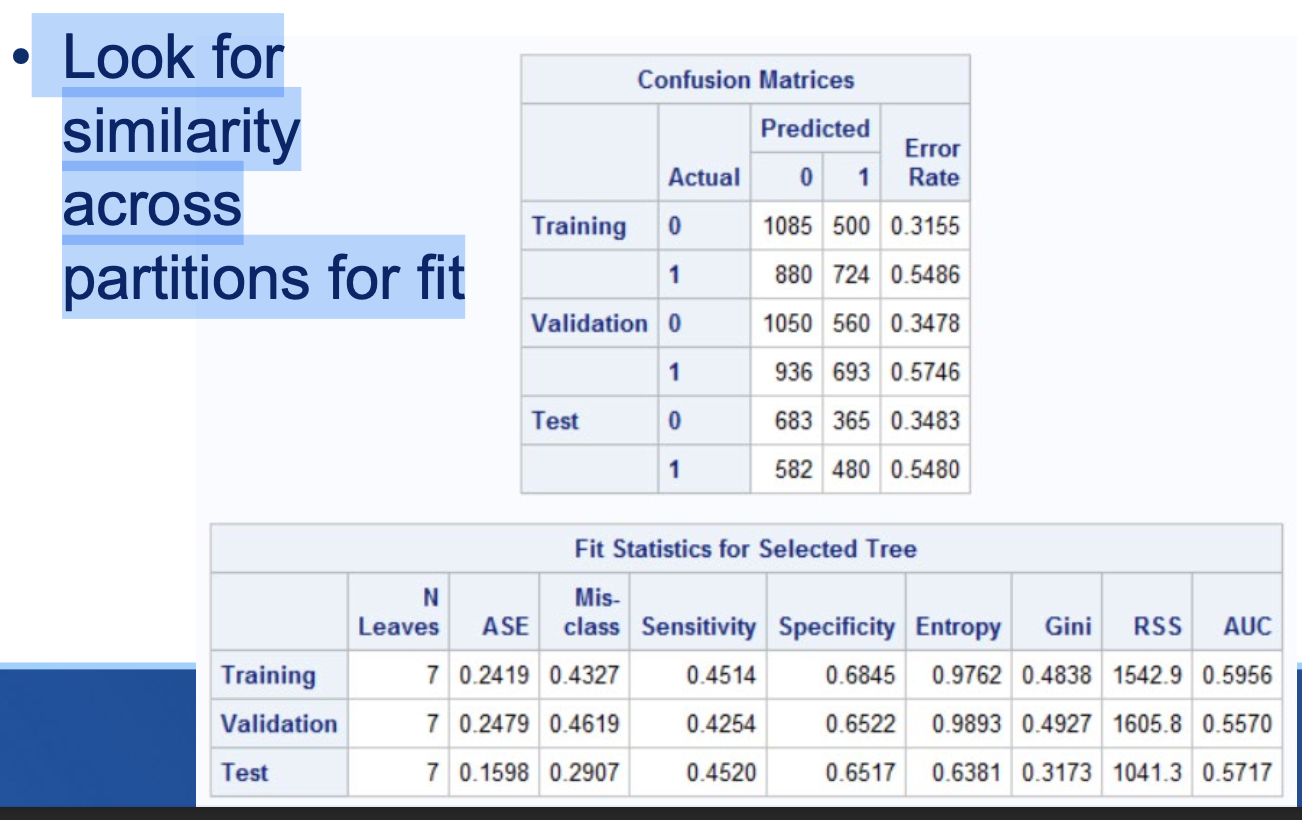
Look to the confusion matrix! → Look for similarity across partitions for fit
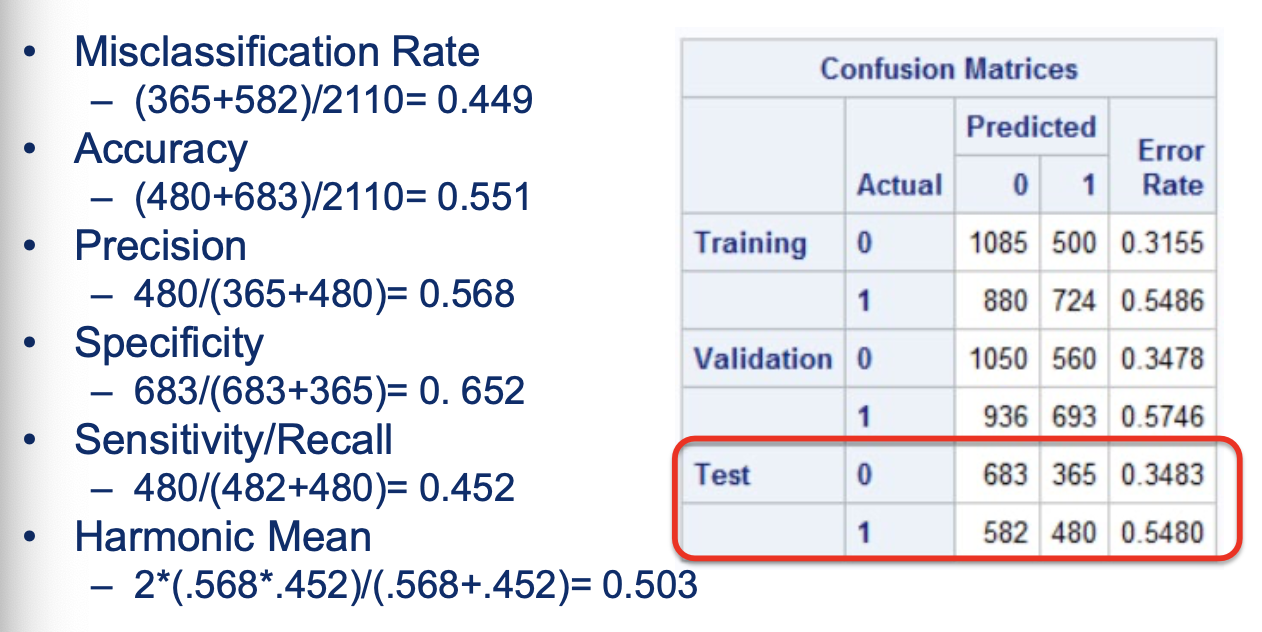
we can look deeper into the
Confusion matrix and calculate:
misclassification rate
accuracy
Precision
specificity
sensitivity/ recall
harmonic mean
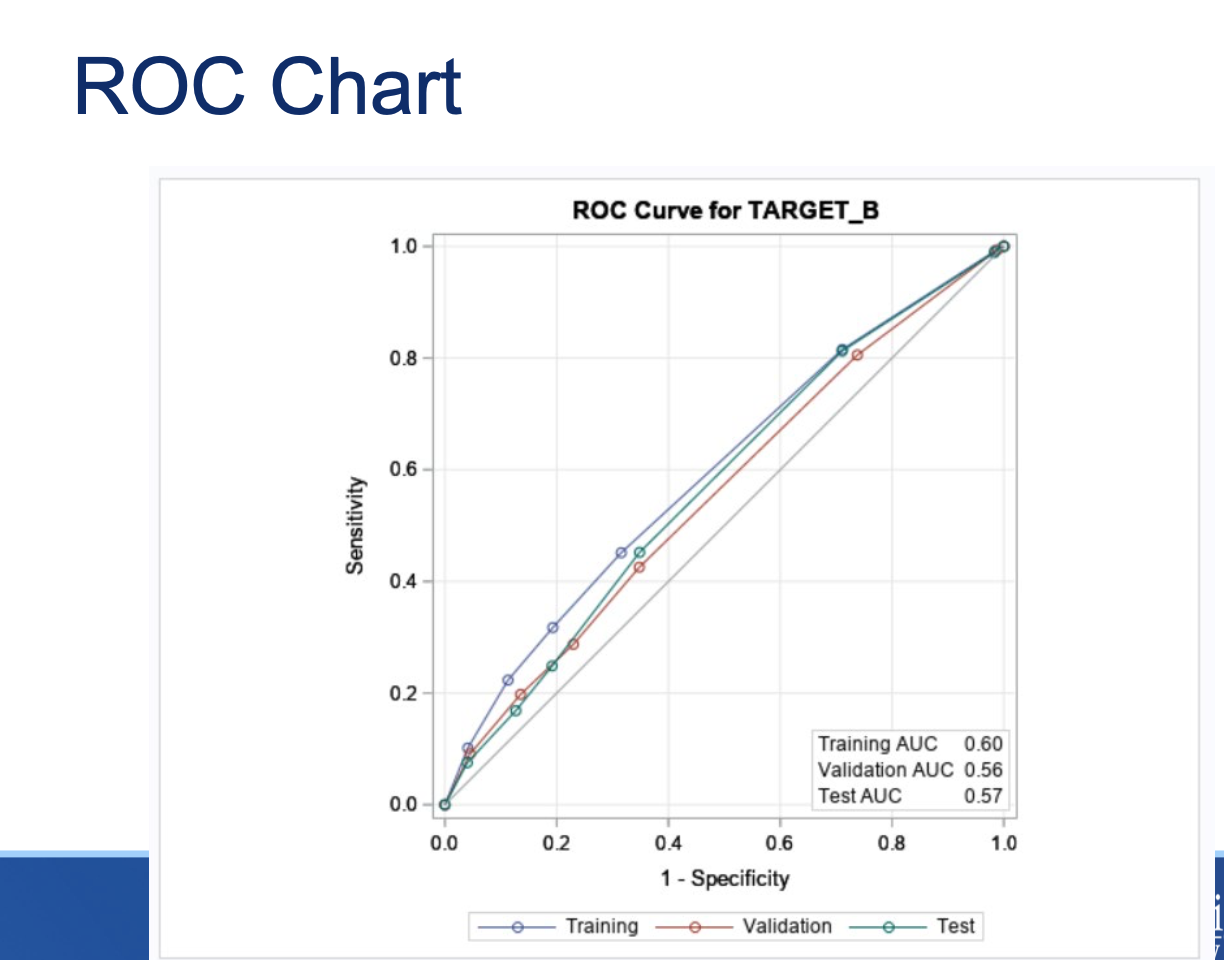
We also can look at the ROC chart to
assess the overall fit of the model
Potential improvements: Business understanding
Reevaluate the business question, evaluate the appropriateness of the DV
Potential improvements: Data understanding
Consider missingness, data inclusion criteria
Potential Improvements: Data Prep
Consider outliers, transformations, record selection, modeling assumptions
Potential Improvements:
Evaluate feature selection, significance, parsimony
Potential Improvements: Evaluation
Evaluate significance, generalizability (data partitioning), explainability, if it is actionable
Potential Improvements: Deployment
Make the model more actionable
How can we build a better tree?
change the data prep and change the model
How do we change the data prep?
Missing & Outliers
How do we change the model?
Feature Inclusion
– Branches
– Depth
– Grow method
– Pruning method
What should we consider with data mining?
Remember,thegoalofdataminingistofind unexpected patterns
Ifthetreedoesnottellyousomethingyoudon’t know, it is not very insightful
– Can be helpful if trying to prove your argument or gain confidence
Ifthetreeisoverfit,itmightnotbethathelpful
– Not generalizable
– Think about baseball pitches!
What about continuous dependent variables?
DTs are easier to interpret when used for classification
BUT they can be used with a continuous DV
Creates a predicted value instead of classification