Engineering Data Analysis (Midterms Exam)
1/40
There's no tags or description
Looks like no tags are added yet.
Name | Mastery | Learn | Test | Matching | Spaced |
|---|
No study sessions yet.
41 Terms
Science of collecting, organizing, summarizing, and analyzing information to draw conclusions or answer questions.
Statistics
Refers to a collection of facts, observations, or measurements. It is the information referred to the definition of Statistics.
Data
The set of all entities under study.
Universe
The set of all possible values of the variable.
Population
A person or object that is a member of the population being studied.
Individual
Subset of the universe or the population.
Sample
A numerical summary of a population.
Parameter
A numerical value that describes a sample or a number computed from the sample data.
Statistic
The characteristics that differentiate every individual within the population sample.
Variables
(PROCESS OF STATISTICS)
Define the “what” and the “why” of your study. Before you collect any data, you have a clear and specific question you want to answer.
Identify the “population” or the group to be studied.
Identify the research objective
(PROCESS OF STATISTICS)
This step is about the “how” and the “from whom.”
Gaining access to an entire population is often difficult and expensive. In conducting research, we typically look at a subset of the population called a “sample”
Collect the information needed to answer the questions
(PROCESS OF STATISTICS)
referred to as “descriptive statistics”.
Descriptive statistics describe the information collected through numerical measurements, charts, graphs, and tables.
The goal is to get a clear picture of the data's characteristics without making assumptions about the larger population.
Organize and summarize the information
(PROCESS OF STATISTICS)
Final step
also known as interpreting the results or “inferential statistics”.
Draw conclusions from the information.
Variable that has either a finite number of possible values or a countable number of possible values. The term countable means that the values result from counting, such as 0, 1, 2, 3, and so on.
Discrete variables
Variable that has an infinite number of possible values that are not countable.
Continuous variables
(LEVELS OF MEASUREMENT)
Identify, name, classify, or categorize objects or events.
Example: Method of payment (cash, check, debit card, credit card), Type of school (public vs. private), Eye Color (Blue, Green, Brown)
Nominal Level
(LEVELS OF MEASUREMENT)
Like nominal scales, identify, name, classify, or categorize, objects or events but have an additional property of a logical or natural order to the categories or values.
Example: Food preferences, Rank on a Military officer, Social Economic Class (First, Middle, Lower)
Ordinal Level
(LEVELS OF MEASUREMENT)
Identify, have ordered values, and have the additional property of equal distances or intervals between scales.
Example: Temperature in Celsius or Fahrenheit, dates on a calendar, and IQ scores.
Interval Level -
(LEVELS OF MEASUREMENT)
Possesses all the properties of the other levels. It identifies, order, represent equal distances between scores values, and have an absolute zero point.
Example: Height, weight, time, and income
Ratio
The process of gathering and measuring information on variables of interest, is an established systematic fashion that enables one to answer stated research questions, test hypotheses, and evaluate outcomes.
Data Collection
(STEPS OF DATA GATHERING)
Step 1
Set the objectives for collecting data.
(STEPS OF DATA GATHERING)
Step 2
Determine the data needed based on the set objectives.
(STEPS OF DATA GATHERING)
Step 3
Determine the method to be used in data gathering and define the comprehensive data collection points.
(STEPS OF DATA GATHERING)
Step 4
Design data gathering forms to be used.
(STEPS OF DATA GATHERING)
Step 5
Collect Data
These provide first-hand account of an event or time period and are considered to be authoritative.
They represent original thinking, reports on discoveries or events, or they can share new information. Often these sources are created at the time the events occurred but they can also include sources that are created later.
Primary Sources
They offer an analysis, interpretation or a restatement of primary sources and are considered to be persuasive.
They often involve generalization, synthesis, interpretation, commentary or evaluation in an attempt to convince the reader of the creator's argument.
Examples: Published report on newspaper and periodicals, Financial Data reported in annual reports, Records maintained by the institution, Internal reports of the government departments, Information from official publications
Secondary Sources
(PRIMARY SOURCES)
The researcher has direct contact with the interviewee. The researcher gathers information by asking questions to the interviewee.
Direct personal interviews
(PRIMARY SOURCES)
These methods of data collection involve sourcing and accessing existing data that were originally collected for the purpose of the study.
Indirect/Questionnaire Method
(PRIMARY SOURCES)
A group interview of approximately six to twelve people who share similar characteristics or common interests. A facilitator guides the group based on a predetermined set of topics.
Focus group
(PRIMARY SOURCES)
A method of collecting data where there is direct human intervention on the conditions that may affect the values of the variable of interest.
Experiment
(PRIMARY SOURCES)
A method of collecting data on the phenomenon of interest by recording the observations made about the phenomenon as it actually happens.
Observation

An integrated development environment (IDE) for the R programming language used for data analysis, visualization, and statistical computing.
RStudio
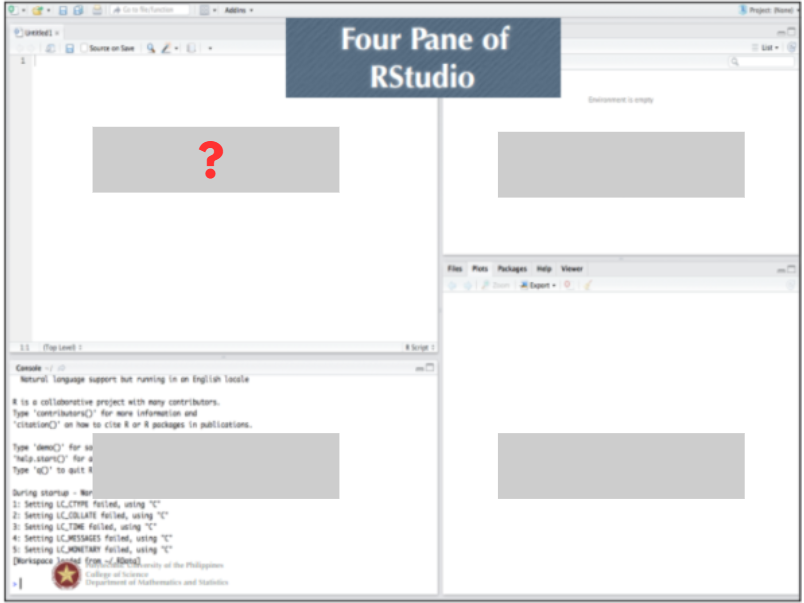
(RStudio)
This is used for writing, editing, and saving R scripts or codes before execution.
R Script or Source Pane
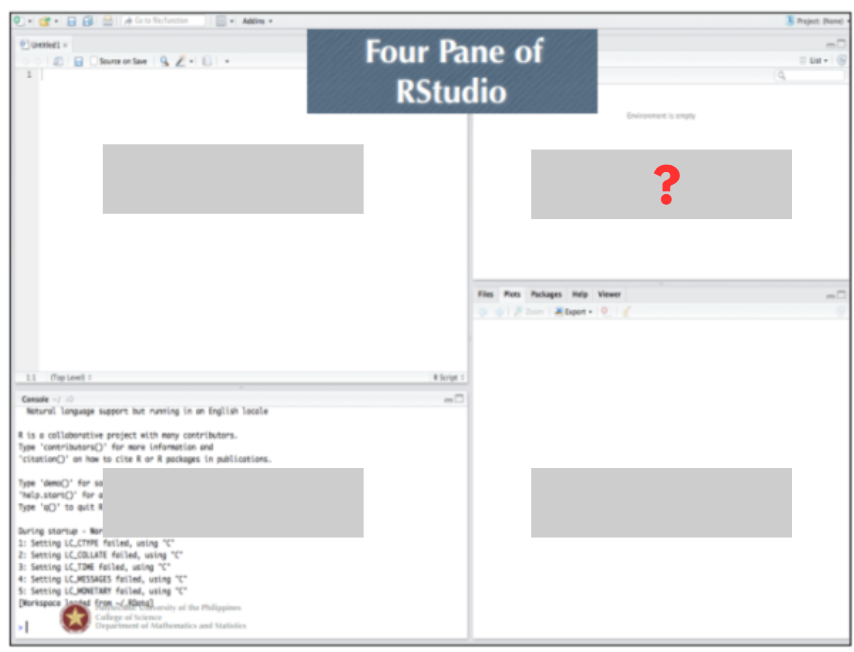
(RStudio)
This displays all the variables, datasets, and functions currently loaded into the workspace, as well as a history of executed commands.
Environment and History Pane
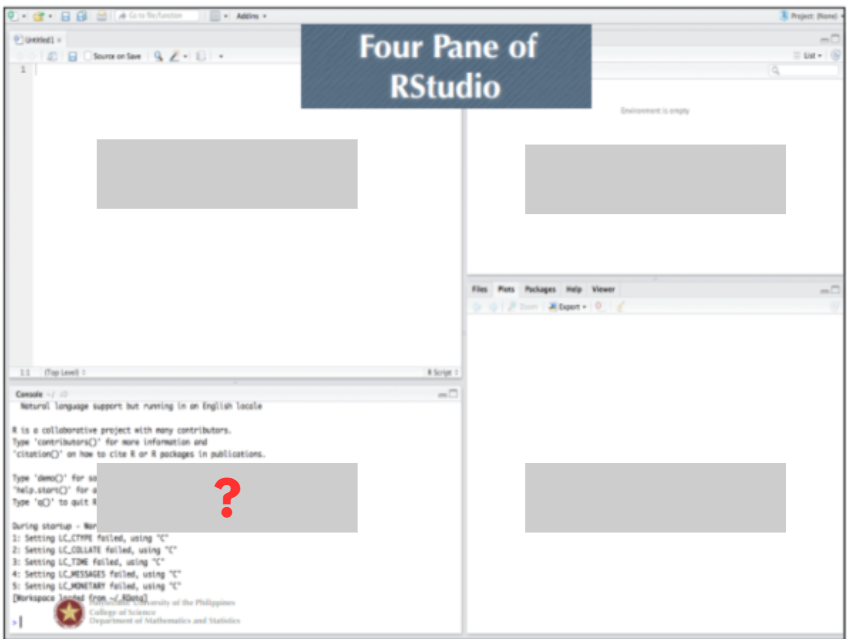
(RStudio)
This is where R commands are directly typed and executed immediately, showing instant output and error messages.
Console Pane
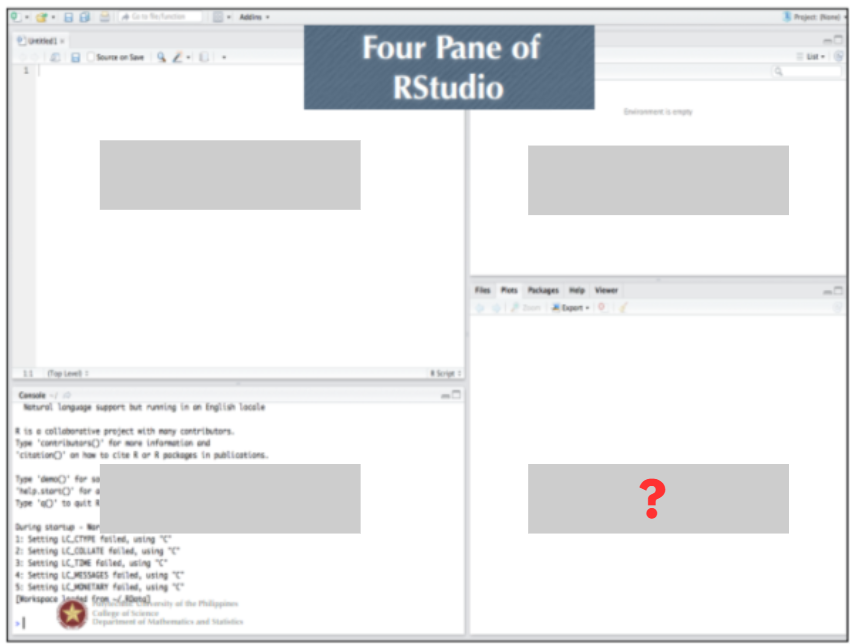
(RStudio)
This is used to display plots, help files, files in the working directory, and installed packages.
Final Pane
RStudio vector that stores numbers, either integers or decimals, used for calculations.
Numeric Vector
RStudio vector that stores text or string values inside quotation marks.
Character Vector
RStudio vector that stores TRUE or FALSE values, used for conditions or logical testing.
Logical Vector
RStudio categorical vector that stores labels (like text categories) as levels internally encoded as numbers. Used for grouping or statistical analysis.
Factor Vector