Unit 8 - Aquatic and Terrestrial Pollution
1/47
Earn XP
Description and Tags
ap enviro
Name | Mastery | Learn | Test | Matching | Spaced | Call with Kai |
|---|
No analytics yet
Send a link to your students to track their progress
48 Terms
IDENTIFY examples of point and nonpoint source pollution
Point source: Factory discharge pipe
Non-point source: Agricultural runoff
Hypoxia
Hypoxia is a condition where dissolved oxygen in water is too low to support most aquatic life.
OUTLINE the relationship between dissolved oxygen and water temperature
As water temperature increases, dissolved oxygen levels decrease.
OUTLINE one way that agriculture contributes to the dead zone in the Gulf of America
Agricultural runoff carries excess nitrogen and phosphorus, leading to algal blooms and hypoxia.
OUTLINE one way that urban centers contribute to the dead zone in the Gulf of Mexico
Urban stormwater runoff delivers pollutants and nutrients into waterways, fueling algal growth.
OUTLINE one economic impact of the dead zone in the Gulf of Mexico
It reduces fish and shellfish populations
OUTLINE why the dead zone in the Gulf of Mexico is seasonal
More rainfall and runoff in spring/summer plus warmer temperatures lead to algal blooms and oxygen depletion.
IDENTIFY the location of point source pollution from an oxygen sag curve
It is located just downstream of the pollution discharge point, where oxygen levels start to drop.
DESCRIBE the pollutants released from coal combustion and how we can remove from the waste stream
Coal combustion releases sulfur dioxide, nitrogen oxides, and mercury. Scrubbers and filters can remove these pollutants.
DESCRIBE a heavy metal (other than mercury) that negatively affects humans, its route of exposure and its effects
Lead can enter through drinking water or old paint and causes neurological damage.
OUTLINE the most common route that Mercury finds its way into humans
Through consumption of fish that have bioaccumulated methylmercury.
IDENTIFY common effects of endocrine disruptors
Reproductive issues, developmental problems, birth defects, and hormone imbalance.
OUTLINE how PCB’s enter human beings and its effect
PCBs enter through contaminated food (especially fish) and can affect the immune, nervous, and reproductive systems.
IDENTIFY the trophic level most affected by persistent toxic chemicals
Top-level predators
IDENTIFY an ecosystem service of mangroves
Mangroves protect coastlines from erosion and storm damage.
STATE why mangroves are being removed by humans
For coastal development, tourism, and aquaculture (like shrimp farming).
OUTLINE the cause(s) of eutrophication
Excess nutrients (nitrogen and phosphorus) from agriculture and wastewater.
OUTLINE how fish are negatively impacted by eutrophication
Oxygen levels drop, causing suffocation and mass fish kills.
OUTLINE strategies to mitigate eutrophication
Use less fertilizer, improve wastewater treatment, plant buffer zones, and reduce runoff.
EXPLAIN cultural eutrophication
Cultural eutrophication is nutrient pollution from human activity that causes excessive algal growth and oxygen depletion.
COMPARE CERCLA and RCRA
CERCLA cleans up hazardous waste sites; RCRA regulates current waste generation and disposal.
DEFINE bioaccumulation
The buildup of toxins in an organism over time.
DEFINE biomagnification
The increase in toxin concentration as it moves up the food chain.
IDENTIFY the largest component by weight of municipal waste in the U.S.
Paper and cardboard
IDENTIFY the primary method of waste disposal in the U.S.
Landfilling
IDENTIFY a pro and a con of waste incineration, of waste landfilling and composting
Incineration: Pro – Reduces volume; Con – Air pollution
Landfilling: Pro – Cheap; Con – Land use and methane emissions
Composting: Pro – Enriches soil; Con – Limited to organic waste
IDENTIFY the unique dangers to humans that car tire waste presents
Can trap water and breed mosquitoes; if burned, releases toxic pollutants.
DESCRIBE how we might generate electricity from municipal waste
By burning waste to produce steam that turns turbines (waste-to-energy).
DESCRIBE the stages and process of wastewater treatment
Primary – removes solids
Secondary – uses bacteria to break down organic matter
Tertiary – removes nutrients and chemicals
IDENTIFY the different parts of a wastewater treatment facility and their function(s)
Grit chamber: removes sand and gravel
Primary clarifier: removes solids
Aeration tank: breaks down organics
Secondary clarifier: removes bacteria
Disinfection: kills pathogens
DESCRIBE what wastewater treatment facilities can and cannot remove from wastewater
Can remove solids, nutrients, and pathogens; cannot fully remove pharmaceuticals and microplastics.
IDENTIFY one pro and one con of using sewage sludge in agricultural applications
Pro: Adds nutrients to soil
Con: May contain heavy metals or contaminants
IDENTIFY one pro and one con of transporting sewage sludge to landfills
Pro: Safer disposal of contaminants
Con: Expensive and takes up landfill space
IDENTIFY one environmental legislative act that wastewater treatment facilities must obey
Clean Water Act
DRAW a LD50 curve on a logarithmic graph paper when given data
COMPARE toxicity of different chemicals based on their LD50’s
Lower LD50 means higher toxicity
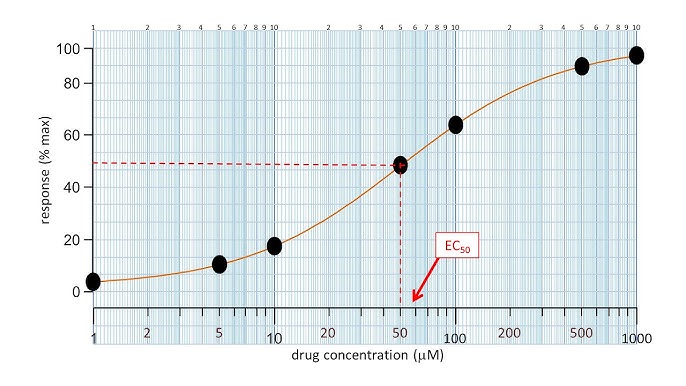
IDENTIFY the correct dose response curve given data
Look for the curve that best fits the trend of dose vs. response in the data
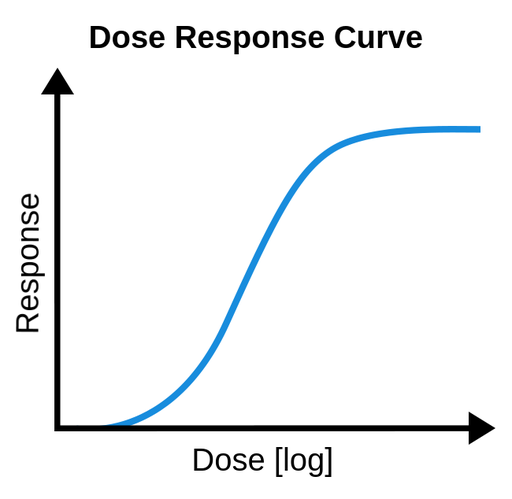
OUTLINE dose response relationships
As dose increases, the effect (response) increases until it plateaus or causes harm
ANALYZE a dose response curve
Ozempic commercial type example type stuff
OUTLINE the “threshold level of toxicity”
The lowest dose at which a response is observed
OUTLINE why kids are more susceptible to toxic pollutants
They eat/drink more per body weight, have developing organs, and behaviors increase exposure
STATE how Tuberculosis is transmitted to people
Through airborne droplets from coughs or sneezes
STATE how West Nile virus is transmitted to people
By mosquito bites
STATE where Malaria is most common and how it is transmitted to people
Most common in Sub-Saharan Africa; transmitted by Anopheles mosquito bites
LIST factors today that are driving emergent diseases
Global travel, climate change, deforestation, and urbanization
ANALYZE an experimental design to determine the investigator’s purpose
Identify the hypothesis, variables, and control group to find what the investigator is testing
CALCULATE a percentage of a given number
(Part ÷ Whole) × 100
CALCULATE percent increase