2.3.2 - short run AS
1/4
There's no tags or description
Looks like no tags are added yet.
Name | Mastery | Learn | Test | Matching | Spaced | Call with Kai |
|---|
No analytics yet
Send a link to your students to track their progress
5 Terms
define SRAS
total output that all firms within an economy are willing and able to produce at different price levels in the short run
show a SRAS on a diagram
upward sloping, like a normal supply curve
just that its on the aggregate axes
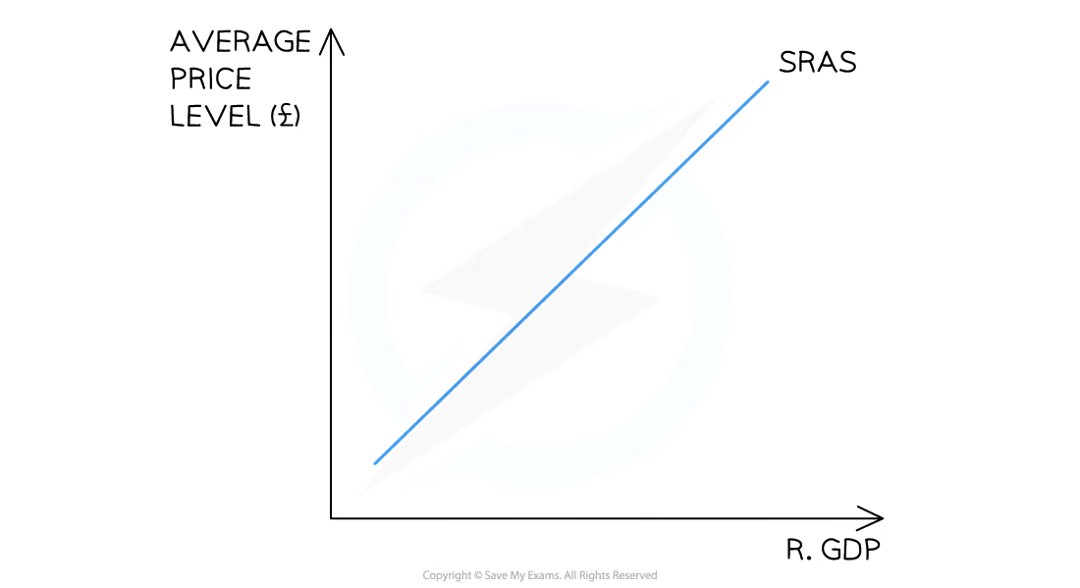
why is the SRAS curve upwards sloping
higher price level = higher real GDP produced
(incentivised to supply more at higher price levels)
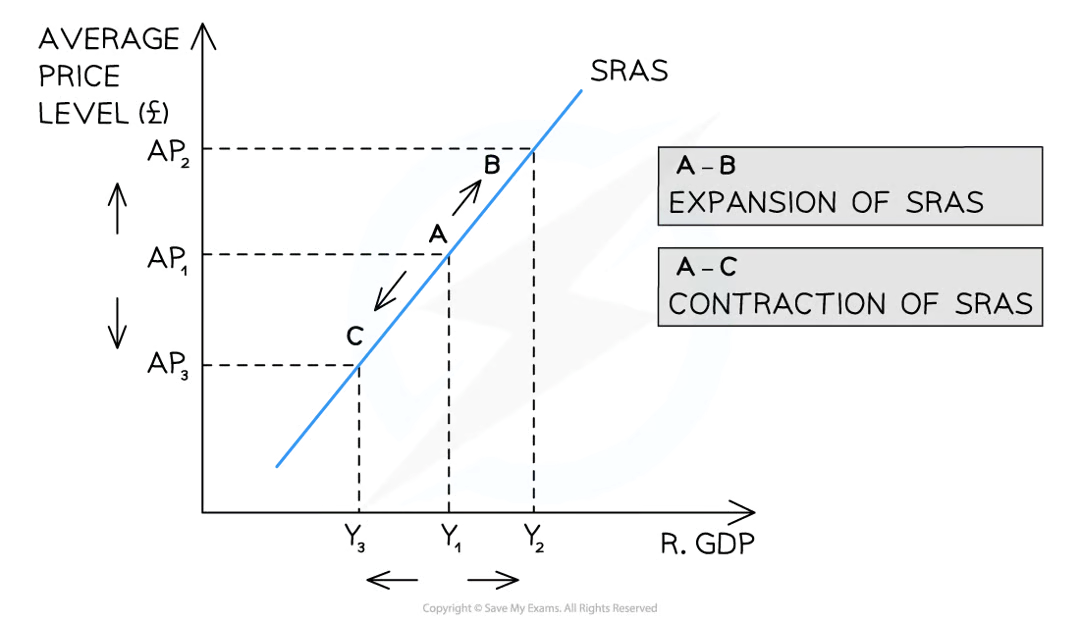
what causes a movement along the SRAS
change in average price level (ceteris paribus)
known as contractions and expansions/extensions
when is there a shift in SRAS
a change in anything that a affects COSTS OF PRODUCTION
eg…
…costs of FoPs
…exchange rates
…tax rates
higher costs of production = shift left