Lvl2: Equity
1/53
There's no tags or description
Looks like no tags are added yet.
Name | Mastery | Learn | Test | Matching | Spaced | Call with Kai |
|---|
No analytics yet
Send a link to your students to track their progress
54 Terms
rational efficient markets formulation
investors will not rationally incur the expenses of gathering information unless they expect to be rewarded by higher gross returns compared with the free alternative of accepting the market price
difference between a valuation estimate and the prevailing market price
true mispricing - true but unobservable intrinsic value V and the observed market price P
error in the estimate of the intrinsic value - valuation estimate and the true but unobservable intrinsic value
valuation process
Understanding the business. Industry and competitive analysis, FS analysis
Forecasting performance
Selecting appropriate model
converting forecasts to valuation
applying conclusions - investment recommendation
sum-of-the-parts valuation
sometimes called the breakup value or private market value
segments in different industries that have different valuation characteristics
DDM is suitable when
dividend-paying
board of directors has established a dividend policy that bears an understandable and consistent relationship to the company’s profitability
investor takes a non-control perspective
FCFE /FCFF model suitable when
not dividend-paying
dividends significantly exceed or fall short of free cash flow to equity
free cash flows align with the company’s profitability
control perspective
residual model
book value per share plus the present value of expected future residual earnings.
residual model suitable when
not paying dividends
expected free cash flows are negative
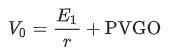
present value of growth opportunities
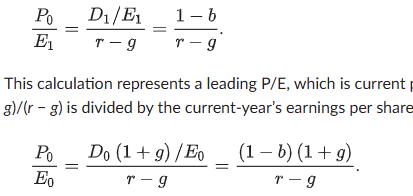
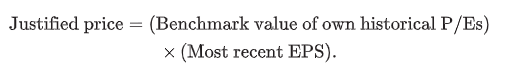
justified pe ratio
leading PE
trailing PE
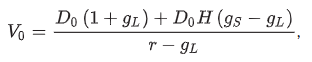
H-model
growth begins at a high rate and declines linearly throughout the supernormal growth period until it reaches a normal rate at the end
H = half-life in years of the high-growth period (i.e., high-growth period = 2H years)
gS = initial short-term dividend growth rate
gL = normal long-term dividend growth rate after Year 2H
sustainable growth rate
g = b × ROE
FCFF vs FCFE
FCFF = NI + NCC + Int(1 – Tax rate) – FCInv – WCInv
FCFE = FCFF – Int(1 – Tax rate) + Net borrowing.
FCFF = CFO + Int(1 – Tax rate) – FCInv
FCFE = CFO − FCInv + Net borrowing.
FCFF = EBITDA(1 – Tax rate) + Dep(Tax rate) – FCInv – WCInv.
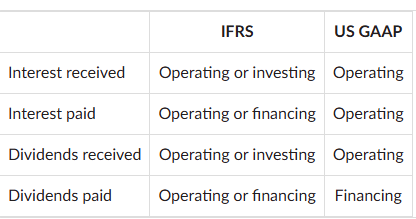
Interest and dividends (IFRS vs GAAP)
deferred taxes
should not add back deferred tax changes expected to reverse unless ot can consistently defer until a much later date
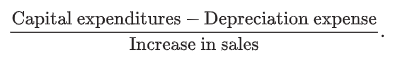
Incremental fixed capital expenditures as a proportion of sales increases
Required rate of return (real)
Country return (real)
+/– Industry adjustment
+/– Size adjustment
+/– Leverage adjustment
value of firm (FCFF)
V = Value of operating assets (FCFF) + value of non-operating assets (cash, marketable securities, land held for investment)
when to use FCFF vs FCFE
target debt/equity ratio is expected to remain consistent - FCFE
P/E ratios
Earning power is a chief driver of investment value,
widely recognized and used
EPS can be zero, negative, or insignificantly small
difficult to distinguish transient components
managers may distort EPS
normalizing EPS
estimating the level of EPS that the business could be expected to achieve under mid-cyclical conditions
historical average EPS
average return on equity, in which normalized EPS is calculated as the average return on equity (ROE) from the most recent full cycle, multiplied by current book value per share - effect on EPS of growth or shrinkage in the company’s size
inverse price ratio - earnings yield
reciprocal of the negative PE ratio
Predicted P/E Based on Cross-Sectional Regression
over a particular time period - predictive power over a different time/stock not known
relationships between P/Es and such characteristics as earnings growth, dividend payout, and beta are not stable over time
prone to the problem of multicollinearity
PEG ratio
P/E divided by the expected earnings growth rate (in %)
assumes a linear relationship between P/E and growth - in reality not linear
does not factor in differences in risk
does not account for differences in the duration of growth
justified price - historical eps
P/B
generally positive even when EPS is zero
book value per share is more stable than EPS- when EPS is abnormally high or low or is highly variable
companies composed chiefly of liquid assets, such as finance, investment, insurance, and banking institutions
not expected to continue as a going concern
human capital more important than physical capital - service companies not appropriate
levels of assets differ significantly - diff business models
Accounting effects on book value
some historical value some fair value
share repurchases or issuances can distort historical comparison
(Common shareholders’ equity)/(Number of common stock shares outstanding) = Book value per share
Adjustments to PB ratio
subtracting reported intangible assets
goodwill should be excluded
restate the book value of the company using LIFO to what it would be based on FIFO
adjusted for significant off-balance-sheet assets and liabilities
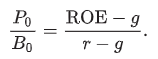
justified PB ratio
Price/Sales
Sales are generally less subject to distortion or manipulation than are other fundamentals
Sales are positive even when EPS is negative
appropriate for valuing the stocks of mature, cyclical, and zero-income companies
business may show high growth in sales even when it is not operating profitably
Share price reflects the effect of debt financing on profitability and risk but sales are before financing
does not reflect differences in cost structures
revenue recognition practices
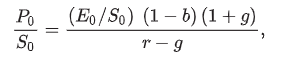
justified PS ratio
price to CF ratio
Cash flow is less subject to manipulation
addresses the issue of differences in accounting conservatism
Operating cash flow, for example, can be enhanced by securitizing accounts receivable
price/dividend yield
less risky component of total return than capital appreciation
but only one component of total return
may trade off future earnings growth to receive higher current dividends
annualized dividend rate divided by the current market price per share
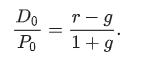
justified price/dividend yield
Enterprise Value/EBITDA
for comparing companies with different financial leverage (debt)
EBITDA controls for differences in depreciation
EBITDA is frequently positive when EPS is negative
EBITDA will overestimate cash flow from operations if working capital is growing
FCFF better
Enterprise Value
Market value of common equity (Number of shares outstanding × Price per share)
Plus: Market value of preferred stock (if any) and any minority interest (unless included elsewhere)
Plus: Market value of debt
Less: Cash and investments (specifically, cash, cash equivalents, and short-term investments)
Equals: Enterprise value.
Return on invested capital
operating profit after tax divided by invested capital
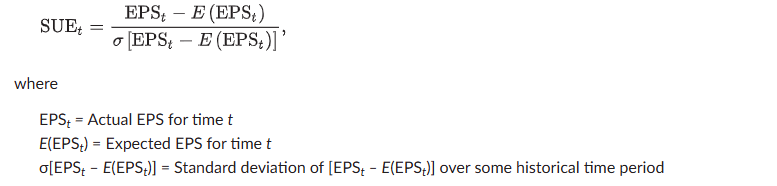
Earnings surprise
UEt = EPSt – E(EPSt),
standardized unexpected earnings (SUE)
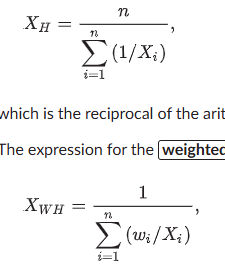
harmonic mean - for multiples
mitigate the impact of large outliers. It may aggravate the impact of small outliers
look-ahead bias
use of information that was not contemporaneously available in computing a quantity - back testing
capital charge
total cost of capital in money terms
COE* Equity + COD*(1-t)*Debt
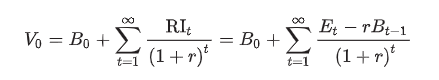
Residual income
NOPAT (after tax) - Capital charge or
Net income - Equity charge
ROIC
NOPAT (after tax)
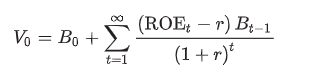
Residual income can also be calculated as (ROIC – Effective capital charge) × Beginning capital.
economic value added
EVA = NOPAT – (C% × TC),
C% is the cost of capital, and TC is total capital
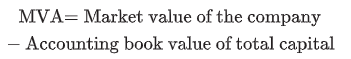
market value added
residual income model
current book value of equity + pv of expected residual income
assumes clean surplus accounting
excess earnings model
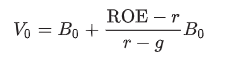
justified residual income model
Tobin’s q
ratio of the market value of debt and equity to the replacement cost of total assets
expected to be higher the greater the productivity of a company’s assets
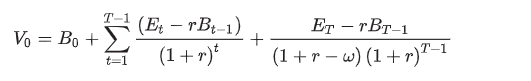
residual income model where residual income fades over time
persistence factor, ω, which is between zero and one
1: will not fade
residual income model - Strengths & weaknesses
Terminal values do not make up a large portion of the total present value
readily available accounting data
companies that do not pay dividends or to companies that do not have positive expected near-term free cash flows
when cash flows are unpredictable
focus on economic profitability
accounting data that can be subject to manipulation
require either that the clean surplus relation hold
assumes that the cost of debt capital is reflected appropriately by interest expense
DLOC & Control premium
DLOC = 1 – [1/(1 + Control premium)]
discount for lack of marketability (DLOM)
reflect the relative absence (compared with publicly traded companies) of a liquid market for a company’s shares.
DLOM + DLOC
Total Discount = [1 – (1 – DLOC)×(1 – DLOM)]