Theme 1: Population and Settlement
1/75
Earn XP
Description and Tags
Name | Mastery | Learn | Test | Matching | Spaced | Call with Kai |
|---|
No analytics yet
Send a link to your students to track their progress
76 Terms
Urbanisation
Increase in percentage of people living in urban areas.
Megacity
Urban area that contains more than 10 million people.
Counterurbanisation
Process by which people migrate from urban to rural communities. (Opposite of urbanization)
Suburbanisation
population shift from central urban areas in suburbs, resulting in the formation of (sub)urban sprawl. As a consequence of the movement of households the businesses out of the city centres, low-density, peripheral urban areas grow.
Low Income Countries (LIC)
Gross national income under $100/year
Newly Industrialising Countries (NIC)
Gross national income between $1000-12,000/year
High income countries (HIC)
Gross national income above $12,000/year
Lack access to basic services in Slums &Squatters
Lack access to improved water
Lack access to improved sanitation facilities.
Lack access to safe shelter in Slums &Squatters
Houses are not durable (prone to collapse/damage)
Lack sufficient living space
Lack secure tenure (land or buildings are held or occupied.) (often illegal)
S-Shaped Population Graph
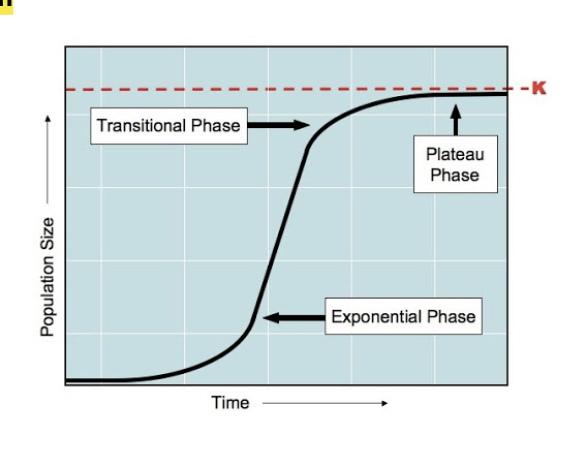
Reasons for fast rate of world’s population growth
Social
Political
Economic
Environmental
Demographic
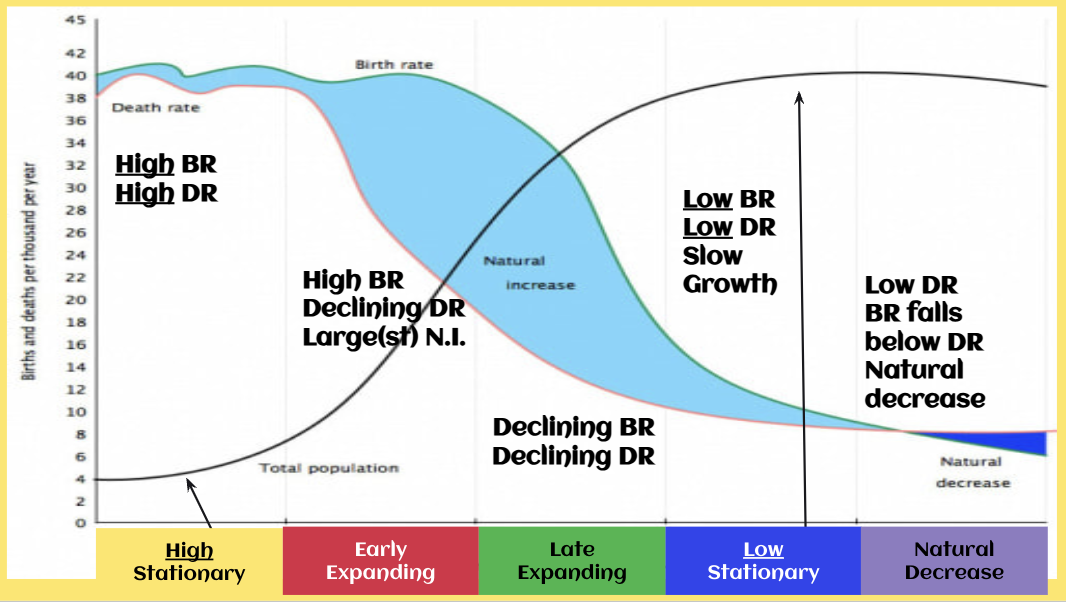
Demographic Transition Model (DTM)
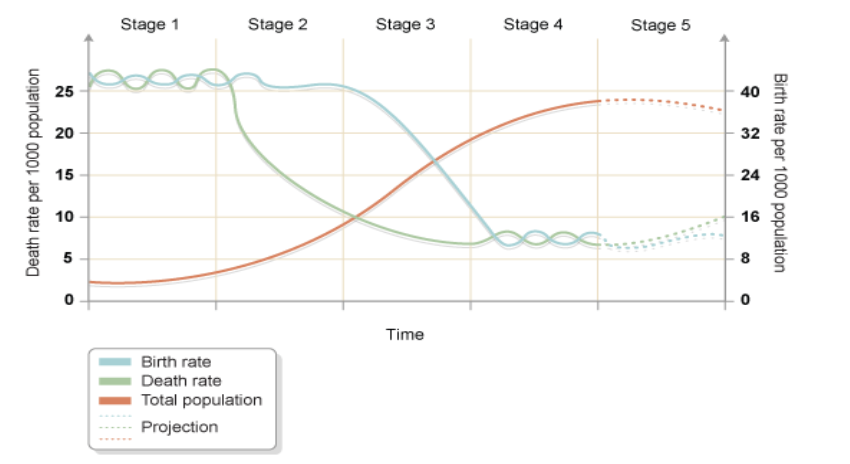
DTM Stage 1
Low population
No growth
High birth rate-no knowledge of family planning
High death rate-High infant and child mortality.
poor access to medical care
Low life expectancy- poor nutrition and disease.
DTM stage 2
Rapidly growing population
High birth rate-Lack of contraception
Falling death rate- have access to improved medical care and more children survive because of national vaccination programmes.
More access to food, and less people die from infectious disease.
Education is still low, many girls are left out of school and marry young.
DTM Stage 3
High growing population
population growth begins to slow down -due to improved education
Falling birth rate-slows down due to improved education
Low death rate
Higher life expectancy-medical provision and nutrition have continued to improve.
DTM stage 4
High population
Low birth rate
Low death rate
High life expectancy -excellent health care
Family size is small as people prefer fewer children-due to work pressures and more leisure time.
Women have full careers and marriage and children is put back to a much later age.
Some fluctuation in birth rate due to generational differences.
DTM Stage 5
Falling population
Low death rate
Low birth rate -people now prefer more leisure time and modern luxury than to have families. Increasingly people choose not to have children.
Death rate> birth rate
Increasing death rates=population size begins to fall.-ageing population
Birth Rate
The number of births per 1,000 of the population per year
Death Rate
The number of deaths per 1,000 of the population per year
Natural Increase
The positive difference between birth rate and death rate in a year
Infant Mortality
The number of infant deaths (under 1 year) per 1,000 per year
Child Mortality
The number of child deaths (under 5 years) per 1,000 per year
Life Expectancy
The average number of years you are expected to live based on the year of your birth
Carrying Capacity
Largest population that can be supported by the resources of a given environment.
Emigration rate
number of emigrants/1000 population leaving a country of a origin per year
Immigration rate
number of immigrants/1000 population entering a receiving country in a year
Fertility Rate
Total number of children that would be born to each woman should she live to the end of her chid bearing years
Projected declines in some places…
Russia, Germany, Japan, Italy
Slow population growth in some countries
China, France, Thailand, Malaysia
Medium population growth in some countries…
USA, India, Bangladesh, Brazil
Underpopulation
Population is too small to develop its resources effectively
Over population
increase in population/decrease in resources that results in decrease in Standards of Living (S.O.L) of the population as a whole.
Population Pyramid
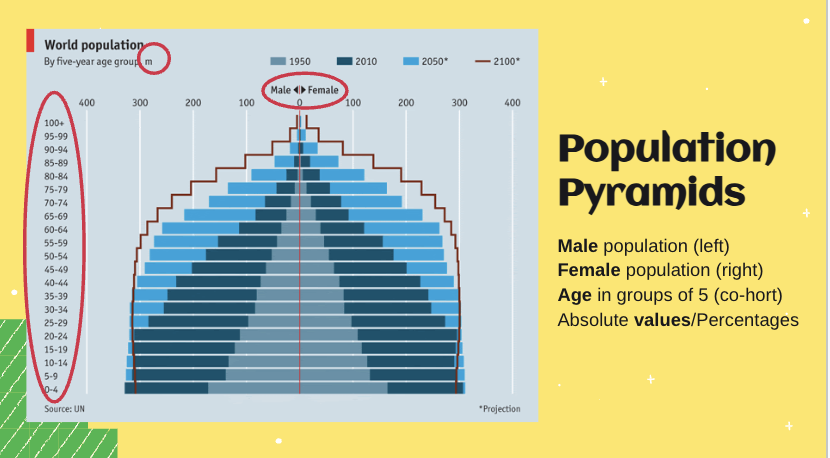
Life Expectancy
The average age a person can expect to live (based on statistical data in a particular place)
Dependents
Reliant on someone else (government, parents, children) to support the financially.
Dependency Ratio
Relationships between working/economically active population and the non-working population.
Dependency Ratio
% Population Aged 0-14 +%Population aged 56 and above /% population aged 15-64 ×100

Population Density
Refers to the average number of people living per square kilometer in a country/region.
Physical factors that affect where people live
Relief
Water
Soil fertility
Altitude
Climate (Temperature,Rainfall)
Dense vegetation
Mineral resources
Coast lines
Human factors that affect where people live
Jobs
trading
Quality of life
Entertainment/Leisure
Accessibility (Ports/Airports/Transport links)
Universities/schools
Accessibility
Types of Migration
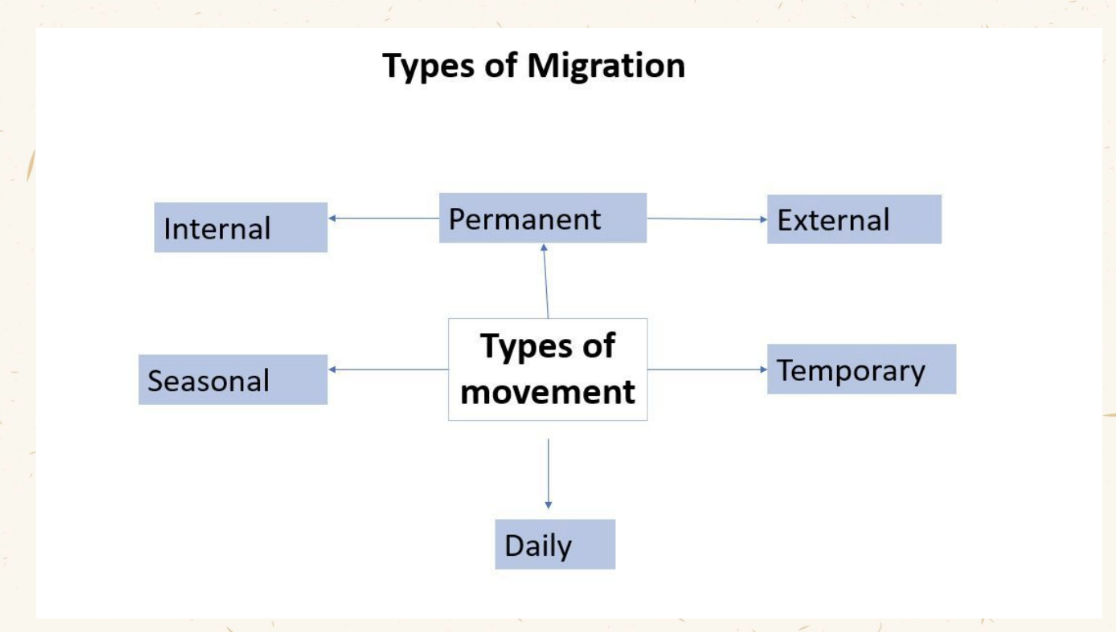
Rural-urban migration
The movement of people from rural to urban areas.
Voluntary migration
A migrant chooses to leave their country or a region
International migration
The movement of people across national borders
Involuntary (forced) Migration
Where a migrant has no choice and has to leave their country or region.
Push factors of migration
Natural disaster
High unemployment
Lack of access to career progression
Lack of healthcare and other services
Poverty due to low incomes
War
Racial, political, religious discrimination
Lack of safety /high crime
Housing shortage
Land shortage
Crop failure/famine
Pull factors of migration
Higher employment
Higher incomes
Availability of food supplies
Better healthcare and services
Better Housing
Higher standard of living
Better quality of life
Great political stability
“Bright lights syndrome”- the perception of better life
Less crime
Rural Depopulation
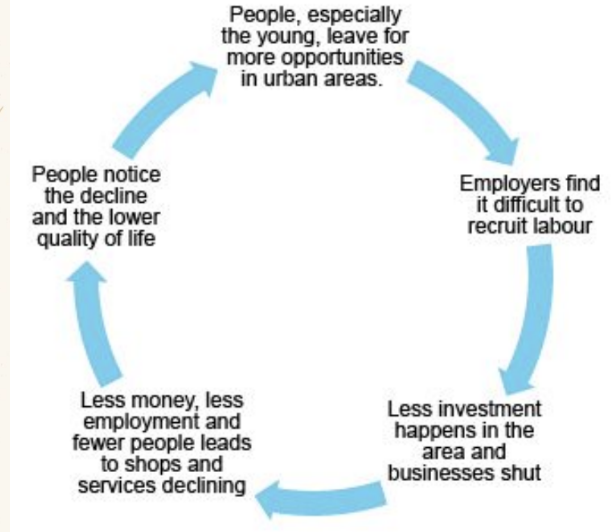
Counterurbanisation
The process by which an increasing number of people within a country live in the countryside instead of in towns and cities- this could be the result of a natural increase in population and/or migration.
Exam Question;
Using a named area, explain reasons for people choosing to migrate within a country [7].
Rural-Urban migration (voluntary):
People migrate from rural to urban areas within a country to look for better jobs [P]. For example, many young people migrate from rural areas in NE Brazil to the city, Rio de Janeiro. [E]. This is because the city offers higher paying jobs in the tertiary sector such as finance and legal jobs [E]. Hence the city attracts more people from the rural areas. [L].
Forced migration due to dam construction:
[P]: Some Brazilians were forced to leave due to the construction of massive hydroelectric dams.
[E]: Since 2000, construction from 81 dams has forced between 150,000 and 240,000 Brazilians from their homes and off their lands.
[E]:The development of dams has resulted in the destruction of agricultural and forested areas, making the homes uninhabitable.
[L]:Hence farmers need to leave the construction areas to other parts of the country where they can grow food to survive.
Join their family and relatives in other cities:
[P]:People choose to migrate to where other family members are residing.
[E]: For example, many people from the countryside join their family members who are already working in cities such as Sao Paulo or Rio de Janeiro.
[E]:Due to higher income by the family member in the city, he/she can now provide better standard of living for the migrated family in the city.
[L]:Therefore, some people choose to migrate to be able to join their family members who have migrated earlier.
Settlements
Place where people live and carry out a variety of activities; residence, trade, agriculture and manufacturing.
Rural Settlements
Pattern, Form, Site&Situation, Function & Hierarchy +Changes
Dispersed Settlement Patterns
Houses are scattered/ spread out across a large area.
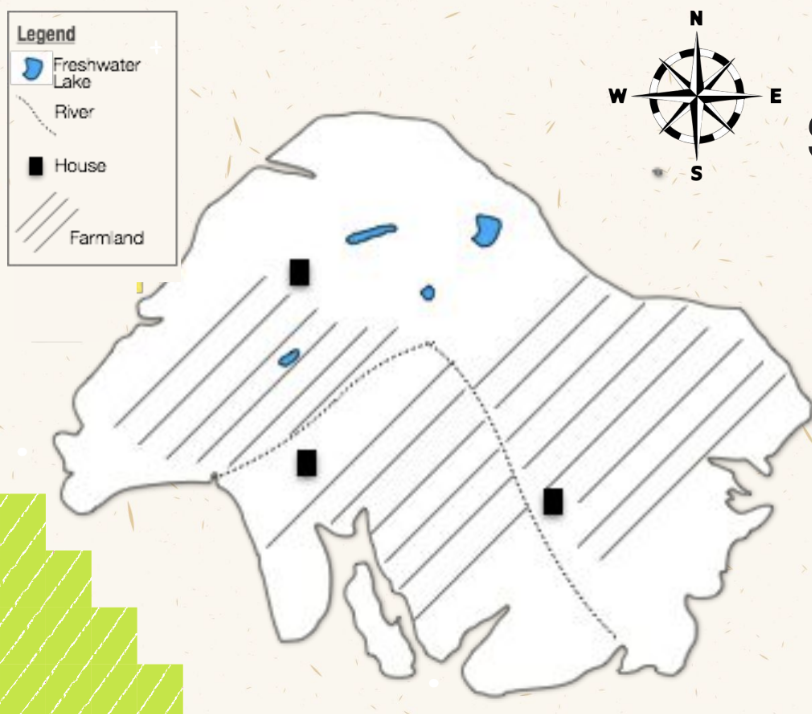
Linear Settlement Patterns
Houses are found in a line along physical features or human feathers.
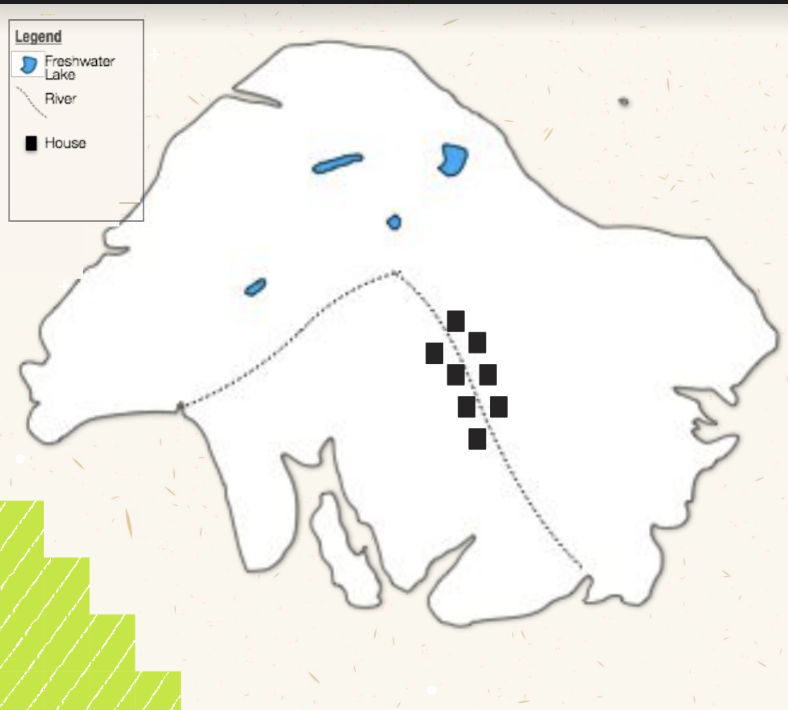
Nucleated Settlement Patterns
Houses are grouped closely together (or clustered) in the same area.
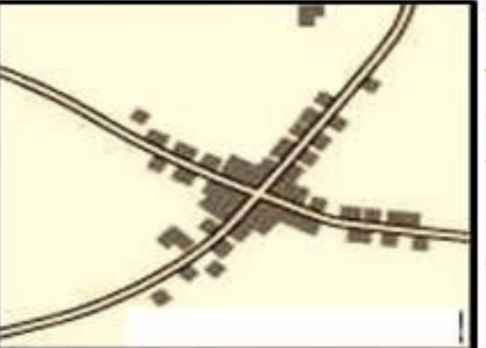
Linear (form/shape)
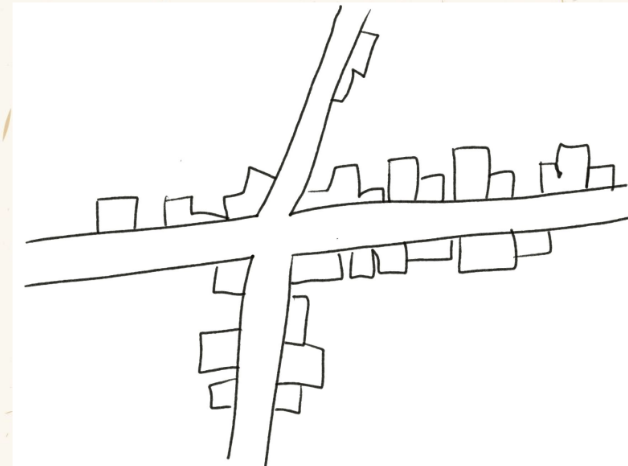
Cruciform Settlements (form/shape)
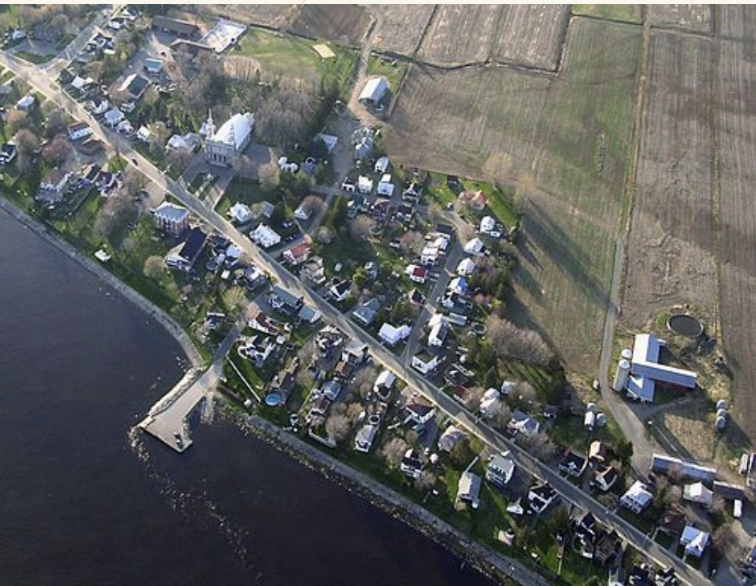
Green Villages (form/shape)
Spring Line Settlements (form/shape)
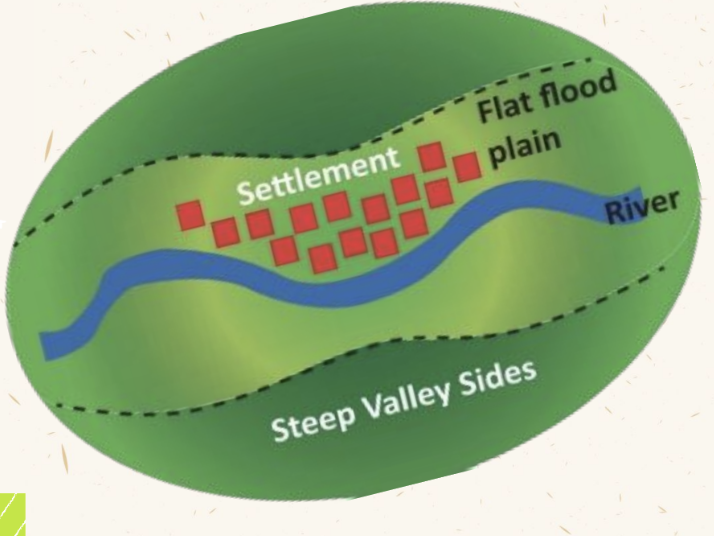
Sites
Actual land on which a settlement is built
Situation
Relationship between settlement and its surrounding area
Dry Point Site
Elevated site in an area of otherwise poor natural drainage.
Wet Point Site
Site with reliable supply of water from spring/wells in an otherwise dry area.
Physical Factors (influencing settlement location and expansion of site)
Climate (people like living in climate that’s not too hot or too cold)
Accessibility to natural resources (availability of fresh water)
Fertile land (for farming for stable source of food)
Relief (the slope of the land - steep/gentle/flat:easier to build on flat lands)
Geographical location (places near trading routes are favoured)
Social factors (influencing settlement location and expansion of site)
medical developments; increase lifespan/more birth hence settlements expand.
Number of schools/type of schools (primary+secondary+further education)
Availability of opportunities (job/education/healthcare)
Accessibility/Proximity to places of significance (other prominent cities)
Political Factors (influencing settlement location and expansion of site)
Investment in transportation network (accessibility)
Naming of capital city (government chooses → Lots of job opportunities ; very well developed)
Naming of new administrative centres (government chooses → can shift or influence people to move)
New capital cities (P) → decision made to have administrative centres→ more opportunities →more people attracted…
Planned cities (p) → decision to have technology/ industrial hub (E) →more opportunities…
Economic factors (influencing settlement location and expansion of site)
Trade opportunities (especially near ports/sea/major trading routes)
Employment Opportunities (closely related to what’s available on site)
Growth is influenced by… (settlement)
Extreme climate
Abundance/ Lack of food suply
Lack of/ presence of physical barriers
Absence/ presence of raw materials
Geographical location ; trade opportunities
Settlement Hierarchy
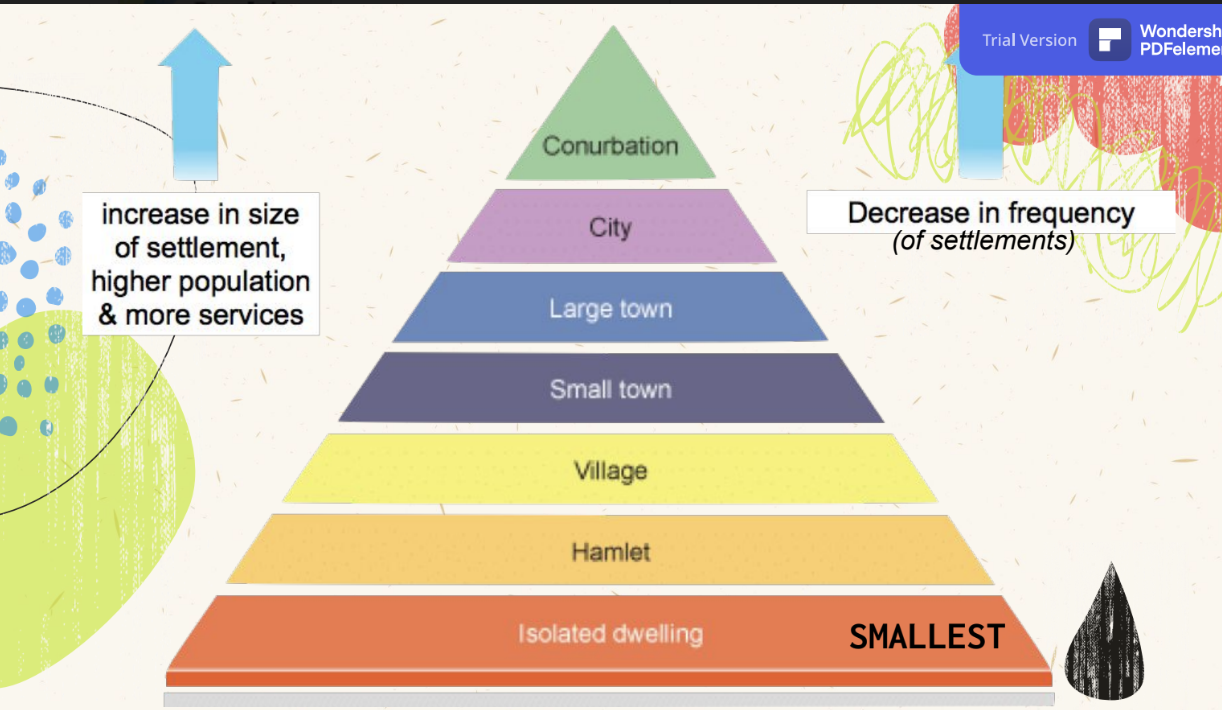
Low-order services
Support low population sizes
Range of Good
Maximum distance a person is willing to travel to buy a good
High-order functions
Has both variety of services available and at high frequency
Threshold Population
Number or people needed to support a good/service
Urban Sprawl
The rapid expansion of the geographic extent of cities and towns.
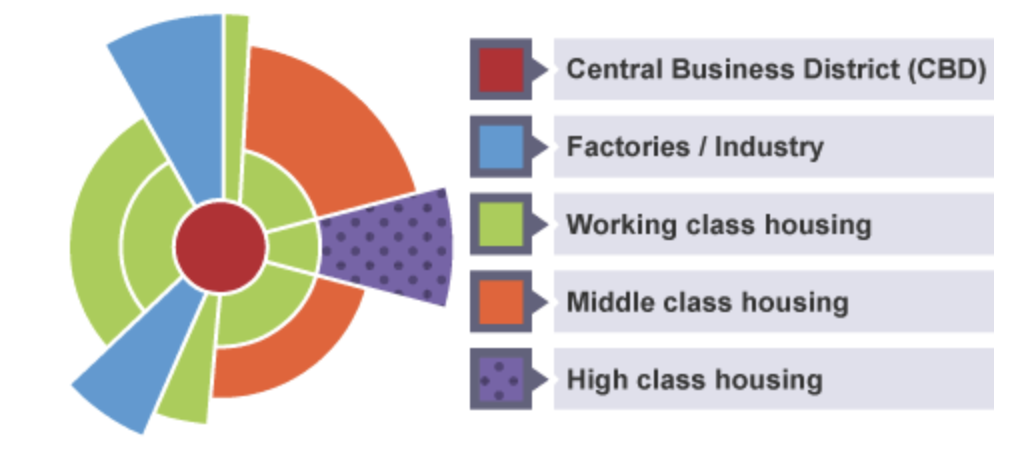
Burgess Model
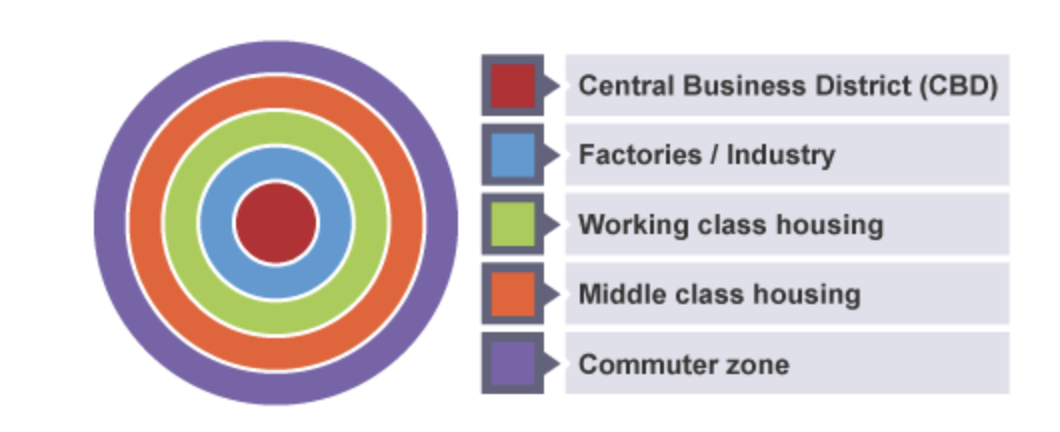
Hoyt model
with development of transport. Factories doesn’t have to be very near the CBD (unlike the burgess model)
