3. Null Hypothesis Significance Testing NOT DONE
1/18
There's no tags or description
Looks like no tags are added yet.
Name | Mastery | Learn | Test | Matching | Spaced | Call with Kai |
|---|
No analytics yet
Send a link to your students to track their progress
19 Terms
The quantitative research process
Confirmatory research
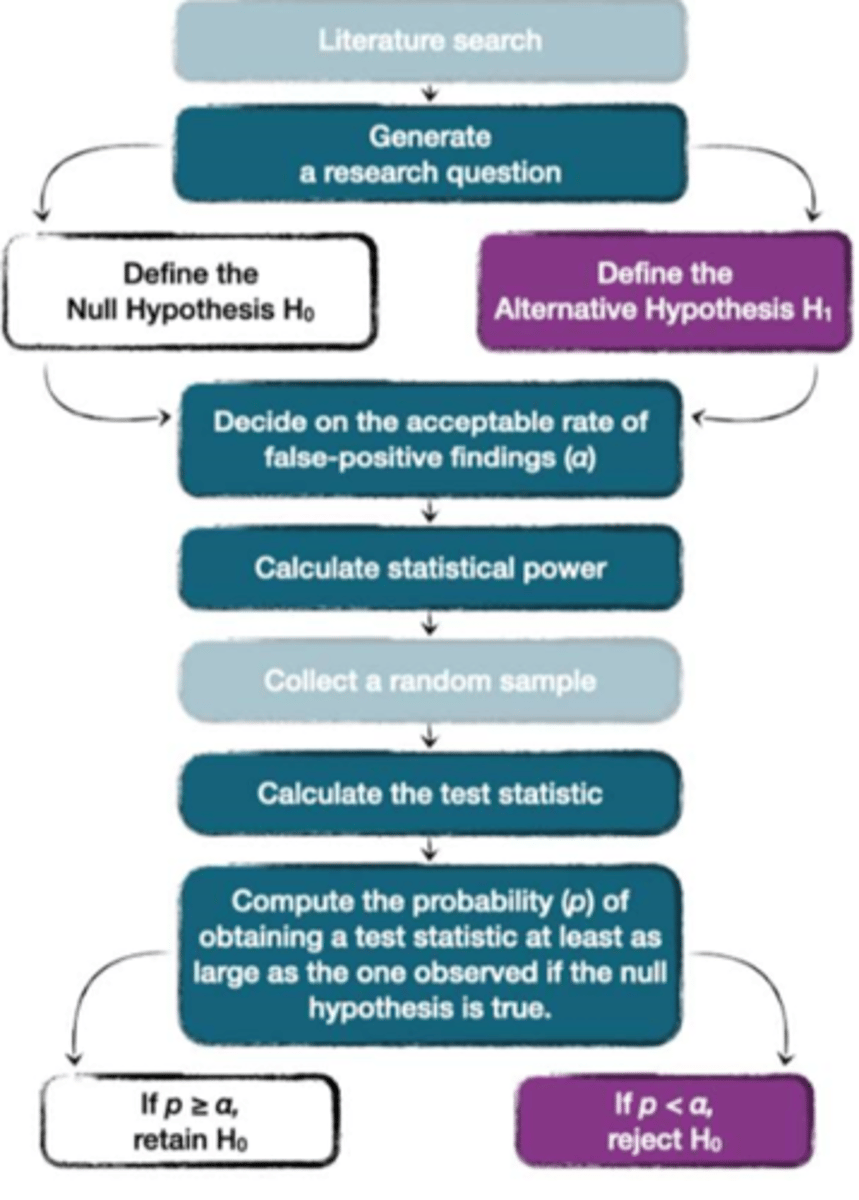
Focus on testing specific hypotheses and generally follows this formula (see pic) - other approaches do exist though. Null Hypothesis Significance Testing (NHST)

Exploratory research
Doesn't start with a hypothesis. Can collect new data or work with existing data. Useful for generating hypotheses, but statistical tests can be difficult to interpret
A good research question...
Is;
- Researchable and realistic
- Informed by prior research (a gap in literature or need for replication)
- Not too broad or narrow - proportional to project at hand
Hypothesis
A testable prediction, a statement about what we reasonably believe our data will show. The prediction is based on prior information i.e. literature or prior research
Hypotheses - conceptual
Describes prediction in conceptual terms. Can be defined in terms of the direction of the effect that we're studying.
Non-directional (i.e. two-tailed) - E.G. "There will be differences in anxiety between participants in group A and group B"
Directional (i.e. one-tailed) - E.G. "Participants in group A will show higher levels of anxiety than those in group B"
Hypotheses - operational
E.G. "Participants in group A will score higher on the state-trait anxiety inventory than those in group B" OR "Participants in group A will show higher skin conductance response than those in group B"
Hypotheses - statistical
What do we expect to happen numerically
MGroup A ≠ MGroup B OR MGroup A > MGroup B etc
Alternative hypothesis
What our actual prediction is (there will be a difference), denoted as H1
Null hypothesis
Represents negation of prediction we're making - a reality where the effect we're interested in doesn't exist. Denoted as H0
α (alpha) level
Rate of false-positive findings we are willing to accept if we live in a reality where the null hypothesis is true. Decision should always be based on a cost-benefit analysis (how risky is it to be wrong), however psychologists often use a rate of 5% as a blanket rule
Calculate statistical power
Way of deciding how large a sample is needed to get meaningful results on a statistical test - more detail later...
Calculate test statistic
Numeric value used to test hypothesis, different ones for different situations e.g. t, F or χ2 (chi-squared). Could also be seen as the mean difference between the two groups
p value
Want to know the probability of observing the test statistic at least as large as the one observed if the null hypothesis is true. If null hypothesis was true, we would expect a difference of 0. Work out probability of your mean difference or test statistic - is it more (accept null, reject alt) or less (reject null, accept alt) than the alpha/critical value
p value and probability
The p-value doesn't actually tell us anything about the probability of the null or alternative hypothesis. It tells us how likely the detected effect is, IF the null hypothesis is true
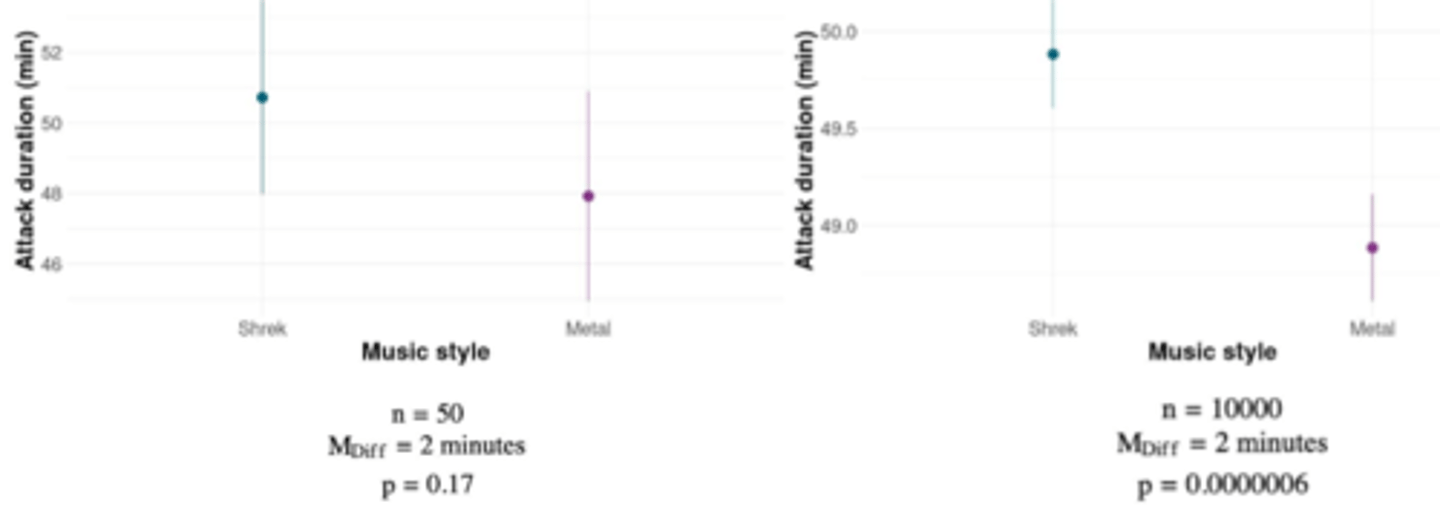
Limitations of NHST
p values are sensitive to sample size, so any tiny difference can make something statistically significant with a large enough sample (see e.g. in image)
Power analysis
Determining the necessary sample size before data collection so not to over or under sample.
Statistical power
Probability of detecting an effect of a certain size as statistically significant, assuming the effect exists. E.g. want a difference of 10 mins between conditions, calculate sample size necessary for this effect
More ppts needed for; smaller effects and/or complicated designs
Statistical power cont.
Makes non-significant effects easier to interpret and reduces probability of missing an important finding. Statistical power of 80% is considered the standard to aim for