Population and the environment
1/91
There's no tags or description
Looks like no tags are added yet.
Name | Mastery | Learn | Test | Matching | Spaced |
|---|
No study sessions yet.
92 Terms
Key elements in the physical environment: climate
Climate affects the health and wellbeing of the population by dictating how many people can be supported in an area.
The climate affects agriculture crops need certain conditions to grow, and food is needed to support a population.
Climate affects incidence of disease some diseases thrive in certain climates, which affects population sizes.
Some places with extreme climates makes then uninhabitable e.g., the Sahara Desert or Antarctica.
Climate can affect where people live e.g., some Pacific islands are going to be uninhabitable in the next 20 years due to sea level rise, forcing people to move.
Key elements in the physical environment: soils
Soil is relied on by the population.
The water content, nutrient content, and overall soil quality affects agricultural productivity, which is important in providing food to support populations.
Key elements in the physical environment: resource distribution inc. water supply
Natural resources are needed for a population to grow and they cannot be supported without access to these important resources.
A clean water supply needed for hygiene, sanitation, drinking, and irrigation
E.g., 90% of Egypt’s population live along the river Nile.
Water can be used for countries to trade and so countries with coastal areas develop these trade links.
Materials for shelter, fuel etc. before there were a means of transporting these resources, they had to be sourced locally.
Distribution – some areas are rich in fossil fuels e.g., oil in the Middle East and so attracts people, industries and jobs
Key population parameters
Population distribution → how a population is spread globally or regionally e.g., low or high distribution.
Tokyo is the most populated city in the world with 38 million, whereas Antarctica has no inhabitants.
Population density → a measurement of population per unit area e.g., population per km^2.
Manila is the most densely populated city in the world with more than 43,500 people per square km.
Population numbers → the amount of people in a defined area (population) e.g., a town, region or country.
Population change → increases and decreases in population over a period of time
Key role of development processes: developments in food supply
The Neolithic Revolution:
12,000 years ago, there was a shift from mobile hunter-gatherer populations to agricultural communities, with the lack of a mobile lifestyle allowing women to have more children.
Agriculture could also feed denser communities, and although more intensive and nutritional standards were lower, these communities had a more stable food supply.
Overall, there were baby booms and population growth rates quickened rapidly.
Key role of development processes: developments in food supply
The Green Revolution:
The green revolution → the process of using technology and more efficient farming supplies/practices in agriculture to maximise yields in the 50s and 60s.
Overall created more food, especially in developing countries, meaning a larger population could be sustained.
An estimated 1 billion people are able to be fed due to the revolution, illustrating the effects on the population.
Key role of development processes: societal developments
Industrial Revolution:
Industrial revolution → the transition from majorly labour-intensive industry to technology manufacturing processes inc. use of machinery, fossil fuels, and factories.
Revolutionised agriculture as the manufacture of goods, transportation, medicine, has made life less labour intensive for many people.
At the start of the revolution in the mid-1700s, the population grew by 57%, and 100 years on the population grew by 100%.
Niger example of negative impacts of development processes
Development processes are also having negative effects on population growth, in the sense that some societal developments are causing population growth to slow or rapidly increase.
Niger has the highest fertility rate in the world → 6.6 in 2024.
Due to cultural issues with polygamous relationships and wives outdoing each other in number of births.
Plus it’s one of the poorest countries in the world – poverty, poor access to contraception.
And weak political improvements – government allocated tiny proportion of budget to family planning.
Global patterns of food production
Food production has tripled globally in the last 50 years.
Global arable land has increased by 67 million hectares – but decreased in developed countries – more crops grown on more land and are of better quality.
This is because of:
An increased use of farming machinery e.g., combine harvesters → allows for more crops to be collected in a quicker time frame.
Increased use of other farming resources e.g., herbicides & pesticides → to maximise yields by limiting plant deaths.
Regional patterns of food production
Wheat and rice production has increased in Asia and Northern Africa – due to higher yields.
Maize production has increased in Latin America and the Caribbean – due to methods of land expansion (creating more arable land).
Food production is unevenly distributed:
Low-income countries produce the least amount of crops.
The richest countries has the largest food supplies – they produce enough/more calories for their population.
This production trend varies crop by crop, usually due to environmental limitations in other countries, meaning consequently lower crops.
High yields → Eastern Asia, North America & Western Europe – availability of resources e.g., nutrients and water, and high amounts of rainfall.
Moderate yields → South Asia, South America, Western Africa – are at risk of environmental limitations e.g., droughts and flooding, especially with climate change.
Little to no yield → Central Australia, Saharan Africa, Eastern Russia – extreme environmental limitations e.g., droughts and unsuitable temperatures for crop growth.
Global patterns of food consumption
Food consumption has increased over time due to higher populations consuming food as well as per person.
LICs consume less food as HICs can afford to import food and invest in agriculture, as well as more money per person to buy food.
North America has the highest consumption rate, followed by Europe.
Developing countries consumption rates are growing the quickest.
Asia’s consumption rate has seen the quickest growth; China’s consumption has increased by nearly 1000 calories in 50 years.
Africa consumes the least calories out of every continent – over 27% of Africa’s population are affected by severe food insecurity.
Regional patterns of food consumption
Food consumption varies regionally – different regions of the world consume different types of food due to socio-economic reasons.
Cereals:
Account for 70% of energy intake in Africa and Asia, and 30% in HICs
Rice consumption is the highest in China and East Asian countries, but is projected to decline.
Meats:
Developed countries eat the most meats e.g., pig, sheep & cattle in North America and Europe.
Camel and goat is the dominant meat in the Middle-East, India and Africa.
Meat consumption is increasing, especially in rapidly developing countries e.g., China specifically consumes nine times the amount of meat they once did.
Fats, oils and sugars:
Consumption of these products are highest in HICs due to consumerist culture.
Consumption is rapidly increasing in developing countries, but is still slower in the least developed countries.
Agricultural systems
Agriculture → the production of yields (crops) through the addition of resources and processes.
Agriculture can be classed as a system, as there are inputs, processes, and outputs.
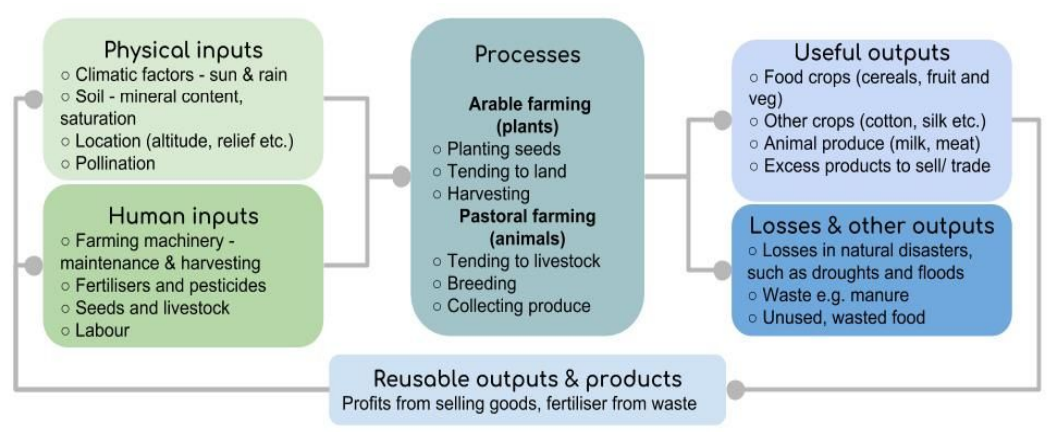
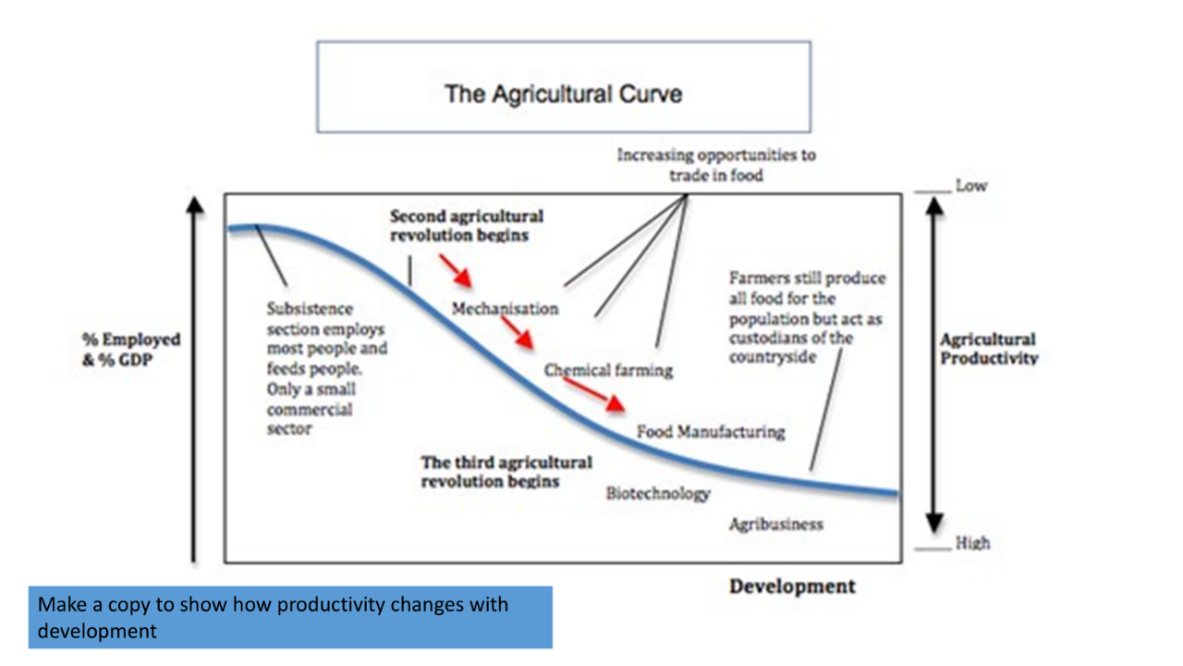
Agricultural productivity
Agricultural productivity the amount of useful outputs (yield) in proportion to the amount of inputs, showing the efficiency of the farm.
High productivity = high yields achieved through low inputs e.g., saving time, labour and money.
High productivity farms also usually have little to no losses as they are efficient, e.g. they may reuse excess crops to feed livestock, saving money.
The agricultural curve showing how productivity changes with development.
Types of agricultural systems
The type of agricultural systems → there are different agricultural systems in practice globally, which have varying inputs to yield varying outputs:
Intensive farming → high inputs e.g., labour or capital, in relation agricultural land to produce the highest possible output.
Extensive farming → low labour and capital inputs in relation to agricultural land, producing lower outputs.
Arable farming → plants
Pastoral farming → animals
Commercial farming → the intention of providing yields that can be sold commercially, making a profit – usually associated with intensive farming.
Subsistence farming → self-sufficient farming, where crops are grown to support crop-growing families or community, with little to no profit.
Relationship with agricultural productivity and key physical environmental variables – climate and soils:
Climate:
Certain levels of water are needed to sustain plant and livestock growth – climates that provide appropriate precipitation allow for higher yields, and drier climates must source water elsewhere or deal with lower yields.
Temperatures must be within a certain range and not too hot or too cold – can cause productivity to decrease e.g., livestock/plants dying.
E.g., in Asia, it’s predicted that with every 1°C temperature rise, rice yields will decrease by 20%.
Climatic conditions need to be suitable for agriculture e.g., sub-zero temperatures or deserts reduce productivity massively, with little agriculture sustained.
Climate change means specialised farming cannot produce high yields and the amount of arable land is decreasing e.g., rising sea levels due to melting sea ice is thought to cause flooding in low lying areas in Bangladesh, devastating crop yields.
Some crops and animals can only be farmed in certain climates e.g., tropical exotic fruits.
Soils:
Quality of soil is crucial to agricultural productivity.
Agricultural productivity may decrease through soil issues e.g., erosion, flooding, or desertification.
Low nutrients affect plant growth and animal food supply.
Characteristics and distribution of two major climatic types to exemplify relationships between climate and human activities and numbers: polar tundra
Distribution:
Polar climates cover 20% of the earth’s surface.
Found in both Northern and Southern hemispheres e.g., Arctic circle & Antarctica.
Countries include Northern Canada, Svalbard, Northern Russia and Southern coast of South America.
Characteristics:
Very low average annual temperatures – -40°C in winter in Arctic up to 10°C in summer.
Precipitation levels less than 100mm a year – making all polar regions polar deserts due to high pressure zone.
Short growing season of only 2 months = no trees, permafrost and swamps in low lying areas, and shrubs in warmer areas.
Characteristics and distribution of two major climatic types to exemplify relationships between climate and human activities and numbers: polar tundra
Human activities and numbers:
Harsh climate and soils leaves very low populations – 4 million people live within the Arctic circle e.g., Innuit indigenous community in Greenland.
There are no permanent residents in Antarctica but scientific research bases support small temporary populations - pop. density is 0.03
Impossible to arable farm due to permafrost, requiring technological input – agriculture is mainly subsistence with low productivity.
Polar regions contain vast untapped reserves of oil, gas and other minerals, with pressure on the regions to exploit these resources.
Cruise ships visit the regions during the summer months, bringing income to local economies in the form of adventure tourism.
Threats to this region:
Climate change → rising global temperatures, affecting migration patterns, affecting habitats, affecting hunting e.g., Svalbard is the fastest warming place in the world.
Animal dangers → guns are used against polar bears.
Tourism → bring invasive species, leave litter, carbon footprint from transporting, animal disturbance.
Characteristics and distribution of two major climatic types to exemplify relationships between climate and human activities and numbers: tropical monsoon
Distribution:
Found along the equator in between the tropics.
One of the largest areas – this climate found in Northern part of South America, with some parts of Indonesia and Africa.
Rainforests found within this climate.
Characteristics:
The band of rain shifts in accordance to the season (monsoon) – some parts very dry and others have heavy rainfall.
Temperatures can average 30C in the monsoon season and humidity is very high.
Average rainfall is around 2000mm for the season – very high!
Wet season from May to Oct – when the sun heats the land intensively causing a low-pressure system as air rises sucking in moist air from the sea, bringing heavy rains.
Characteristics and distribution of two major climatic types to exemplify relationships between climate and human activities and numbers: tropical monsoon
Human activities and numbers:
60% of the world population live in monsoon climates, including the world’s most populated areas e.g., China, Pakistan, India, Japan.
Subsistence farming is common – income levels low.
Monsoon climate supports a high population density e.g., Bangladesh’ PD is 1252 per km sq.
A large amount of electricity in South-East Asia comes from hydroelectric power plants, driven by water collected during the monsoons – helps power hospitals, schools and industries.
Rice and tea are some crops that rely on the summer monsoon.
Threats to this region:
Climate change → reduces reliability / predictability of the monsoon rains - changes in rain patterns, and rain amount can impact the economy.
E.g., Nepal – an exceptionally wet monsoon caused floods and landslides
Deforestation → leads to soil erosion where removal of topsoil impacts agricultural productivity and water quality.
Climate change as it affects agriculture
Wildfires increases risk to livestock and vegetation and soils.
Droughts dry out soil, preventing arable farming and increases pressure to irrigate.
Climate change leads to conflict – if supply of food production is low when demand is high, increased prices and inflation create battles over food shortages.
Shifting seasonal rainfall patterns and more severe precipitation events may delay planting and harvesting.
Coastal flooding from sea level rise will diminish land area for crops in low-lying regions e.g., Bangladesh.
Crops developed to adapt to changing climate e.g., flood-resistant rice varieties.
Warming environments allow pests to thrive and even reproduce more, annually – reduce survival of crops – for every 1C increase in temperature, there is a 10% decline in agricultural production.
Characteristics and distribution of two key zonal soils to exemplify relationship between soils and human activities especially agriculture: podsol soils
Distribution:
Found in cool temperate climates with high precipitation.
Mainly in boreal (coniferous) forests of Canada, Scandinavia, Russia, and Scotland.
Occur on steep slopes where water drains quickly, increasing leaching (where nutrients are washed away).
Characteristics:
Acidic and nutrient-poor due to decay of coniferous tree needles, which produce acidic humus (the dark organic matter in soil that is formed by the decomposition of plant and animal matter).
Low biological activity → are a lack of earthworms and microorganisms to mix the soil due to the cold climate and acidic conditions.
Distinct horizons:
O horizon → the organic layer which is a thick layer of decomposed conifer needles and plant material.
A horizon → the topsoil layer which is thin, dark brown, and low in nutrients.
E horizon → the eluvial layer which is pale, ash-grey because minerals and nutrients are washed out
B horizon → the illuvial layer which is reddish-brown where iron and aluminium build up. Sometimes an iron pan forms, blocking water from draining properly.
C horizon → the parent material which is original rock that has weathered over time.
Characteristics and distribution of two key zonal soils to exemplify relationship between soils and human activities especially agriculture: podsol soils
Relationship with human activities:
Agriculture:
Poor soil fertility makes it unsuitable for growing crops.
But farmers may add lime and fertilisers to reduce acidity and improve it.
Sometimes used for grazing animals, but not very productive.
Forestry (tree farming):
Well-suited for conifer plantations e.g., pine and spruce trees, because these trees naturally grow in podsols.
Used for timber and paper manufacturing.
Challenges:
Iron pan restricts drainage – leads to waterlogged soils.
Deforestation increases leaching, washing out more nutrients – makes soil even less fertile.
Climate change could shift the locations where podsols form, impacting ecosystems.
Characteristics and distribution of two key zonal soils to exemplify relationship between soils and human activities especially agriculture: brown earth forest soils
Distribution:
Found in temperate deciduous forests (trees that shed leaves in winter).
Common in places like Western and Central Europe, Eastern USA, and parts of China and Japan.
Also found in southern UK e.g., Kent, Midlands, and Wales – covers 45% of land in England and Wales.
Develop in areas with moderate rainfall (750-1,500mm per year) and mild temperatures (5-15°C).
Form on gentle slopes, meaning they are less affected by erosion and waterlogging.
Characteristics:
Well-drained, deep, and fertile – meaning it is good for farming.
Moderate leaching – some nutrients are washed away but not as much as in podsols.
Neutral to slightly acidic pH, depending on type of parent rock.
High biological activity with many decomposers like earthworms, mixing the soil, helping to keep nutrients available.
Horizons:
O horizon → the organic layer which is rich in decomposed leaves from deciduous trees (e.g., oak, beech).
A horizon → the topsoil layer which is thick, brown, nutrient-rich, and has a high level of biological activity (lots of earthworms and bacteria).
B horizon → the subsoil layer which some clay and nutrients accumulate here, but the layers are not as distinct as in podsols.
C horizon → the parent material layer which weathered rock, which influences soil texture and fertility.
Characteristics and distribution of two key zonal soils to exemplify relationship between soils and human activities especially agriculture: brown earth forest soils
Relationship with human activities:
Agriculture:
Very fertile and suitable for arable farming – good for growth of crops e.g., wheat, barley, and vegetables.
Good for pastoral farming e.g., raising livestock like cows and sheep.
Well-drained structure means it doesn’t get waterlogged easily.
Deforestation impact:
Trees removed reduce organic matter – fewer nutrients return to the soil.
Increased risk of soil erosion, especially on slopes, as there are no tree roots to hold the soil in place.
Urban expansion:
Often used for building cities and towns because the land is fertile and flat.
But, soil sealing (covering ground with buildings, roads and pavements) disrupts natural water drainage.
Sustainable management and protecting the soil:
Crop rotation (changing types of crops grown each year) helps maintain soil fertility.
Adding fertilisers can replace lost nutrients.
Planting hedgerows (shrubs and trees) prevents erosion and maintains biodiversity.
Problems with soil erosion
Soil erosion → wearing away of the top layer of soil (topsoil).
It’s estimated that 75 billion tonnes of topsoil are lost each year – significant as it takes 1000 years to grow 3cm of topsoil.
Problems:
Water erosion:
Soil is washed away – causes crops to become unstable and crops may also wash away.
Nutrients are leached away into lower parts of the soil, or entirely washed away – can negatively affect plant growth.
Weeds can spread from other areas if carried in water – can reduce the productivity of a farm.
Rills and gullies (small streams developed by erosional flowing water) can obstruct farming equipment – reduces amount of agricultural land and causes potential dangers. Undercut riverbanks are also dangerous, especially if they collapse.
Wind erosion:
The most fertile topsoil is blow away – leaves crops with less nutrients for growth.
Crops can become buried in thin layers of soil after high winds – damages crops and restricts sunlight.
Wind erosion lowers a soil’s capacity to store water as the depth of soil is reduced – causes soil to become drier. This in turn affects crops, as there is less water available and less space in the topsoil for roots – lowers productivity
Management of soil erosion
Afforestation → allows roots to stabilise soil and return leaf litter nutrients.
Fertilisers added to soils to improve nutrient content.
Rotate crops → allows soil to recover before planting again.
Planting natural windbreaks, such as hedges.
Terracing on steep slopes → terracing is an agricultural technique of cutting into the slopes of mountains or hills to create rows of level areas of flat land.
Problems with waterlogging
Waterlogging → when the soil becomes oversaturated with water.
Can occur naturally (from heavy rainfall or flooding) but also from structural deterioration or other farming practices e.g., too much irrigation.
Problems:
Roots may rot in stagnant water – kills the plant or stunts its growth.
Waterlogged conditions can leach away minerals for plant growth, or bring unwanted minerals to the topsoil, such as salts.
Water lowers the temperature of soils, which slows photosynthesis.
Weeds outgrow crops as can survive waterlogged conditions better.
Management of waterlogging
Sustainable irrigation systems – prevents water wastage and flooding of crops.
Adding sand to clay soils to increase pore spaces – increases infiltration.
Problems with salinisation
Salinisation → the increase of salt content in soil, usually causing a crust of salt on the topsoil.
Generally, salinisation occurs when saline water (saltwater) rises to the surface of the soil and then the water evaporates – leaves salt concentrate on the topsoil.
Problems:
Salts are toxic to plants – can reduce the fertility of plants, reduce yields, or kill them.
High salt contents in soils affect how plants can absorb water – water usually moves as osmosis – but, when the salt content is high, this can hinder the process, or even dehydrate the plants.
Salinisation may also break up natural soil structure – affects plant growth and productivity.
E.g., salinisation in San Joaquin Valley, California, projected to cost the state $1-1.5 billion.
Management of salinisation
Selection of deep-rooted crops to increase water retention – reduces salt concentration.
Soil flushing with water – although can cause problems of waterlogging.
Using fertilisers with low salt content.
Drip-irrigation and soil moisture monitoring – removes excess salt from the root zone through slow infiltration.
Problems with structural deterioration
Structural deterioration → the loss of the structure of the soil, especially the pores between soil particles that contain air.
It can occur for a number of reasons:
Livestock can trample on the ground – compacts soil and removes the natural spaces between the particles.
Crops and plants’ roots give structure to the soil, so removing these for clearing agricultural land or for harvests can disrupt the structure.
Farming machinery can cause soil compaction – removes air spaces in the ground.
Problems:
Water cannot infiltrate due to the lack of space in the soil – means plants may become dehydrated and dry out.
Root cells need air to survive, which they get from the soil environment – structural deterioration can remove air pockets and essentially suffocate roots.
Root growth may become obstructed as the roots cannot move through compacted soil.
Soil is harder to work with when the structure has deteriorated e.g., it is harder to plough or till.
Management of structural deterioration
Avoiding use of heavy machinery – leads to vast soil damage.
Move livestock around to avoid compaction.
Introducing more organic matter into the soil – encourages soil to aggregate together to increase number of pore spaces.
Strategies to ensure food security: increasing the supply of food
Green revolution:
Green revolution → a period of technology transfer initiatives that saw greatly increased crop yields.
Increased uses of fertilisers/pesticides, irrigation, and development of high yielding varieties have increased yields in areas, such as India.
Lead to double-cropping, which includes planting two crops rather than one, annually.
Thought to be responsible for increased calorie intake in LIC’s – has raised grain yields by 160%.
However, salinisation is caused by irrigation and farmers are unable to repay loans on expensive equipment – not sustainable in the long-term?
Hydroponics:
Hydroponics → involves growing plants, usually crops or medicinal plants, without soil, by using water-based mineral nutrient solutions in an artificial environment.
They deliver precise amounts of water and nutrients directly to plant roots – reduces water consumption by up to 90% compared to traditional soil-based farming.
Achieves 11 times higher yields and using approximately 80-90% less water – emerges as a promising agricultural innovation that minimizes environmental impact and maximizes crop yields.
Strategies to ensure food security: increasing access to food
Governmental changes:
Grants and food vouchers to vulnerable households.
Free school meals for the most disadvantaged children.
Trade agreements and foreign markets:
Increasing access to foreign markets – countries can import food they cannot produce themselves, increasing food security.
Trade agreements, such as trade blocs, can benefit countries that struggle to provide enough food for its population.
Aid and relief can provide immediate food security – crucial after a crisis or natural disaster.
Urban greening / urban farming:
Urban greening → the incorporation of green spaces and elements into urban environments and infrastructure.
Urban farming → the practice of cultivating crops, livestock, or types of food in an urban environment.
Can improve food accessibility for low-income and marginalised communities - initiatives may include community gardens, rooftop gardens, and urban farms specifically designed to serve low-income communities.
Helps increase the amount of locally grown food.
Strategies to ensure food security: increasing efficiency of food
Advertising campaigns and education:
Advertising campaigns → spreading awareness to help drive consumer demand for sustainable and healthy food options.
Educating farmers about crop loss prevention.
Better education about diet to tackle growing obesity crisis and malnutrition in the developed world.
Encouraging consumers to cook and buy only what they need and to donate leftovers to food banks.
Food production and agricultural changes:
Up-to-date equipment and better management can produce more crops in less time – helps affordability and availability of food.
Improving storage, packaging and refrigeration facilities to make food last longer.
Global patterns of health, mortality and morbidity
Mortality:
Mortality → the number of deaths per 1000 people over a given period of time.
It can be measured with the crude death rate, IMR and life expectancy.
Africa → crude death rates are highest – Sub-Saharan Africa being 11.8+ deaths per 1000 people – anomaly of North Africa with a death rate of 5 or lower.
Central America and Middle East quite low with rates ranging from less than 5.11 to 6.05.
Russia → Russia extremely high (11.8+), despite being a HIC.
Infant mortality → the number of infants that die per 1000 of the population.
Asia → continent with highest infant mortality rate, especially in Pakistan, Afghanistan and Laos – being 43+.
Overall, infant mortality is lower in HIC’s and higher in LIC’s.
Morbidity:
Morbidity → the rate of disease in a population.
Generally, non-communicable diseases are higher in HIC’s – whereas, biologically transmitted diseases are more prevalent in LIC’s.
Diseases influenced by lifestyle choices are more common in HIC’s e.g., lung cancer caused by smoking or poor air quality.
LIC’s without protective measures or poor sanitation lead to diseases like cholera or malaria e.g., Sub-Saharan Africa.
Health:
Health → your physical, mental and social well-being and not just the presence of disease.
Health is usually better in HIC’s compared to LIC’s – seen by morbidity rates of certain diseases in HIC’s than in LIC’s.
Life expectancy as an indicator – higher LE in HIC’s, usually due to higher spending on healthcare.
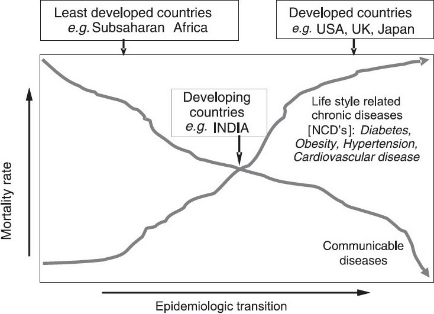
The epidemiological transition model
The epidemiological transition model → shows how disease and death changes, as a society becomes more socially and economically developed.
This idea was developed by Omran (1971) and he divided the transition into 3 distinct phases:
The age of infection and famine:
Mortality is high and fluctuates – prevents sustained pop. growth.
The cyclical low growth patterns are associated with wars, famine and epidemic outbreaks.
The age of receding pandemics:
The rate of mortality declines as disease epidemics occur less frequently.
Population growth is sustained and begins to rise exponentially.
Advances in technology and medicine.
The age of degenerative and man-made diseases:
Mortality continues to decline and eventually approaches stability at a relatively low level.
Infectious agents as the major contributor to morbidity and mortality are overtaken by anthropogenic causes.
Fertility becomes a more important contributory factor to population growth.
The epidemiological transition model changes
The theory was revisited in the 1980’s – Olshansky and Ault added a 4th stage:
The age of delayed degenerative diseases → death rates are concentrated at advanced ages e.g., dementia.
There are assumptions the world may be moving to a 5th stage, potentially could be:
The age of inactivity and obesity → risk behaviours will be ignored, especially in HIC’s and lack of exercise will become more prevalent – increasing obesity at an alarming rate.
The emergence / re-emergence of communicable diseases → globalisation increasing disease diffusion by travel as well as concerns about vaccines.
Social and economic developments improving health
Social:
Improved awareness of the importance of hygiene.
Better education about sanitation and disease transmission.
Advances in medical technology e.g., antibiotics and vaccines.
Better training for doctors, nurses and midwives.
Aid programmes from the UN or NGOs to improve healthcare facilities.
Economic:
Technology to improve food productivity and supply e.g., the Green Revolution.
Improved transport infrastructure to distribute food and medical supplies.
Investment in drainage and sewage systems, especially in urban areas.
Trading of resources or manufactured goods in exchange for a wider variety of foods and medicines.
The relationship between environment variables and incidence of disease: climate
High temperatures and access to water bodies → optimum condition for vector-borne diseases and mosquito survival e.g., diseases like Malaria common in the tropics.
Seasons affect mental health → seasonal affective disorder (SAD) where episodes of depression occur at the same time each year i.e., common during the winter where it has been linked to reduced exposure to sunlight during shorter days.
Substances in the air → can aggravate hay fever or asthma during the spring and summer when the body reacts to pollen and dust etc. in the air.
Low temperatures in temperate winters → airborne respiratory diseases e.g., influenza, common when conditions are damp and relatively cold – vulnerable for elderly and young children with weaker immune systems.
Excessive rainfall → can cause sewage system outflow, contaminating water – leads to outbreaks of viral diseases e.g., norovirus and bacterial infections e.g., cholera.
Climate change → increasing incidence of disease – increasing global temperatures create more spaces for the spread of disease vectors into new regions.
The relationship between environment variables and incidence of disease: topography (drainage)
Flat low-lying land → areas with high rainfall increases risk of flooding – contaminate freshwater supplies, increasing rate of diarrhoea, typhoid, and respiratory infections e.g., common in many low-income countries of Asia.
High exposure to sunlight → areas with strong UV rays, from varying latitudes, increases risk to cancers e.g., Australia has the highest skin cancer rates in the world.
Low exposure to sunlight → lack of sunlight can cause deficiencies of vitamin D – has knock on effects, leading to bone pain, muscle weakness and rickets e.g., Aboriginal Arctic population are the most severely affected.
Air quality and health
According to the WHO, 99% of the population live in areas of unsatisfactory air quality.
Outdoor air pollution:
Outdoor (ambient) air pollution cause illness and death globally, especially in urban areas where these pollutants are concentrated.
Natural causes to this pollution → forest fires, dust storms and volcanic eruptions.
But anthropogenic activities are a larger contributor, sources include:
Fossil fuel combustion → from motor vehicles, heat and power generation.
Industrial facilities e.g., manufacturing factories, mines and oil refineries.
Waste sites or waste burning.
Slash-and-burn farming techniques.
Household air pollution:
Household air pollution is also caused by anthropogenic activities:
The burning of polluting fuels inside households which are not properly ventilated – reasons with why household air pollution is concentrated in LIC’s, as housing standards are lower.
Heating food within homes → can release smoke, carbon monoxide and sulphur dioxide.
Non-combustion related pollutants → include mold, and building materials e.g., asbestos.
More than 50% of premature deaths due to pneumonia among children under 5 are caused by the particular matter (soot) inhaled from household air pollution.
Example:
“Living in Delhi is comparable to smoking 20 cigarettes a day”.
As the economy grows, new industries and car travel pollutes the environment.
Changing policies of rice farming in Haryana, means farmers have less times to prepare the fields – so they burn the fields, creating huge clouds of smoke that travel to Delhi.
Water quality and health
Unsafe water is responsible for 1.2 million deaths each year.
2.1 billion (29% of the world) do not have access to safe drinking water.
Affects health:
Lack of access to safe water sources is a leading risk factor for infectious diseases e.g., cholera, diarrhoea, dysentery, hepatitis A, typhoid, and polio - diarrhoea is the second leading cause of death in children under 5 globally.
Limited access to clean water in LICs – the same water is used for dumping human waste, cleaning themselves, cleaning livestock, washing up and even drinking.
High number of pathogens → enter the body through open wounds or accidental ingestion when bathing/ eating from dirty washed items.
Human activities worsening the problem → factories may dump toxic waste into water supplies, or insecticides/ pesticides can enter water supplies after rainfall.
E.g., Isnapur Lake in Hyderabad, India – located near several large drug factories.
Role of international agencies in promoting health and combatting disease: WHO
World health organisation WHO (UN agency 1948):
Shaping the research agenda and stimulating the generation of valuable knowledge – allows for education of health and disease to be spread worldwide.
Disease surveillance and response → monitors global health threats e.g., COVID.
Support for health systems → work with governments to strengthen healthcare infrastructure, especially in LICs.
Role of international agencies in promoting health and combatting disease: FAO
Food and agriculture organisation FAO (UN agency 1945):
Sustainable agriculture → supports climate-resilient farming techniques.
Disease control in agriculture → monitors and combats animal-borne diseases that can affect human health e.g., mad cow disease (can lead to brain damage).
Policy and research → advises governments on food systems and nutrition policies.
Role of international agencies in promoting health and combatting disease: World food programme
World food programme (UN agency 1961):
School meals programmes → supports education and child nutrition by providing school meals.
Cash and food vouchers → helps vulnerable populations buy nutritious food locally.
Emergency food aid → provides immediate food relief in famine, conflict, and disaster zones e.g., Yemen, Sudan.
Role of NGOs in promoting health and combatting disease: Oxfam
Oxfam (1942):
Water, sanitation and hygiene (WASH) → improves hygiene and sanitation to prevent disease e.g., cholera prevention.
Advocacy and policy influence → campaigns for healthcare funding and fair access to medicines.
Long-term development → works to improve healthcare infrastructure and poverty reduction.
Role of NGOs in promoting health and combatting disease: World vision
World vision (1950):
Maternal and child health → provides nutrition programs and medical care for mothers and children.
Infrastructure development → builds wells and sanitation facilities to prevent waterborne diseases.
Food security and nutrition → supports school feeding programs and agriculture projects.
Role of NGOs in promoting health and combatting disease: The Bill and Melinda Gates foundation
The Bill and Melinda Gates foundation (2000):
Vaccine development and distribution → funds research and provides vaccines for diseases like polio, malaria, and COVID-19.
Disease removal → e.g., invested over $5 billion in the Global Polio Eradication Initiative, helping reduce polio cases worldwide.
Partnerships with governments and NGOs → collaborates with WHO, UNICEF, and other organizations to improve global health.
Factors in natural population change: demographic transition model
The demographic transition model → describes how, as countries develop, changes in birth and death rates subsequently affect population.
Stage 1 → high, fluctuating BR and DR – due to high levels of disease, famine and virtually non-existent birth control – population is low e.g., some tribal communities.
Stage 2 → fall in DR – due to societal developments and advancements in healthcare and hygiene – BR still high and so a rapid increase in population e.g., Yemen, Iraq.
Stage 3 → BR start to fall – due to recognised women’s rights, contraception, reduced need for large families and education about societal values e.g., India.
Stage 4 → low BR and DR – population growth slows e.g., UK.
Stage 5 → proposed stage, BR fall below DR – declining population e.g., Germany.
Factors in natural population change: key vital rates
Vital rates → show how the most important (vital) aspects of the population change, and the speed at which they change (rate).
Birth rate → number of live births per 1000 of the population per year.
Death (mortality) rate → number of deaths per 1000 of the population per year.
Infant mortality rate → number of deaths of infants under the age of 1 per 1000 live births per year.
Total fertility rate → the average number of children a mother will birth in her reproductive age.
Population growth rate → % change in a year – if BR > DR % change is positive, of DR > BR % change is negative.
Life expectancy → average number of years someone is expected to live for.
Factors in natural population change: age-sex composition
Age and sex → 2 major demographic variables – indicate a country’s level of development.
Age-sex composition is shown on population pyramids for each stage of the DTM.
Factors in natural population change: cultural controls
Cultural controls that increase fertility and birth rates:
Gender → some rural parts of LICs e.g., Niger, prefer male children, so they can contribute more to family income – more births as parents keep having children until they have more than one boy.
Marriage traditions → the younger a woman marries, the more children she is likely to have – in Niger, 75% of girls marry before the age of 18, and the fertility rate was 6.9 in 2020 (one of the highest rates in the world).
Religion → faiths like Roman Catholicism oppose contraception – no prevention in pregnancies.
Cultural controls that reduce fertility and birth rates:
Political policies → governments concerned about overpopulation can introduce policies of population control e.g., China operated a ‘one-child policy’ from 1979-2015.
Models of natural population change, and their application in contrasting physical and human settings: DTM
Demographic transition model → describes how, as countries develop, changes in birth and death rates subsequently affect population.
Strengths:
Universal application → can be applied to all countries at different development levels.
Pattern explanation → help understand why birth and death rates change over time.
Useful for policy planning → governments can predict future population issues – using stage 5.
Weaknesses:
Western bias → based on Western Europe’s experience and assumes all countries follow the same path.
Ignores migration → only looks at natural increase, but many countries experience population change due to migration.
Doesn’t consider human intervention → government policies e.g., China’s One-Child Policy, can alter population trends.
Concept of the Demographic Dividend
The demographic dividend → how when a country’s dependency ratio falls quickly it goes through a period of fast economic growth.
Dependency ratio → a measure of the proportion of dependents aged 0-14 and over 65, compared with the total population aged 15-64 (economically active).
Young dependents → from 0-14 years, they rely on their economically active parents to support them.
Economically active → from 15-64 years, they are the working population who earn income, pay taxes and contribute to the support of the young and elderly.
Elderly dependents → from 65 years onwards, they are no longer economically active and so rely on support from the state and younger family members.
Dependency ratio = (young dependents + old dependents) / working population.
Why will the DD not last forever → fertility must decline substantially to achieve DD which may be hard to maintain in a country in the long-term – and the current population with a low dependency ratio may change as they age and now become dependent on the government e.g., pension.
Example of demographic dividend: Thailand
Investments into voluntary family planning to lower the birth rate, Thailand’s contraceptive use has increase – from 15% in 1960 to 79% to 1987.
The fertility rates declines – from 6.5 children per women in 1960 to 1.46 by 2023.
One way they’ve done this is by offering condoms outside restaurants.
This shifted the age structure of Thailand’s population, providing a critical first step toward achieving the economic benefits of a demographic dividend.
Dependency ratio distribution
Dependency ratio is very high in LICs in stage 2 of DTM:
Due to youthful population structure with many young dependents.
E.g., in Niger the figure was 105 in 2021 – means for every 100 people of working age, 105 economically inactive young and elderly depend on them.
Dependency ratio is high in HICs in stage 4 & 5 of DTM:
Due to a large elderly dependent sector of the population.
E.g. in Japan the figure was 57 in 2021.
Dependency ratio is lower in NEEs in stage 3 of DTM:
Due to fewer elderly dependents as previously, there was low life expectancy.
Also due to a small number of young dependents as birth rates are falling.
E.g. in Mexico the figure was 48 in 2021.
International migration: refugees, asylum seekers and economic migrants
International migration → the movement of people from one country / political state to another.
Refugees → people who have been forced to leave their homes and travel to another country due to fleeing conflict, political or religious persecution – similar to asylum seeker but with temporary/permanent residency.
2022 – present → millions fled Ukraine to Poland, Germany, and the UK due to the Russian invasion.
Asylum seekers → a person seeking asylum is forced to flee their country to another because of fear of persecution or for their safety at home – but their claim has not yet been approved.
2021 – present → after the Taliban takeover, many Afghans sought asylum in the UK, US, and Canada due to threats to their safety.
Economic migrants → people who have moved voluntarily for reasons of work and improved quality of life.
1990 – present → many skilled Indian workers migrate for high-paying tech & IT jobs, particularly in Silicon Valley and London.
Socio-economic causes of migration
Job opportunities → ability for better salaries to help improve living standards.
Healthcare and education → families move to countries with better schools and hospitals for their children’s future.
Conflict and war → armed conflicts destroy homes, infrastructure, and economies, making return impossible.
Globalisation → demand for skilled workers in fields like technology and finance leads to high-skill migration.
Environmental causes of migration
Climate change → rising global temperatures cause extreme weather and changing rainfall patterns – making some areas completely uninhabitable.
Natural disasters → affected areas may take years to recover, leaving people permanently displaced.
Industrial pollution → air and water pollution from industries cause health problems, reducing quality of life and forcing migration.
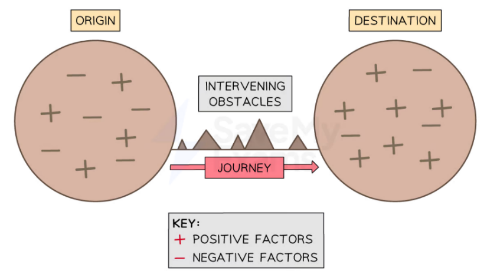
Processes of migration
Lee’s push-pull model of migration (1966) suggests there are push and pull factors within the origin country and the destination country.
E.g., higher wages, high standards of education, more job opportunities etc.
Another element are the intervening obstacles that prevent or make it difficult to migrate to another country.
E.g., transport difficulties, passport/visa requirements or lack of money to migrate.
Demographic implications
Country of origin:
Migrants often of child-bearing age – so birth rates fall.
Population decline.
Ageing population left behind which can increase death rates.
Loss of workforce.
Country of destination:
Increase in birth rates.
Population growth.
Can balance an ageing population structure.
Increases population of working age.
Social implications
Country of origin:
Less pressure of services such as healthcare and education.
More jobs available in some industries that migrants have vacated.
Migrants may return with new cultural awareness.
Family dislocation.
Loss of traditions
Country of destination:
New cultures can bring tolerance and new experiences.
Dilution of local cultures and traditions.
Grouping of migrants in urban areas can lead to segregation and intolerance.
More pressure on social services, jobs and housing.
Economic implications
Country of origin:
Migrants send newly earned money home in the form of remittances – can be an important contributor to the economy.
Returning migrants bring new skills to the workplace.
A ‘brain drain’ in some industries as skilled workers move abroad – productivity in the economy may fall with a reduced workforce.
Less investment in services with fewer people using them.
Country of destination:
Gaps in the workforce, both skilled and unskilled, filled by willing migrants – increased workforce leads to rise in economic productivity and subsequent development.
Requirement for more housing and other services leads to creation of more jobs – but extra cost of having to provide more services and housing to migrants.
Wages driven down and possible unemployment for local workers by competition from migrants.
Money leaks out of the economy through remittance payments.
Environmental implications
Country of origin:
Less pressure on natural resources and land.
Dereliction of abandoned communities.
Country of destination:
Migrants may bring new knowledge of sustainable land management techniques.
More pressure on natural resources and land.
More pollution and deforestation.
Health implications
Country of origin:
Healthcare resources can be spread more widely as fewer people requiring treatment.
Older migrants vulnerable to degenerative (non-communicable) diseases retiring abroad.
Higher proportion of more medically vulnerable population (very young and very old) left behind
Country of destination:
Migrants bringing new skills and ideas to the healthcare workforce.
Infectious (communicable) diseases can be spread more easily leading to more pressure on destination health services.
Older immigrants requiring treatment for degenerative (non-communicable) diseases.
Refugees and asylum seekers likely to need support and treatment for physical and mental illness due to traumatic journeys.
Political implications
Country of origin:
Governments may need to implement policies to increase birth rates (so called pro-natal policies).
Pressure on government resources to address all the negative impacts of out-migration.
Country of destination:
Pressure on governments to control immigration so that it has more positives than negatives.
Growth of anti-immigrant feeling and racial extremism needs to be dealt with.
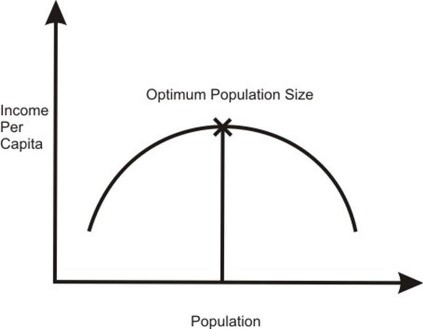
Population growth dynamics. Concepts of overpopulation, underpopulation and optimum population:
Overpopulation → too many people to be supported by the environment and its resources e.g., Mali
Underpopulation → too little people to fully utilise the environment and its resources e.g., Canada, Australia.
Optimum population → the ideal number of people for the environment and its resources.
These concepts are not necessarily concerned with how many people there are, but rather how many resources there are in order to support the people.
It’s important to consider that a densely populated area doesn’t mean that it’s overpopulated, if there are enough resources to support the population.
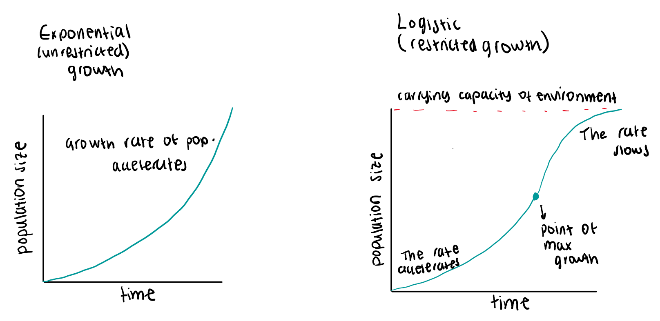
Population growth curves
Implications of overpopulation
Food and water shortages → increased demand leads to famine, malnutrition, and water scarcity.
Unemployment and poverty → more people competing for jobs results in lower wages and economic instability.
Overcrowding and housing crises → high population density strains urban infrastructure.
Environmental degradation → deforestation, soil erosion, and water pollution increase due to overuse of resources.
Political instability and conflict → resource competition can lead to civil unrest and migration pressures.
High expenses → excess demand leads to inflation of property prices and goods.
E.g., Nigeria’s rapid population growth (223 million in 2023) – led to high unemployment, slum expansion, and food insecurity.
Implications of underpopulation
Labour shortages → not enough workers to sustain economic growth, leading to economic stagnation.
Ageing population and high dependency ratios → fewer young people to support the elderly, straining healthcare and pensions.
Underutilised resources → industries and infrastructure may be left unused or unprofitable.
Reduced innovation and productivity → fewer workers result in a slower economy and less technological advancement.
Less tax revenue from people and their spending.
Hard to defend the country – lack of military.
Reduced FDI and attraction of migrants.
E.g., Japan’s declining population (expected to drop below 100 million by 2050) – leads to worker shortages and an ageing crisis.
Carrying capacity
Carrying capacity the maximum population that can be supported in an environment without the environment being severely degraded.
If the carrying capacity is reached, it can have effects on the population – resources are no longer available to support the population.
This is thought to lead to increase in death rates and fall in birth rates until population numbers can be supported again.
E.g., famines due to lack of food, causing deaths and lower fertility rates.
Factors that affect carrying capacity:
Size of the population
Level of resource consumption
Technological innovation
Level of wealth
Wealthier countries usually have a larger carrying capacity than poorer countries:
They export waste to poorer countries.
They import products from poorer countries.
This means that although poorer countries use fewer resources, they are supporting the resource use of the richer countries.
Ecological footprint
Ecological footprint → a measurement of how much of the Earth’s resources are used in relation to the amount of the Earth’s resources that are actually available.
Ecological footprint is measured in global hectares (gha) → 1 gha = overall annual amount of resource use per hectare of productive area available.
If an Ecological Footprint is larger than 1 → consumption is larger than available resources on Earth – clearly unsustainable.
It is estimated that the global ecological footprint is 1.7gha – we are globally consuming 0.7 Earths per year more than is available.
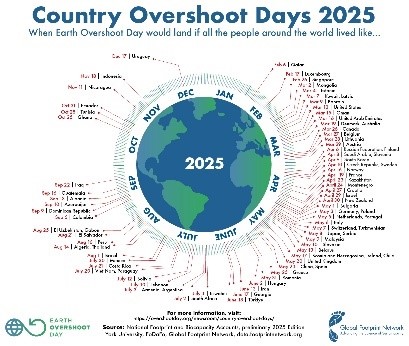
World overshoot day → marks the date when humanity's demand for ecological resources and services in a given year exceeds what Earth can regenerate in that year.
The days have gone slightly better, but high-income countries e.g., Qatar, have an earlier overshoot day.
Implications of carrying capacity and ecological footprint
As global demand for resources increases, the planet’s ecological footprint gets bigger and its carrying capacity gets smaller.
With population predicted to increase to around 9-10 billion by 2050, even more ‘Earths’ will be required unless more sustainable resource use strategies are put in place.
Destruction of ecosystems such as forests and coral reefs with knock-on effects of extinction of plant and animal species – issue of destruction and not consumption.
Climate change.
Changes of land use like industrial development – reducing of quality of fresh water and air.
Certain strategies to increase number of resources e.g., irrigation – leads to excessive irrigation = soil erosion and waterlogging which actually reduces the level resources anyway. Too far gone?
Population, resources and pollution model
PRP model → outlines how all organisms interact with their environment.
Adopts a systems approach i.e., a change in one variable will affect others.
Provides and insight into sustainable solutions e.g., encouraging renewable energy.
Uses the concepts of positive and negative feedback.
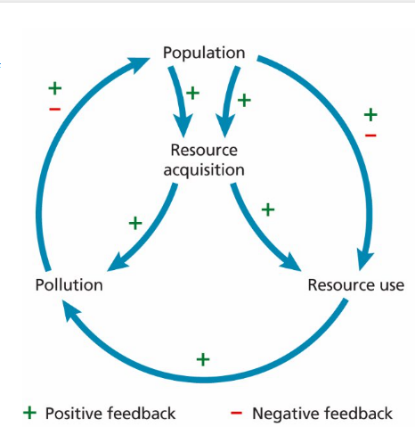
Population, resources and pollution model: positive and negative feedback
Positive feedback:
Positive feedback → when a change reinforces itself, making the situation worse or accelerating the trend.
Example:
Increased population leads to higher demand for resources.
Over-extraction of resources temporarily boosts supply.
More resources allow the population to grow further, creating even more demand.
E.g., Deforestation in the Amazon cutting trees increases land for farming, allowing more food production, which supports a growing population—leading to further deforestation.
Negative feedback:
Negative feedback → when a change triggers a response that counteracts the trend, stabilizing the system.
Example:
Overpopulation leads to resource depletion e.g., food shortages, water scarcity.
Food and water shortages lead to higher death rates and lower birth rates.
The population eventually declines or stabilizes, reducing demand on resources.
E.g., Ethiopia’s famine (1980’s) rapid population growth, combined with drought and poor resource management, led to food shortages and starvation, slowing population growth.
Contrasting perspectives on population growth and its implications
Different theories explain how population growth affects resources, economic development, and environmental sustainability.
Perspectives range from pessimistic (Malthusian, Neo-Malthusian) to optimistic (Boserup, Simon).
Malthusian theory Thomas Malthus 1798 (pessimistic)
Population grows exponentially (1, 2, 4, 8, 16...), but food production only grows arithmetically (1, 2, 3, 4, 5...).
Eventually, population will outstrip food supply, leading to famine, disease, and war – aka ‘Malthusian catastrophe’.
Natural checks e.g., starvation, conflict, would control population growth.
Implications:
Food insecurity and famine → fast population growth means agricultural production cannot keep up – leads to widespread hunger and malnutrition e.g., Irish Potato Famine in 1845 – crop failures and Malthusian pressures led to mass starvation.
Population control policies → governments may implement restrictive policies to slow population growth e.g., China’s one child policy until 2015.
Environmental degradation → population pressure may force people to overexploit land e.g., deforestation, soil degradation.
Social inequality and conflict → scarcity of resources may increase tensions over land, food, and water, leading to wars and migration e.g., some argue droughts and food shortages played a role in the Syrian civil war.
Criticism → ignores technological advancements in food production e.g., mechanised farming, fertilisers.
Neo-Malthusian theory 20th century (modern take on Malthus)
Population growth still threatens sustainability, but now includes concerns about resource depletion, pollution, and climate change.
Unlike Malthus, Neo-Malthusians focus on all resources, not just food e.g., water, energy, minerals.
Support family planning, contraception, and government intervention to limit population growth.
Implications:
Resource scarcity and knock-on effects → overpopulation could lead to water shortages, fossil fuel depletion, and food crises, causing economic instability e.g., California’s increased population and climate change led to water scarcity = economic strain on agriculture.
Climate change response → advocates reducing carbon footprints to slow environmental degradation.
Population controls → Neo-Malthusians advocate for contraception access, education, and government intervention to reduce birth rates.
Climate-induced migration → resource shortages and environmental degradation can lead to mass displacement and migration, affecting global stability e.g., Rohingya Refugee crisis where CC has increased migration pressures in Bangladesh.
Criticism → underestimates human innovation in developing renewable energy, sustainable agriculture, and recycling technologies.
Boserup’s theory Ester Boserup 1965 (optimistic)
Opposite of Malthus – as population grows, humans innovate to increase food supply.
Population pressure forces technological advancements e.g., irrigation, GM crops, mechanized farming.
“Necessity is the mother of invention.”
Implications:
Agricultural intensification → as populations grow, new technologies emerge to boost agricultural yields, preventing food shortages e.g., Green Revolution.
Increased investment in innovation → more people = larger workforce, greater demand for solutions – leads to economic growth and new technologies e.g., Singapore high-tech farming uses hydroponic and vertical farming to sustain food production.
Criticism:
Innovation is not guaranteed → some regions lack the resources or knowledge to implement new technologies.
Environmental costs → intensive farming can lead to soil depletion, deforestation and biodiversity loss.
Simon’s theory Julian Simon 1981 (most optimistic)
Human ingenuity (innovative and creative capacity) is the ultimate resource.
Population growth leads to more innovation, economic growth, and problem-solving.
Scarcity leads to higher prices, incentivising technological advancements and resource discovery.
Implications:
Resource substitution → as resources become scarce, humans develop alternatives e.g., renewable energy replacing fossil fuels.
Higher living standards → Population growth brings larger markets, more workers, and increased productivity – leads to long-term economic benefits.
Education/healthcare investments → Larger populations create demand for better education and medical services – leads to improvements in human capital e.g., Scandinavian countries’ investment in education creates high-skilled workforces.
Criticism:
Not all resources can be replaced → finite resources like fresh water, fertile soil, and biodiversity are essential for survival.
Ignores environmental degradation → economic growth often comes at the cost of pollution and habitat destruction.
Health impacts of global environmental change: ozone depletion – skin cancer
Ozone depletion
Ozone layer → a layer of gas that protects the earth from the Sun’s shortwave ultraviolet radiation (UVR).
In the 1980s scientists discovered the ozone layer thinning & holes above Antarctica & the Arctic – damage from chlorofluorocarbons (CFCs) from fridges & aerosols.
Skin cancer:
Increased exposure to UVR (ultra-violet rays) in humans are a health risk and can lead to increased rates of skin cancer.
Higher rates of melanoma skin cancer at higher latitudes e.g., in 2020, Australia had 37 incidences of skin cancer for every 100,000 population (compared to global average of 3.4 per 100,000 population).
Skin cancer is the 17th most common cancer worldwide.
Globally, cases of melanoma skin cancer are predicted to rise by 18% between 2018-2025.
Health impacts of global environmental change: ozone depletion – cataracts
Cataracts:
Cataracts are another health risk from UVR exposure – leads to blurred vision caused by the lens of the eye becoming cloudy.
Causes blindness in approximately 20 million people worldwide each year.
Factors increasing risk of skin cancer and cataracts
Geographic location:
Tropical areas have higher levels of UVR, but high latitudes can also be high risk due to less ozone protection.
More exposure in open spaces with reflective surfaces e.g., sand and snow.
Less exposure in urban areas as there is more shade.
Time of day:
Higher risk of exposure between 10am-2pm when the sun is most directly overhead.
Altitude:
At higher altitudes less atmosphere is available to absorb UVR.
With every 1000m rise in altitude, UVR levels increase by approximately 10%
But:
In the 1980’s, the CFCs were banned as a part of the Montreal Protocol – over 40 nations signed up.
Global warming has been helped with the banning of harmful greenhouse gases.
As a result, the ozone should recover by 2040 for the rest of the world, 2066 for the Antarctic, and 2045 for the Arctic.
Health impacts of global environmental change: climate change – thermal stress
WHO predicts that by 2050 climate change will be responsible for an extra 250,000 deaths worldwide each year.
Thermal stress:
Heatwaves increase risk of cardiovascular and respiratory diseases e.g., asthma – the heart and lungs work harder in extreme heat.
Very young and elderly most at risk – plus outdoor workers prone to high exposure.
Heat exhaustion and heatstroke body struggles to cool down, leading to dehydration, dizziness, and organ failure.
Mental health issues higher temperatures can cause stress, aggression, and increased suicide rates.
E.g., France launched Heatwave Action Plan including cooling shelters during 2003 heatwave – caused 70,000 deaths.
Health impacts of global environmental change: climate change – emergent and changing distribution of vector borne diseases
Emergent and changing distribution of vector borne diseases:
Warmer climates → expand breeding seasons and increase mosquito habitats to new regions.
Higher rainfall → more flooding creates stagnant water – optimum conditions for mosquito breeding.
Droughts force people to store and preserve water supplies – more breeding sites.
E.g., Malaria was once rare in high-altitude areas of Kenya – rising temps allow mosquitoes to survive at higher elevations.
Health impacts of global environmental change: climate change – agricultural productivity
Agricultural productivity:
Extreme weather damage crops → droughts, floods & hurricanes destroy farmland.
Pests & diseases spread faster due to warmer conditions.
Shifting precipitation patterns extend growing seasons in some areas and shorten in others.
Increased risk of starvation & food riots.
E.g., prolonged droughts in the Sahel region led to crop failures, high food prices and increased child mortality.
Health impacts of global environmental change: climate change – nutritional standards
Nutritional standards:
Lack of essential nutrients in food weakens immune systems – higher vulnerability to diseases.
Higher food prices make nutritious food unaffordable for low-income populations.
Stunted growth in children → irreversible brain & body development issues.
Higher maternal & infant mortality → malnourished pregnant women have greater risks of complications.
Rising ocean temperatures & acidification reduce fish populations e.g., tuna – more protein deficiency & loss of omega-3 fatty acids, crucial for brain function.
Prospects for the global population. Projected distributions
By 2080, persons aged 65 or older will outnumber children under 18 – according to UN
The world population will steadily rise to 11.2 billion by 2100 – according to UN
The population will peak at 9.7 billion in 2064 – according to IHME (institute of health metric and evaluation)
World population growth rate will continue to slow down – majorly due to fall in fertility rates.
Most rapid increases will in in Sub-Saharan Africa & continued population decline in Europe and Japan.
Global fertility rates will continue to fall (1960 = 5, 2023 = 2.3), by 2100 it could be less than 2 i.e., less than the replacement ratio (2.1).
Fossil fuels are finite, and are expected to run out in the future – replaced by renewables such as wind and solar.
The current population-environment relationship is not a sustainable one – by 2050, it is said there will be more plastic than fish.
As living standards rise and healthcare and medical science improve around the world, more and more children survive – means average life expectancy around the world is also increasing rapidly.
Drawback with predictions of population growth
Projections can only be based on presumptions – there will always be a degree of uncertainty.
Different theorists have different views.
Ongoing debate about whether population or consumption will be a more significant threat to the earth’s carrying capacity – but both are threats.
Main issue will be the sustainable supply of food, water and energy.
Critical appraisal of future population-environment relationships
Critical appraisal → a systematic process used to identify the strengths and weaknesses of a research articles in order to assess the usefulness and validity of research findings.
There’s an ongoing debate as to whether ‘population’ or ‘consumption’ is a more significant threat.