Ecology Final Exam
1/92
There's no tags or description
Looks like no tags are added yet.
Name | Mastery | Learn | Test | Matching | Spaced |
|---|
No study sessions yet.
93 Terms
Autotrophs
Primary producers that occupy the first trophic level
Primary Production
Production of biomass, organic matter, carbon, or fixation of energy by autotrophs
Units vary based on techniques used to measure
Common units: Biomass, Carbon, Energy
Net Primary Production
The amount of organic matter, carbon, or energy fixed by autotrophs after they have met their metabolic needs via respiration.
NPP = GPP - Respiratory losses (of autotrophs)
Net Primary Productivity
Net primary production expressed as a rate over time.
Measuring Primary Productivity
Estimate dry biomass produced by plants over a year
Could also estimate C% of this biomass
Could also estimate energy content of this biomass
Actual evapotranspiration increases with
Increased precipitation and temperature
Actual Evapotranspiration (ET)
Rate of water vapor lost from a system to the atmosphere typically expressed as an annual rate
Measured in milliliters of water per year
NPP increases with increased
Actual Evapotranspiration
Soil fertility (sometimes across small scales)
Grazing (to a medium level in some biomes)
Biome with high ET but low NPP
Wet and cold ecosystems, like tundras
Main limiting nutrients to NPP
Mostly Nitrogen but occasionally Phosphorus or other nutrients
Global Patterns of Marine NPP
Highest NPP rates in areas with high nutrient availability
Highest NPP rates found along continental margins due to runoff and upwelling
Trophic Cascade Hypothesis
Proposed by Stephen Carpenter
Top carnivores can have a large influence on NPP
Involves indirect interactions
Example:
Top carnivores feed on fish that feed on zooplankton.
Reducing plankton eating fish increases zooplankton populations
Large zooplankton populations reduce phytoplankton abundance, limiting NPP
Keystone Species Concept
Robert Paine
Certain organisms have large influences on ecosystems not proportional to their biomass
Bottom-Up Control
Lower trophic levels control higher levels by resource restriction
Example: Low nutrient concentrations limiting autotroph populations reduces higher trophic levels
Top-Down Control
Higher trophic levels control lower levels through predation
Examples: Keystone species and trophic cascade concepts
Large grazer effects on NPP in grasslands
McNaughton
Grassland NPP highest at medium grazing intensities due to compensatory growth, self shading, water/nutrient balance, etc.
Trophic Dynamic View of Ecosystems
Ray Lindeman
Organisms are grouped into trophic levels
Energy is lost as its transferred between trophic levels, decreasing with each successive trophic level
Often <90% of energy is lost when moving to a higher trophic level
Why most ecosystems don’t have more than five trophic levels
There’s not enough energy in lower levels to support high trophic level species
Ecosystems with > 5 trophic levels have high NPP
Why is primary production so important?
Dictates the amount of energy available to consumers
More NPP, more trophic levels
More trophic levels and biomass in trophic levels = more species and individuals
Areas of high NPP fix more carbon, produce more food, have higher species richness
Open System
Energy flows through the biosphere
Closed System
Nutrients Cycle through the biosphere
Volatile Nutrient Cycle
A large pool of the nutrient exists in a gaseous state
Carbon, Water, and Nitrogen Cycles
Sedimentary Nutrient Cycle
No large pool of the nutrient exists in a gaseous state
Phosphorus Cycle
Organisms affect the carbon cycle through
Photosynthesis and respiration
Gross Primary Productivity
All of the uptake of C (or energy/biomass) by primary producers. Includes what will be lost through metabolic processes.
Aboveground only, roots can’t photosynthesize
Soil Respiration
Respiration by soil organisms (microbes, macroinvertebrates) and plant roots
ANPP
Aboveground Net Primary Production
BNPP
Belowground Net Primary Production
Major Pools/Sinks of the Carbon cycle
Atmosphere (mainly CO2)
Land and food webs (producers, consumers, decomposers, detritivores)
Peat
Nitrogen Fixation
The conversion of N2 gas into usable forms for organisms
Nitrogen Fixers
Cyanobacteria
Free living soil bacteria
Bacteria/fungi in root nodules of some plants (legumes)
Converts N2 gas into ammonia/ammonium
Can be fixed by lightning
Available Nitrogen
The only forms of Nitrogen that can be taken up by plants
Ammonia or Nitrate ions
Animals secure their N compounds from plants or other animals
Nutrient Pools
Store nutrients
The amount of a particular nutrient stored in a portion or compartment of an ecosystem
Nutrient Source
A portion of the biosphere where a nutrient is released faster than it is absorbed
Nutrient Sink
A portion of the biosphere where a nutrient is absorbed faster than it is released
Nitrification
A process where bacteria converts ammonium to nitrate
Ammonification
A process where the decay of organic compounds releases N as ammonium
Denitrification
The conversion of N into atmospheric N2
Nitrogen escapes back into the atmospheric pool and must be fixed to re-enter the biotic pool
The Phosphorus Cycle
A sedimentary cycle
Large pool in marine sediments and mineral deposits
Enters the biotic pool by uplifting of marine sediments and erosion of mineral deposits
Plants take up Phosphate ions
P moves through food webs and may leech or be lost to runoff
Availability of Phosphorus to Plants
Dependent on soil pH and concentrations of other ions
Highest levels of dissolved phosphate occur at neutral (intermediate) pH levels
Mycorrhizae contribute to P uptake
Decomposition
The breakdown of organic material
Mostly focused on plant material
Dead plant material referred to as ‘litter’
Mineralization
Conversion of nutrients from complex organic forms to simpler forms that can be consumed by microbes or lost to the atmosphere
In the case of C, microbes release CO2 via microbial respiration
In the case of N, mineralized to forms usable by microbes and plants or lost to the atmosphere
Litter Decay Rate Determined By
Available moisture (ET/Precip increases decay)
Temperatures (Warmer temps increases decay)
Litter Quality (Lower lignin:N increases decay)
Litter Quality
Higher lignin concentrations slow decay
Higher N concentrations accelerate decay
Lignin:N ratio is a good predictor of litter quality
Lower ratio = faster decay
Higher ratio = slower decay
Litter Decay in Deserts
Much faster than expected, not due to lignin:N ratios
Caused by higher UV radiation (photodegredation)
Grazing and Nutrient Cycling
Grazers accelerate N cycle
N more quickly returned to the soil via grazer urine
Increases in nutrient loss
Disturbances (via runoff)
Forest clearcutting (N loss via runoff and streamflow of nitrate)
Succession
Gradual change in plant and animal communities following a disturbance
Primary Succession
Succession on newly exposed substrates lacking viable plants or seeds
Secondary Succession
Succession that occurs following a disturbance that does not destroy/remove all the soil
Pioneer Community
The first community of organisms to colonize an area following a disturbance. Typically referring to primary succession.
Climax Community
Late successional community that remains stable until disturbed again.
Seral Community
Any successional community other than the climax community
Primary Succession at Glacier Bay
Reiners et al
Changes in plant diversity during succession
Total number of plant species increased with plot age
Species richness increased rapidly in early years of succession and more slowly during later stages
Chronosequence approach
Glacier Bay Ecosystem Changes
Total soil depth and depth of all soil horizons increased from pioneer community
Organic content, moisture, and N content increased
Total biomass, community NPP and respiration increased
pH and P concentrations declined
Clement Mechanism of Succession
Facilitation
Connell and Slayter Mechanisms of Succession
Facilitation, Inhibition, and Tolerance
Facilitation
Pioneer species modify the environment to make it more suitable for species of later successional stages and less suitable for themselves
Inhibition
Pioneer species modify the environment to make it less suitable for themselves and later successional species.
Later successional species eventually dominate an area because they live longer and make conditions unsuitable for colonizers.
Secondary “old-field” succession
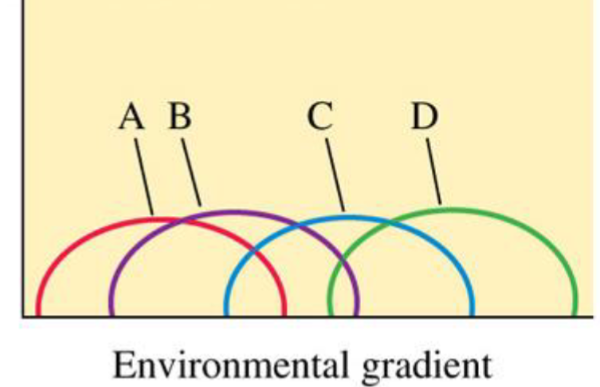
Clement’s Organismal View of Succession
AKA Discrete View
Development of vegetation occurs in a series of stages resembling the development of an organism
Not considered realistic
Importance of facilitation over exaggerated and inhibition ignored
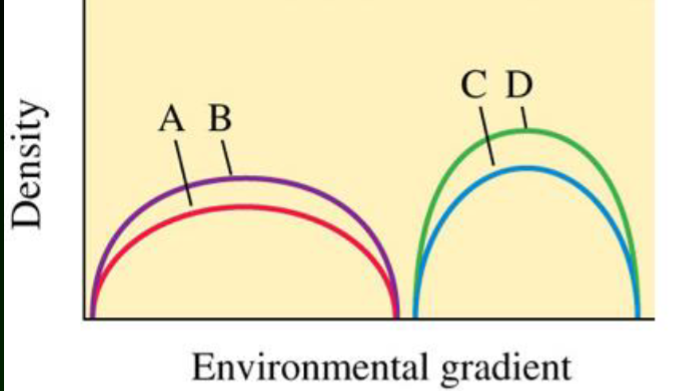
Gleason/Whittaker’s Individualistic View of Succession
AKA Continuum View
Groups of species coincidental
Plant communities composed of species that are each responding to the environment based on their individual characteristics
Buckwheat Succession on NM Cinder Cones
Facilitation
Nearly all plants establish next to existing buckwheat plants
Landscape
Heterogenous area composed of several communities
Landscape Elements
Visually distinctive patches in an ecosystem. Patches have characteristic size, shape, position, etc.
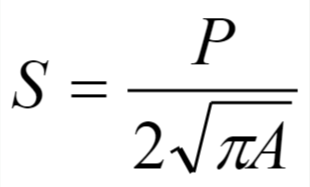
Ohio Landscape Case Study
Quantified patch shape by ratio of patch perimeter to perimeter of a circle with with an area equal to that patch
S = Patch shape
S = 1 is a circle, Increasing patch value = less circular shape
Higher S value = more edge per area
P = Patch Perimeter
A = Area
Ecotone
Edge or boundary between contrasting plant communities
Edge Effect
Species richness and diversity typically higher in ecotones
Ecotones support species from both ecosystems on either side, as well as some species unique to the ecotone
Fractal Geometry
Math quantifying structure of natural shapes
Perimeter size depends on ruler size
Smaller features only appearing with smaller ruler
As Patch Size Increases
Population size increases
Population density decreases
Corridors
Bridges connecting landscape patches
Increase densities by allowing migration, mitigating fragmentation
Example: Butterflies in South Carolina
Bajadas
Joe McAuillife
Sloping planes at the base of desert mountain ranges
Complex mosaic of distinctive plant communities not explained by elevation
Why are Bajadas so diverse?
Variability in soil textures
Differences in water infiltration during precipitation
McAuliffe Findings
Plant community distribution corresponding with soil age and structure
Highest plant diversity on young soils
Younger soils more coarse, have less calcium carbonate
Older soils accumulate more clay
Species richness on islands increases with
Increasing area
Decreasing isolation (distance from source)
Equilibrium Model of Island Biogeography
MacArthur and Wilson
Species richness on islands is a function of immigration and extinction rates
Immigration rate highest on new islands
Extinction rate increases with increasing number of species on the island
Habitat Islands
Mountaintops
Lakes
Marine Islands
Immigration rate on islands
Mainly influenced by an island’s isolation, or distance to a source
More isolation = less immigration
Extinction rate on islands
Mainly influenced by an island’s size
Larger islands have more resources, and lower extinction rates
Species Turnover on Islands
The equilibrium model is always changing
There is constant species turnover from migration and extinction, but they tend to balance out
Community compositions can vary greatly, but the species richness is relatively stable
Why is species richness higher at lower latitudes?
Main Hypothesis: Due to greater land area in the tropics
Other hypotheses
Uniform temperatures
Increased speciation
Favorableness
Environmental heterogeneity
Longer time since large-scale disturbance
Historical and regional influences on richness
Tree species richness higher in East Asia
Lower glaciation
Most temperate tree species evolved here
Tree species richness lower in Europe
glacial period caused more tree extinctions
East-West mountains a barrier to Southern migration
The Greenhouse Effect
Proposed by Svante Arrhenius in 1895
Longwave radiation trapped by gasses in the atmosphere, heating the earth
Radiation enters the atmosphere as shortwave, exits as longwave
Greenhouse Gasses in order of decreasing abundance
Water vapor (H2O)
Carbon Dioxide (CO2)
Methane (CH4)
Nitrous Oxide (N2O)
CFCs
Keeling Curve
Charles David Keeling
Measurements of CO2 on Mauna Loa beginning in 1985
Shows a clear rise in CO2
Shows annual oscillations
Plants pull in CO2 during the growing season
Suess Effect
14C a radioisotope not present in fossil fuels due to degradation
Low amounts of 14C in the atmosphere tell us that CO2 in the atmosphere is from fossil fuels
Ice Cores
Air bubbles trapped in ice show what the atmosphere was like when that ice formed, thousands of years ago.
Show a correlation between periods of high temperatures and high CO2 concentrations
General Circulation Models (GCM)
Models predicting past/future temps based on all known mechanisms
Natural forces alone don’t explain warming, anthropogenic forces must be accounted for
Net fluxes in photosynthesis and respiration dictate
How Carbon stocks in an ecosystem will change
Positive Feedback Loops
Ecosystems that release more carbon into the atmosphere, increasing global warming
Negative Feedback Loops
Ecosystems that absorb and store carbon from the atmosphere, decreasing global warming
Stratospheric Ozone
“good” ozone
Natural layer of ozone built up over billions of years
Filters much solar UV
Tropospheric Ozone
“bad” ozone
Result of byproducts of human emissions
Chlorofluorocarbons (CFCs)
Stable (long-lived) man-made compounds
Break down and release chlorine
Chlorine destroys good O3 in the stratosphere
Ozone depletion allows more UV-B radiation to reach earth’s surface
Are a greenhouse gas in the troposphere
Why are we concerned about UV-Bs?
Cancer/cataracts in humans
Stunted growth/DNA damage in many plants
DNA damage and reduced activity of many microbes