Advanced Research Methods
1/25
There's no tags or description
Looks like no tags are added yet.
Name | Mastery | Learn | Test | Matching | Spaced | Call with Kai |
|---|
No analytics yet
Send a link to your students to track their progress
26 Terms
Characteristics of a Factorial Design
Experiments with 2+ factors (IVs)
highlights how factors independently and jointly influence the DV
Notation of a Factorial Design
shows number of factors and their levels [2×3]
2 = level of factors
3= # of factors
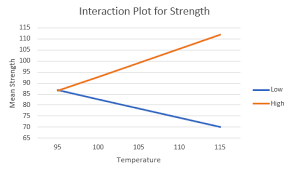
Interaction on a graph
Main Effects vs Interaction Effects
two factor study = evaluate three effects:
main effect of factor A
main effect of factor B
interaction between factor A & B
example:
pills - main effect= treat anxiety and panic disorder
alcohol - main effect= slows CNS, lowers inhibitions, etc.
pills+alcohol - interaction effect = potentially deadly
Applications of Factorial Designs
replicate and expand a previous study
reducing variance in between subject designs (two+ groups, difference manipulation for each)
evaluating order effects in with subject designs (one groups, all manipulations)
General Characteristics of Nonexperimental Research
Lacks the manipulation of an independent variable
differential research design (Between Subject)
compares preexisting groups to establish differences between them
“O” represents measurement; “X” represents treatment
Group 1: O
Groups 2: O
Posttest-only nonequivalent control group design (Between Subject)
Compares preexisting groups’ scores after treatment
Group 1: X O
Group 2: O
Pretest-Posttest design (Within Subject)
Compare scores for one group before and after treatment
Group 1: O X O
Threats to internal validity:
History, testing effects, maturation, regression to the mean
General Characteristics of Quasi-experimental Research
aims to establish a causal relationship
subjects are assigned to groups based on non-random criteria
Pretest-posttest nonequivalent control group design (Between Subject)
Compares two nonequivalent groups before and after treatment
Group 1: O X O
Group 2: O O
5. Time-series design (Within Subjects)
Measures participant scores in a series before and after treatment or event
Group 1: O O O X O O O
Threats to Validity
Extraneous Variables: variables other then the ones being studied
Control (minimizing)
hold variables constant
match value across condition
randomizing
Confounding Variables: extraneous variables which influence the results of the study
Cross-sectional Research
Compares groups of different ages
Example: compare 20 year olds, 30 year olds,
40 year olds to each other
Longitudinal Research
Compares same group as they age
Example: measure same group of individuals
across 10 years (20 years→ 30 years)
Goal of Correlational Research
Measure relationship between variables
No attempt to manipulate variables of interest or control extraneous variables
Strengths and Weaknesses of correlational research
Strengths:
Studies things that can’t be examined experimentally (not feasible or unethical)
High external validity
Weaknesses:
Can’t assess causality
Third-variable problem: Relationship between 2 variables is due to some other 3rd (unidentified) variable
Directionality problem: Unclear if a relationship between 2 variables is due to X causing Y or Y causing X
Low internal validity
Positive vs. Negative Relationships
Positive: Variables change in same direction
X increases, Y increases
X decreases, Y decreases
Negative: Variables change in opposite direction
X increases, Y decreases
X decreases, Y increases
Strength
Measured using Pearson’s correlation coefficient (r):
Sign (+/–) indicates the direction of the relationship
Numerical value (0.0–1.0) indicates strength
Weak r = ± .10
Medium r = ± .30
Strong r = ± .50
Almost perfect r = ± .80
Goal of Descriptive Research
Observe and describe variables as they naturally occur
Often used to begin to understand a topic that has not been previously researched
Descriptive Research Strategies
Observational Research: Researcher observes and records behavior of individual(s)
Survey Research
Case Study Research
Types of Observational Research
naturalistic: no researcher intervention
Strengths:
Behavior observed in the real world
Useful for nonmanipulated behaviors
Weakness:
Time-consuming
Potential for observer influence
Potential for subjective interpretation
participant: researcher interacts with participants and becomes one of them
Strengths:
When natural observation is impossible
Get information not accessible otherwise
Provides unique perspective
Weakness:
Time-consuming
May be less objective
Potential for observer influence
contrived (structured): researcher sets up a situation likely to produce the desired behavior in participants
Strengths:
Do not have to wait for a behavior to occur
Weakness:
Less natural
Strategies for Quantifying Observation
Frequency method: Count instances of each specific behavior
Duration method: Fixed-time observation
Interval method: Divide observation period into a series of intervals and record behavior during each interval
Techniques:
Time sampling: Record observations in intervals
Event sampling: Focus on one behavior at a time
Individual sampling: One participant at a time
Goal of Qualitative Research
Explores meaning / understanding of phenomena, experiences, perspectives, and constructed reality
Non-numerical data
Types of Qualitative Research
Data Collection Strategies
field notes: extensively detailed notes of studied event
interviews: individual conversation, semi-structured
focus groups: group interview
Typically 1 interviewer, 5-8 participants
Pro: More participants at once
Con: Participant (dis)comfort with discussing topics
Mixed Methods Research
Combines qualitative & quantitative approaches
Examples:
Qual → hypothesis generation, Quant → test hypothesis
Survey/interview with both quant and qual questions
Steps of the Scientific Method
make an observation
form a hypothesis
create a testable prediction
operationalize (systematically test the prediction)
analyze data & draw conclusions
communicate findings
repeat
Internal vs External Validity
internal validity: degree to which causal relationship between variables has a single, clear explanation - not explained by another variable
external validity: examines whether the study findings can be generalized to other contexts
How to develop an experiment to test a hypothesis
Define your variables. You should begin with a specific research question
Write your hypothesis.
Design your experimental treatments.
Assign your subjects to treatment groups.
Measure your dependent variable.
How to identify independent variables, dependent variables, and extraneous variables
independent variables: manipulated
dependent variables: measured
extraneous variables: unwanted/unaccounted for variable