MATH 1200 Exam 1
 Call Kai
 Learn
Learn Practice Test
 Spaced Repetition
 Match
Match Flashcards
 Knowt Play
1/122

Earn XP
Description and Tags
Cantains 1.1 to 4.2
Name | Mastery | Learn | Test | Matching | Spaced | Call with Kai | Chat |
|---|
No analytics yet
Send a link to your students to track their progress
123 Terms
Statistics
_________ is the science of collecting, organizing, summarizing, and analyzing information to draw conclusions or answer questions. In addition, statistics is about providing a measure of confidence in any conclusions.
Data
The information is _______, which the American Heritage Dictionary defines as “a fact or proposition used to draw a conclusion or make a decision.” Data can be numerical, as in height, or nonnumerical, as in gender.
Anecdotal
_________ means that the information being conveyed is based on casual observation, not scientific research.
Population
The entire group to be studied is called the _________.
individual
A(n) _________ is a person or object that is a member of the population being studied.
Sample
A(n) ________ is a subset of the population that is being studied.
Statistic
A(n) _______ is a numerical summary of a sample.
Descriptive statistics
___________ consist of organizing and summarizing data. _________ describe data through numerical summaries, tables, and graphs.
Inferential statistics
___________ uses methods that take a result from a sample, extend it to the population, and measure the reliability of the result.
parameter
A(n) _________ is a numerical summary of a population.
Variables
_________ are the characteristics of the individuals within the population.
Qualitative or categorical variables
__________ allow for classification of individuals based on some attribute or characteristic.
Quantitative variables
__________ provide numerical measures of individuals. The values of a(n) __________ can be added or subtracted and provide meaningful results.
Approach
Many examples in this text will include a suggested _______, or a way to look at and organize a problem so that it can be solved.
Discrete Variable
A(n) _________ is a quantitative variable that has either a finite number of possible values or a countable number of possible values. The term countable means that the values result from counting, such as and so on. A(n) __________ cannot take on every possible value between any two possible values.
Continuous Variable
A(n) _________ is a quantitative variable that has an infinite number of possible values that are not countable. A(n) ________ may take on every possible value between any two values.
Data Frame
A(n) _________ is a data structure that organizes data into a table in which each row represents an individual and the columns represent variables measured on each individual.
Nominal Level of Measurement
A variable is at the __________ if the values of the variable name, label, or categorize. In addition, the naming scheme does not allow for the values of the variable to be arranged in a ranked or specific order.
Ordinal Level of Measurement
A variable is at the ____________ if it has the properties of the nominal level of measurement; however, the naming scheme allows for the values of the variable to be arranged in a ranked or specific order.
Interval Level of Measurement
A variable is at the _________ if it has the properties of the ordinal level of measurement and the differences in the values of the variable have meaning. A value of zero does not mean the absence of the quantity. Arithmetic operations such as addition and subtraction can be performed on values of the variable.
Ratio Level of Measurement
A variable is at the __________ if it has the properties of the interval level of measurement and the ratios of the values of the variable have meaning. A value of zero means the absence of the quantity. Arithmetic operations such as multiplication and division can be performed on the values of the variable.
Explanatory Variable
In research, we wish to determine how varying the amount of a(n) __________ affects the value of a response variable.
Response Variable
In research, we wish to determine how varying the amount of an explanatory variable affects the value of a(n) __________.
Observational Study
A(n) __________ measures the value of the response variable without attempting to influence the value of either the response or explanatory variables. That is, in a(n) __________, the researcher observes the behavior of the individuals without trying to influence the outcome of the study.
Designed Experiment
If a researcher randomly assigns the individuals in a study to groups, intentionally manipulates the value of an explanatory variable, controls other explanatory variables at fixed values, and then records the value of the response variable for each individual, the study is a(n) __________.
Confounding
_______________ in a study occurs when the effects of two or more explanatory variables are not separated. Therefore, any relation that may exist between an explanatory variable and the response variable may be due to some other variable or variables not accounted for in the study.
Lurking Variable
A(n) __________ is an explanatory variable that was not considered in a study, but that affects the value of the response variable in the study. In addition, _________ are typically related to explanatory variables considered in the study.
Confounding Variable
A(n) _________ is an explanatory variable that was considered in a study whose effect cannot be distinguished from a second explanatory variable in the study.
Cross-sectional Studies
These observational studies collect information about individuals at a specific point in time or over a very short period of time. An advantage of _________ is that they are cheap and quick to do.
Case-control Studies
These studies are retrospective, meaning that they require individuals to look back in time or require the researcher to look at existing records. In __________, individuals who have a certain characteristic may be matched with those who do not.
A disadvantage to this type of study is that it requires individuals to recall information from the past. It also requires the individuals to be truthful in their responses. An advantage of __________ is that they can be done relatively quickly and inexpensively.
Cohort Studies
A(n) __________ first identifies a group of individuals to participate in the study (the cohort). The cohort is then observed over a long period of time. During this period, characteristics about the individuals are recorded and some individuals will be exposed to certain factors (not intentionally) and others will not. At the end of the study the value of the response variable is recorded for the individuals.
Typically, ________ require many individuals to participate over long periods of time. Because the data are collected over time, ________ are prospective. Another problem with _________ is that individuals tend to drop out due to the long time frame. This could lead to misleading results. That said, _________ are the most powerful of the observational studies.
Census
A(n) ________ is a list of all individuals in a population along with certain characteristics of each individual.
Web scraping or data mining
___________ is the process of extracting data from the Internet. ___________ can be used to extract data from tables on web pages and then upload the data to a file.
Random Sampling
_________ is the process of using chance to select individuals from a population to be included in the sample.
Simple Random Sampling
A sample of size n from a population of size N is obtained through __________ if every possible sample of size has an equally likely chance of occurring.
Frame
A(n) _______ is a list of all the individuals within the population.
Seed
The _______ is an initial point for the generator to start creating random numbers—like selecting the initial point in the table of random numbers.
Stratified Sample
A(n) _________ is obtained by separating the population into non-overlapping groups called strata and then obtaining a simple random sample from each stratum. The individuals within each stratum should be homogeneous (or similar) in some way.
Systematic Sample
A(n) __________ is obtained by selecting every kth individual from the population. The first individual selected corresponds to a random number between 1 and k.
Cluster Sample
A(n) _________ is obtained by selecting all individuals within a randomly selected collection or group of individuals.
Convenience Sample
A(n) _________ is a sample in which the individuals are easily obtained and not based on randomness.
Voluntary Response Sample
The most popular of the many types of convenience samples are those in which the individuals in the sample are self-selected (the individuals themselves decide to participate in a survey). These are also called ____________.
Bias
If the results of the sample are not representative of the population, then the sample has ______.
The word _______ could mean to give preference to selecting some individuals over others; it could also mean that certain responses are more likely to occur in the sample than in the population.
Sampling Bias
_________ means that the technique used to obtain the individuals in the sample tends to favor one part of the population over another. Any convenience sample has _________ because the individuals are not chosen through a random sample.
Undercoverage
Sampling bias also results due to ________, which occurs when the proportion of one segment of the population is lower in a sample than it is in the population. ________ can result if the frame used to obtain the sample is incomplete or not representative of the population.
Nonresponse bias
___________ exists when individuals selected to be in the sample who do not respond to the survey have different opinions from those who do. ___________ can occur because individuals selected for the sample do not wish to respond or the interviewer was unable to contact them.
Response Bias
_________ exists when the answers on a survey do not reflect the true feelings of the respondent.
Nonsampling errors
__________ result from undercoverage, nonresponse bias, response bias, or data-entry error. Such errors could also be present in a complete census of the population.
Sampling Error
__________ results from using a sample to estimate information about a population. This type of error occurs because a sample gives incomplete information about a population.
Frequency Distribution
A(n) __________ lists each category of data and the number of occurrences for each category of data.

Relative Frequency Distribution
A(n) _________ lists each category of data together with the relative frequency.
Bar Graph
A(n) ________ is constructed by labeling each category of data on either the horizontal or vertical axis and the frequency or relative frequency of the category on the other axis. Rectangles of equal width are drawn for each category. The height of each rectangle represents the category’s frequency or relative frequency.

Pareto Chart
A(n) _______ is a bar graph in which bars are drawn in decreasing order of frequency or relative frequency.

Pie Chart
A(n) ________ is a circle divided into sectors. Each sector represents a category of data. The area of each sector is proportional to the frequency of the category.

Histogram
A(n) ________ is constructed by drawing rectangles for each class of data. The height of each rectangle is the frequency or relative frequency of the class. The width of each rectangle is the same and the rectangles touch each other.

Lower class Limit
The smallest value within the class
Upper Class Limit
The largest value within the class
Class Width
The ________ is the difference between consecutive lower class limits.

Open Ended
A table is _______ if the first class has no lower class limit or the last class has no upper class limit.
Dot Plot
A(n) ________ is drawn by placing each observation horizontally in increasing order and placing a dot above the observation each time it is observed.
Uniform Symmetric
This graph is

Bell-shaped Symmetric
This graph is

Skewed Right
This graph is

Skewed Left
This graph is

Stem-and-leaf Plot
A(n) ________ is another way to represent quantitative data graphically. In a(n) _________ (or stem plot), use the digits to the left of the rightmost digit to form the stem. Each rightmost digit forms a leaf. For example, a data value of 147 would have 14 as the stem and 7 as the leaf.

Class Midpoint
A(n) _________ is the sum of consecutive lower class limits divided by 2
Frequency Polygon
A(n) _________ is a graph that uses points, connected by line segments, to represent the frequencies for the classes. It is constructed by plotting a point above each class midpoint on a horizontal axis at a height equal to the frequency of the class. Next, line segments are drawn connecting consecutive points. Two additional line segments are drawn connecting each end of the graph with the horizontal axis.

Cumulative Frequency Distribution
A(n) __________ displays the aggregate frequency of the category. In other words, for discrete data, it displays the total number of observations less than or equal to the category. For continuous data, it displays the total number of observations less than or equal to the upper class limit of a class.

Cumulative Relative Frequency Distribution
A(n) ___________ displays the proportion (or percentage) of observations less than or equal to the category for discrete data and the proportion (or percentage) of observations less than or equal to the upper class limit of a class for continuous data.
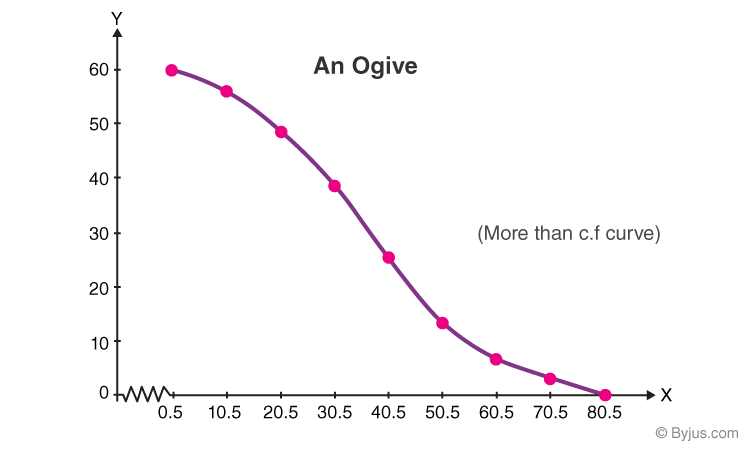
Ogive
A(n) _______ is a graph that represents the cumulative frequency or cumulative relative frequency for the class. It is constructed by plotting points whose x-coordinates are the upper class limits and whose y-coordinates are the cumulative frequencies or cumulative relative frequencies of the class. Then line segments are drawn connecting consecutive points. An additional line segment is drawn connecting the first point to the horizontal axis at a location representing the upper limit of the class that would precede the first class (if it existed).
Time-series Data
If the value of a variable is measured at different points in time, the data are referred to as _________.
Time-series Plot
A(n) ________ is obtained by plotting the time in which a variable is measured on the horizontal axis and the corresponding value of the variable on the vertical axis. Line segments are then drawn connecting the points.

Arithmetic Mean
The _________ of a variable is computed by adding all the values of the variable in the data set and dividing by the number of observations.
Population Arithmetic Mean
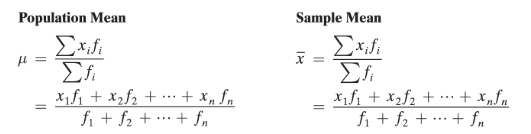
The _________, μ (pronounced “mew”), is computed using all the individuals in a population. The ________ is a parameter.
Sample Arithmetic Mean
The ________, x̄ (pronounced "x-bar"), is computed using sample data. The ________ is a statistic.
Mean
Although other types of means exist, the arithmetic mean is generally referred to as the _______.
Sample Mean
This equation is for

Population Mean
This equation is for

Median
The ______ of a variable is the value that lies in the middle of the data when arranged in ascending order. We use M to represent the median.
Resistant
A numerical summary of data is said to be ________ if extreme observations (very large or small) relative to the data do not affect its value substantially.
Yes
Is median resistant?
No
Is mean resistant?
Mode
The ______ of a variable is the most frequent observation of the variable that occurs in the data set.
Dispersion
_______ is the degree to which the data are spread out.
Range
The _______, R, of a variable is the difference between the largest and the smallest data value.
Range
This equation is for
R = largest data value - smallest data value
Standard Deviation
_________ is based on the deviation about the mean. For a population, the deviation about the mean for the ith observation is xi - μ. For a sample, the deviation about the mean for the th observation is xi - x̄. The further an observation is from the mean, the larger the absolute value of the deviation.
Population Standard Deviation
The ________ of a variable is the square root of the sum of squared deviations about the population mean divided by the number of observations in the population, N. That is, it is the square root of the mean of the squared deviations about the population mean.
Population Standard Deviation
This equation is for

Sample Standard Deviation
The _________, of a variable is the square root of the sum of squared deviations about the sample mean divided by n - 1, where is the sample size.
Sample Standard Deviation
This equation is for

Variance
The _______ of a variable is the square of the standard deviation.
Population Variance
σ2
Sample Variance
s2
The Empirical Rule
o If a distribution is roughly bell-shaped, then
o Approximately 68% of the data will lie within 1 standard deviation of the mean. That is, approximately 68% of the data lie between μ - 1σ and μ + 1σ.
o Approximately 95% of the data will lie within 2 standard deviations of the mean. That is, approximately 95% of the data lie between μ - 2σ and μ + 2σ.
o Approximately 99.7% of the data will lie within 3 standard deviations of the mean. That is, approximately 99.7% of the data lie between μ - 3σ and μ + 3σ.

Approximate Mean of a Variable from a Frequency Distribution
This equation is for
Weighted Mean
The ________, x̄w, of a variable is found by multiplying each value of the variable by its corresponding weight, adding these products, and dividing this sum by the sum of the weights.
Weighted Mean
This equation is for

Approximate Standard Deviation of a Variable from a Frequency Distribution
This equation is for

z-score
The _______ represents the distance that a data value is from the mean in terms of the number of standard deviations. We find it by subtracting the mean from the data value and dividing this result by the standard deviation.