CS301 Studying
1/232
Earn XP
Description and Tags
CS301
Name | Mastery | Learn | Test | Matching | Spaced |
|---|
No study sessions yet.
233 Terms
Q: What are the two types of statistics?
A: Descriptive statistics and inferential statistics.
Q: What is descriptive statistics?
A: It uses data to describe a population through numerical calculations, graphs, or tables (e.g., maximum, average, minimum).
Q: What is inferential statistics?
A: It makes inferences or predictions about a population based on a sample of data from that population.
Q: What is a key purpose of descriptive statistics?
A: Representation of data.
Q: What are the two main types of data?
A: Numerical data and categorical data.
Q: What are the two types of numerical data?
A: Continuous and discrete.
Q: What are the two types of categorical data?
A: Nominal and ordinal.
Q: What is continuous data?
A: Numerical data that can take any value within a range.
Q: What is discrete data?
A: Numerical data that takes specific, countable values.
Q: What is nominal data?
A: Categorical data with no inherent order.
Q: What is ordinal data?
A: Categorical data with a meaningful order or ranking.
Q: Give examples of nominal data.
A: Gender (Female, Male), Languages (English, French, Spanish).
Q: Give an example of ordinal data.
A: Educational background: 1 - Elementary, 2 - High School, 3 - Undergraduate, 4 - Graduate.
Q: What is discrete numerical data?
A: Numeric values that can only take certain distinct, countable numbers, such as integers.
Q: Give examples of discrete data.
A: Number of children in a family (0, 1, 2…), number of cars sold per day, shoe sizes (6, 6.5, 7).
Q: Give examples of continuous data.
A: Weight (52.3 kg, 52.35 kg…), Distance (3.2 miles, 3.25 miles…), Speed (60.5 mph, 60.55 mph…).
Q: What are the types of numerical data?
A: Discrete, continuous, interval, and ratio.
Q: What is interval data?
A: Continuous data measured along a scale with equal intervals between values, but with no true zero.
Q: Can ratios be meaningfully calculated with interval data?
A: No, ratios are not meaningful with interval data.
Q: Can addition and subtraction be meaningfully performed on interval data?
A: Yes, addition and subtraction are meaningful.
Q: Give an example of interval data.
A: Temperature in Celsius (0°C does not mean no temperature, and 20°C is not twice as hot as 10°C).
Q: What is ratio data?
A: Continuous data measured along a scale with equal intervals and a true zero.
Q: Can ratios be meaningfully calculated with ratio data?
A: Yes, ratios are meaningful (e.g., 20 kg is twice 10 kg).
Q: Give examples of ratio data.
A: Height, Weight (0 kg means no weight).
Q: What is an outlier? How is it Detected?
A: An extreme value in a dataset compared to all other values.Values more than 1.5×IQR above Q3 or below Q1 are considered outliers, where IQR = Q3 − Q1.
Q: Given the exam scores [40, 87, 88, 90, 95], which score is the outlier?
40
Q: What visualizations can help detect outliers?
A: Boxplots, scatter plots, and histograms.
Q: What impact can outliers have on data analysis?
A: They can distort means, standard deviations, regression models, etc., but sometimes contain important information (e.g., fraud detection, rare diseases).
Q: What does central tendency indicate in a dataset? What are the common measures of central tendency?
A: It tells the location or center of the data. Mean, Median, and Mode.
Q: What is the formula for the mean?
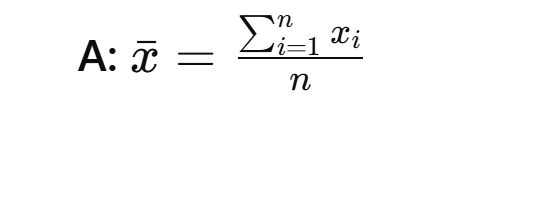
Q: What is the formula for the median? Is it affected by outliers?
A:
If n is odd: Median = value at position (n+1)/2(n+1)/2(n+1)/2 in the ordered dataset
If n is even: Median = average of values at positions n/2n/2n/2 and (n/2)+1(n/2)+1(n/2)+1 in the ordered dataset
A: No, the median is robust to outliers.
Q: What is the mode of a dataset and its properties?
A: The mode is the value that occurs most often in a dataset. It is not affected by outliers. A dataset can have one mode, multiple modes, or no mode.
Example: For the dataset [2, 2, 3, 7, 18, 18, 18, 18, 23, 23, 23, 31, 40], the mode is 18.
Q: When is each measure of central tendency most appropriate?
A:
Mean: Good for datasets without outliers.
Median: Good for datasets with or without outliers.
Mode: Good for categorical data.
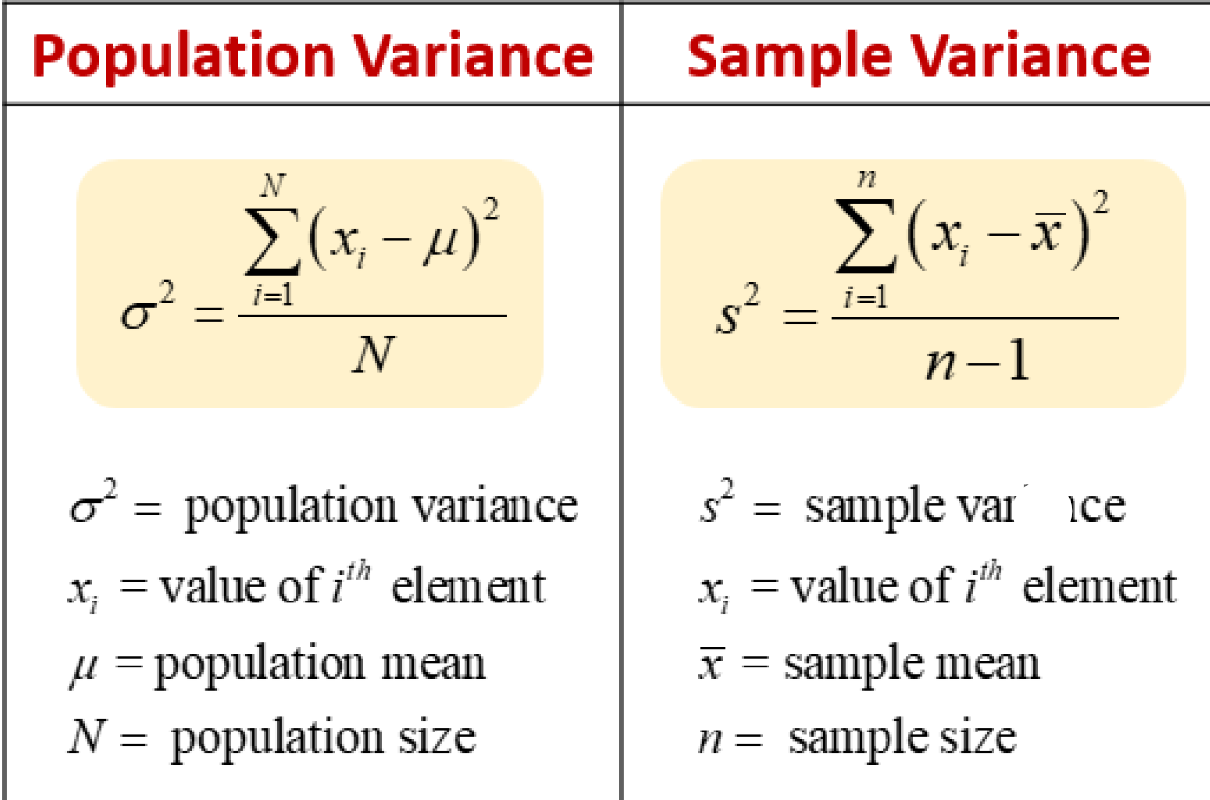
What is the formula for Variance? What is Variance’s Main Function?
Q: What is a population in statistics?
A: A collection of individuals, objects, or events whose properties are to be analyzed.
Q: What is a sample in statistics?
A: A subset of a population; a well-chosen sample contains most of the information about a particular population parameter.
Q: Why do data scientists often use sample variance instead of population variance?
A: Because they mostly deal with sample data rather than the entire population.
Q: How does sample variance generally compare to population variance?
A: Sample variance is usually greater than population variance.
Q: Why is the sample variance formula divided by n−1n-1n−1 instead of nnn?
A: Dividing by n−1n-1n−1 compensates for the lack of information about the population.
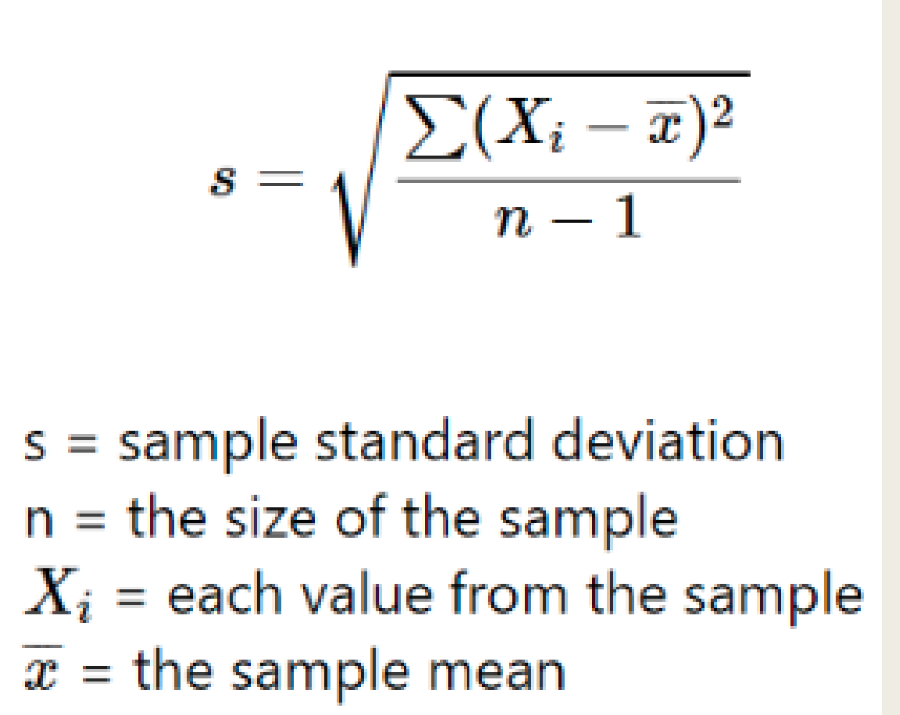
Q: Why is standard deviation used instead of variance?
A: Because variance values are often too large for visualization or comparison, so standard deviation provides a more interpretable measure.
Standard Deviation Formula
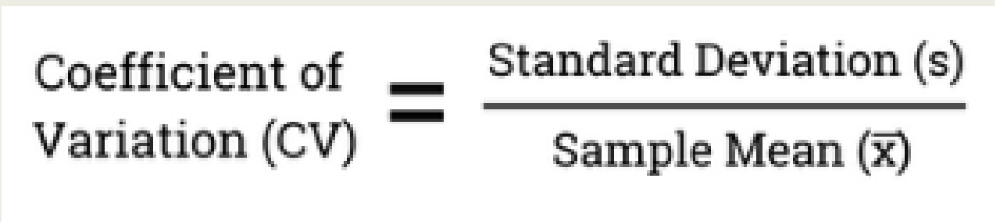
Q: What is the coefficient of variation (CV)?
A: It is a measure of the dispersion of data relative to its mean.
Q: When is the coefficient of variation useful?
A: When comparing the variability of two datasets.
Q: What does a smaller CV indicate?
A: The data is more stable and consistent, and the sample mean is a more precise estimate of the population mean.
Coefficient of Variation
Q: What is covariance?
A: It measures the directional relationship between two variables.
Q: What are the three types of covariance?
A:
Zero covariance: No relationship between the variables.
Positive covariance: If one variable increases, the other also increases.
Negative covariance: If one variable increases, the other decreases.
Q: Does covariance have a fixed range?
A: No, it can be any positive or negative number; the sign shows direction, and the magnitude depends on the data scale.
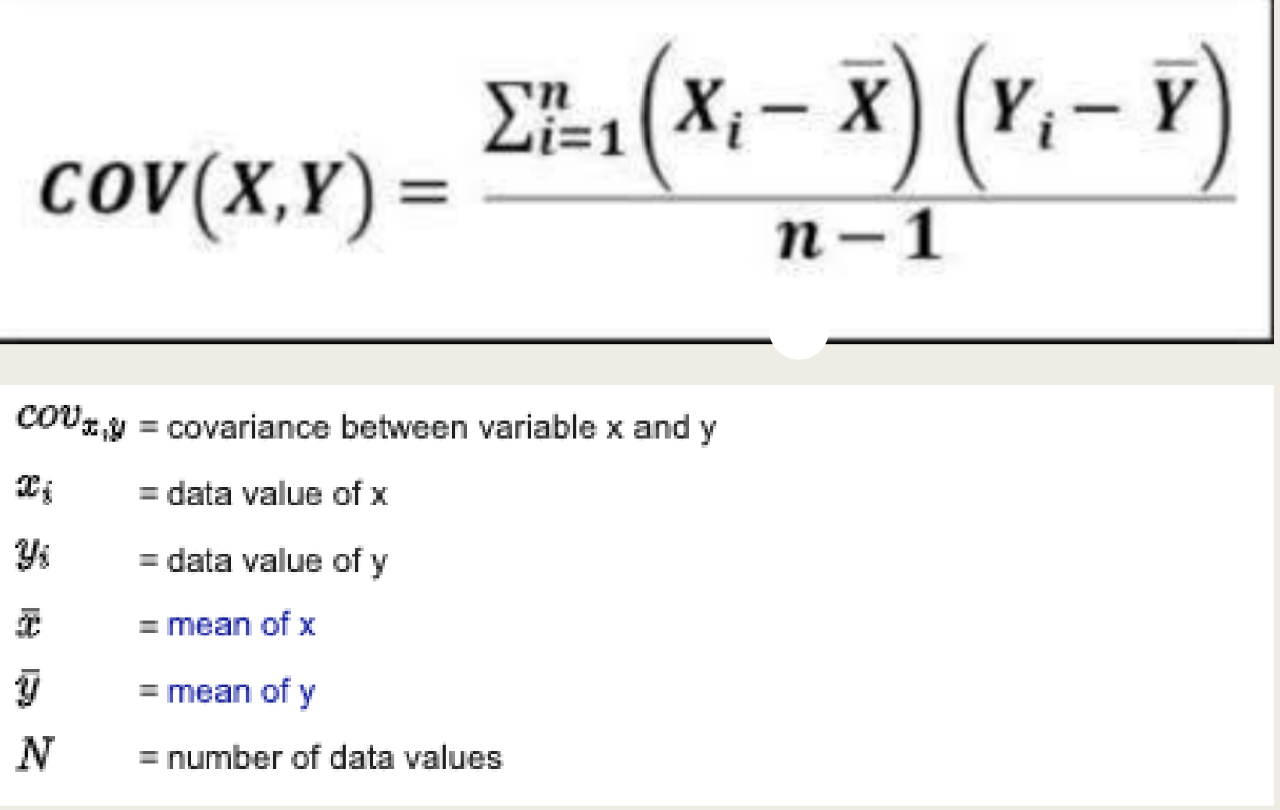
Covariance Formula?
Sample Covariance has n-1 as the denominator
Population Covariance is just N
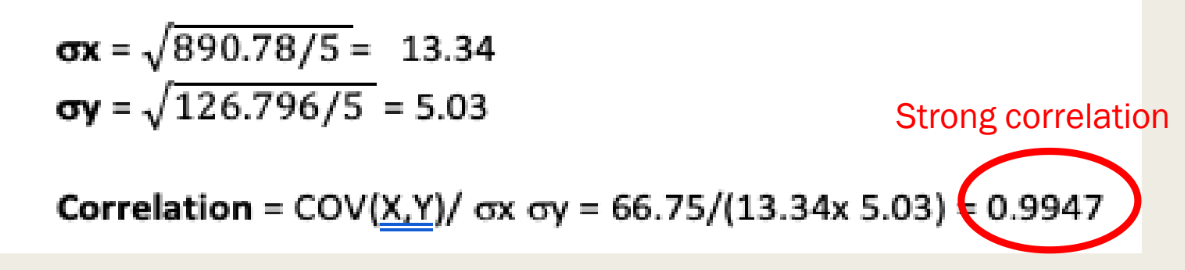
Q: What is correlation? What is the range? What does the values mean?
A: It measures the strength of the relationship between two variables, building on covariance which shows the direction. From −1 to +1. +1 is Perfect positive correlation (when X increases, Y always increases). −1 indicate Perfect negative correlation (when X increases, Y always decreases). r=0 indicate No linear relationship between the variables.
Q: What is the formula for correlation?
A: r = cov(X, Y) / (σ²ₓ · σ²ᵧ)
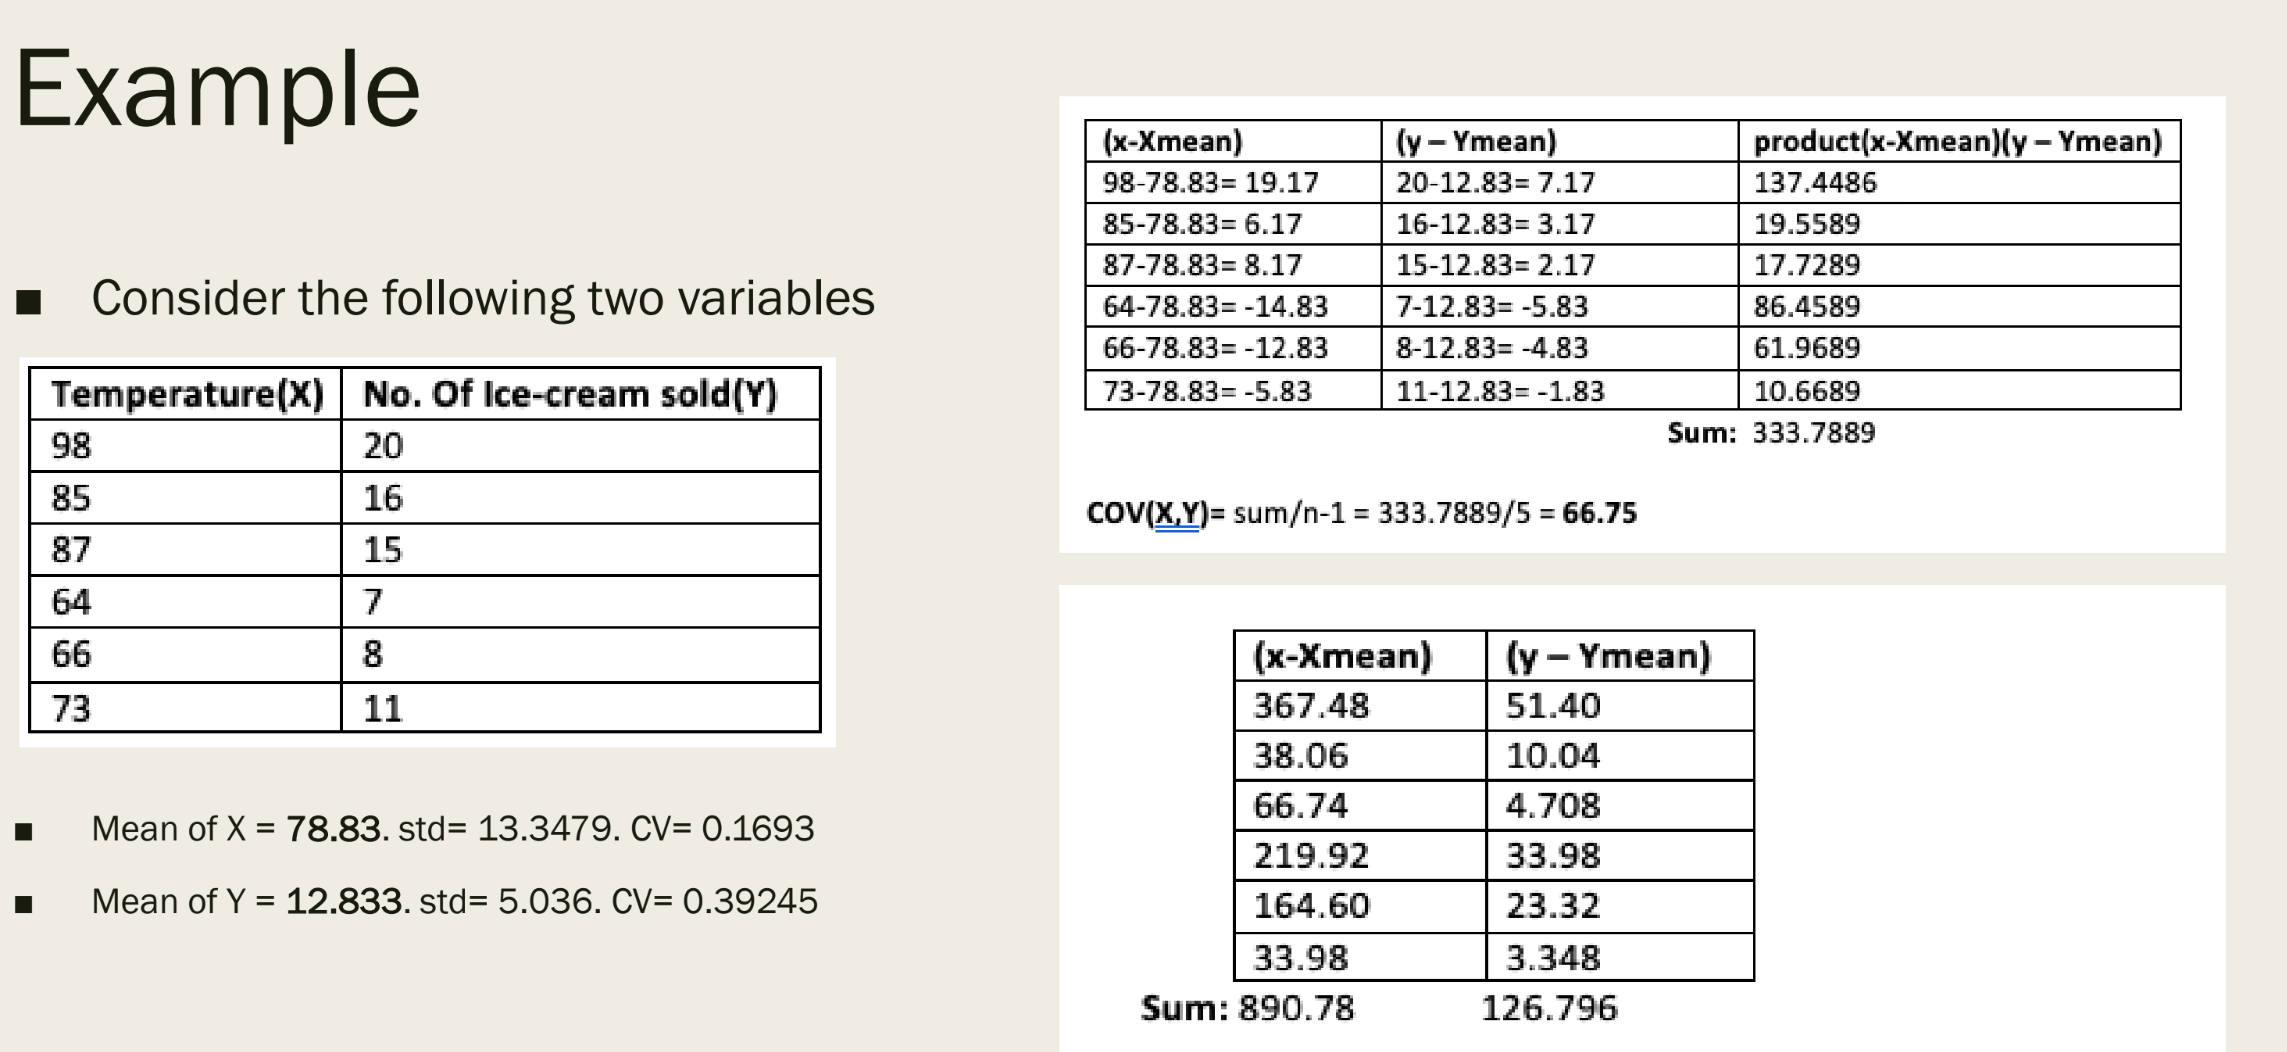
Calculate the Covariance of this dataset
Q: What is inferential statistics?
A: A branch of statistics that allows conclusions or predictions about a population based on a sample.
Q: What are the two ways to collect data?
A: Collect all the data or collect a sample from the data.
Q: What are the two main categories of sampling techniques?
A: Probability sampling and non-probability sampling.
Q: What are probability sampling techniques?
A: Random sampling, stratified sampling, and systematic sampling.
Q: Why is non-probability sampling considered less reliable?
A: Because it may introduce bias since not everyone in the population has a chance to be selected, even though it is easier and cheaper.
Q: What is simple random sampling?
A: A probability sampling technique where each individual has an equal chance of being selected.
Q: What is stratified sampling?
A: A probability sampling method where the population is divided into subgroups (strata) based on characteristics, and a random sample is taken from each group to ensure representation.
Q: What is systematic sampling?
A: A probability sampling technique where every k-th element is selected from a list after a random starting point.
Q: Give an example of systematic sampling.
A: Starting at student #1 in a class roster and then selecting students #6, #11, #16, #21, and #26.
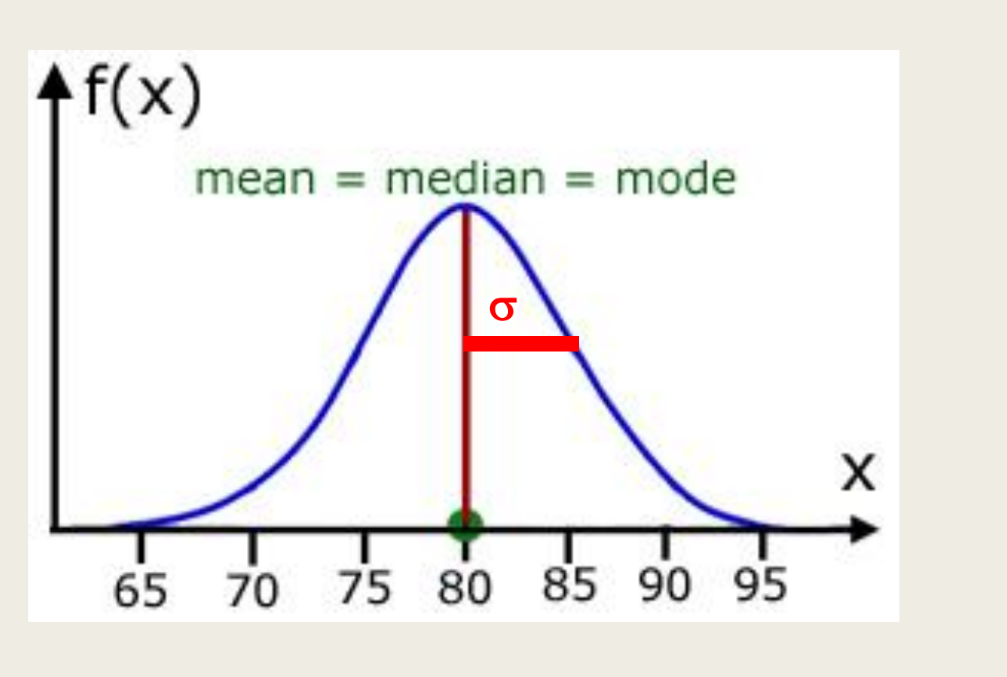
Q: What is a normal distribution?
A: A probability distribution also known as the Gaussian distribution, characterized by a bell-shaped curve where the mean, median, and mode are equal.
Q: What is the standard normal distribution?
A: A normal distribution with a mean of 0 and a standard deviation of 1.
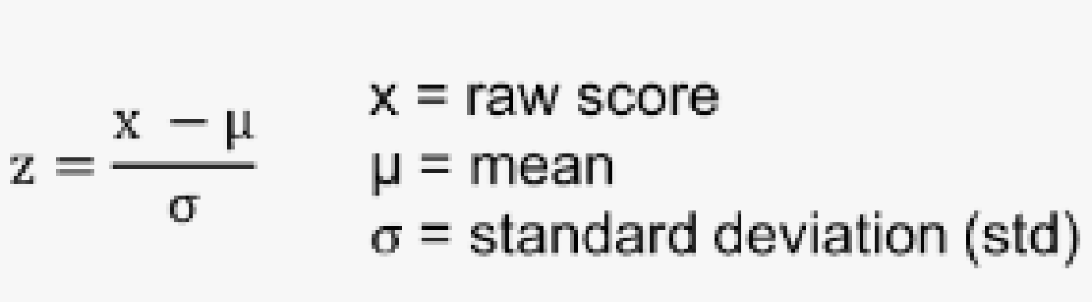
Q: What is a Z-score?
A: A standardized value that represents how many standard deviations a data point is from the mean, calculated as
Q: What is skewness?
A: A measure of asymmetry (imbalance) of a data distribution around the mean.
Q: What does it mean when data is skewed?
A: Data values are concentrated on one side of the distribution.
Q: What is positive (right) skewness?
A: A distribution with a long tail on the right side where extreme values are larger; Mean > Median > Mode.
Q: What is negative (left) skewness?
A: A distribution with a long tail on the left side where extreme values are smaller; Mean < Median < Mode.
Q: What is the difference between a population and a sample?
A: A population is the entire group of interest, while a sample is a smaller subset drawn from the population.
Q: Why are sample statistics commonly used in practice?
A: Because they are more convenient and practical than measuring the entire population.
Q: What does the Central Limit Theorem (CLT) state?
A: If many random samples of size n ≥ 30 are taken from any population, the sampling distribution of the sample mean will be approximately normal, regardless of the population’s distribution.
Q: How does the Central Limit Theorem apply in practice?
A: Even if the population distribution is skewed, the distribution of sample means from many samples of size 30 will be approximately normal.
Q: What happens to the average of sample means under the CLT?
A: It will be very close to the true population mean.
Q: Why is the Central Limit Theorem important for statistical methods?
A: Many tools (z-scores, t-tests, confidence intervals, hypothesis testing) assume normality, which is satisfied by the sampling distribution of the mean.
Q: Why is a sample size of n ≥ 30 commonly used in the CLT?
A: It is small enough to be practical and large enough for the CLT to usually hold.
Q: What does pandas do?
A: Pandas is a Python library used for data manipulation and analysis, providing tools to work with structured data such as tables (DataFrames), including cleaning, transforming, and analyzing data.
Q: What is correlation analysis used for?
A: It helps determine the relationship between numerical features.
Q: When should a feature be removed based on correlation?
A: If two features have high correlation (> 0.8), one may be redundant and should be removed; if a feature has low correlation with the target (< 0.1), it may not be useful.
Q: What is machine learning?
A: Machine learning is the science of getting computers to act without being explicitly programmed; it enables computers to learn from existing data to forecast future behaviors, outcomes, and trends.
Q: What are the general steps in a machine learning workflow?
A:
Problem Definition and Understanding
Data Collection
Data Preprocessing
Data Exploration and Visualization
Data Splitting
Model Selection
Model Training
Model Evaluation
Model Interpretation (Optional)
Deployment (Optional)
Documentation and Reporting
Continuous Improvement
Q: What is the difference between the traditional (rule-based) approach and the machine learning approach?
A:
Rule-based approach: Explicitly programmed to solve problems; decision rules are clearly defined by humans.
Machine learning approach: Trained from examples; decision rules are complex, fuzzy, and learned from data rather than defined by humans.
Q: What is the key summary of machine learning?
A:
Machine learning uses historical data to make predictions.
Unlike data mining, which discovers unknown patterns, machine learning applies previously learned knowledge to new data for real-life decision-making.
Computers approximate complex functions from historical data.
Decision rules are not explicitly programmed but learned from data.
Q: How do you determine if you need machine learning for a business problem?
A: Consider if you need to automate the task. Tasks that are high-volume, involve complex rules, or deal with unstructured data are good candidates.
Q: Give an example of a task suitable for machine learning.
A: Sentiment analysis of web reviews, which involves a high volume of unstructured text and complex human language.
Q: How do you formulate a business problem for machine learning?
A: Clearly define what you want to predict given which input, following the pattern: “given X, predict Y.”
Q: In sentiment analysis, what is the input and output?
A:
Input: Customer review text
Output: Sentiment (positive, negative, neutral)
Q: Why is having sufficient examples important for machine learning?
A: Machine learning always requires data; generally, the more examples, the better the model’s performance.
Q: What are the two parts each example must contain in supervised learning?
A:
Features: Attributes of the example
Label: The answer you want to predict
Q: Give an example in sentiment analysis.
A: Thousands of customer reviews (features) with ratings or sentiment labels (positive, negative, neutral).
Q: Why is it important for a machine learning problem to have regular patterns?
A: Machine learning learns regularities and patterns; it struggles to learn rare or irregular patterns.
Q: Give an example related to sentiment analysis.
A: Positive words like “good,” “awesome,” or “love it” appear more often in highly-rated reviews, while negative words like “bad,” “lousy,” or “disappointed” appear more often in poorly-rated reviews.
Q: Why is finding meaningful representations of data important in machine learning?
A: Machine learning algorithms operate on numbers, so examples must be represented as feature vectors; good features often determine the success of the model.
Q: Give an example of data representation in sentiment analysis.
A: Represent a customer review as a vector of word frequencies, with the label being positive (4–5 stars), negative (1–2 stars), or neutral (3 stars).
Q: Why is defining success important in machine learning?
A: Machine learning optimizes a training criterion, so the evaluation function must align with business goals.
Q: How can success be measured in sentiment analysis?
A: By accuracy—the percentage of correctly predicted labels.
Q: What is a classical algorithm in data mining that uses nearest neighbors?
A: The k-Nearest Neighbors (k-NN) algorithm, which classifies unlabeled objects based on the majority class of their nearest neighbors.
Q: How does k-NN work with different values of k?
A: The algorithm considers the k closest neighbors to determine the class:
k = 3: Uses the 3 nearest neighbors
k = 5: Uses the 5 nearest neighbors
Q: How does the k-Nearest Neighbors (k-NN) classifier learn from a training dataset?
A: It stores the training dataset and uses it to classify new instances. Its a lazy learner
Q: How are the K nearest neighbors determined in k-NN?
A: By calculating the Euclidean distance between the new instance and all training examples.