Chapter 8: comparing more than two proportions
1/22
There's no tags or description
Looks like no tags are added yet.
Name | Mastery | Learn | Test | Matching | Spaced | Call with Kai |
|---|
No study sessions yet.
23 Terms
What kind of data leads to comparing multiple proportions?
Categorical data with more than two categories (e.g., color, class, opinion level). This is called a multinomial experiment.
How is a multinomial experiment different from a binomial one?
• Binomial: Only two outcomes (e.g., success/failure)
• Multinomial: More than two categories (e.g., ice cream flavors)
How is the p-value calculated in a multinomial simulation test?
It is the sum of probabilities of all possible outcomes as extreme (or more) as the observed one under the null model.
What is the null hypothesis for comparing proportions across categories?
• H0: The population proportions are equal to the historical values or assumed model.
• Ha: At least one population proportion differs.
What is the interpretation when p > alpha?
Fail to reject H0: There is not enough evidence to conclude that the proportions differ.
What is Fisher’s Exact Test and when is it used?
It is a simulation-based test used for 2×2 tables, based on a multivariate hypergeometric distribution.
Why is Fisher’s Exact Test helpful in small samples?
It computes exact p-values when expected counts are too small for a chi-square approximation.
What does the chi-square goodness-of-fit test assess?
Whether observed categorical frequencies match expected frequencies from a theoretical distribution.
Chi-Square Distribution
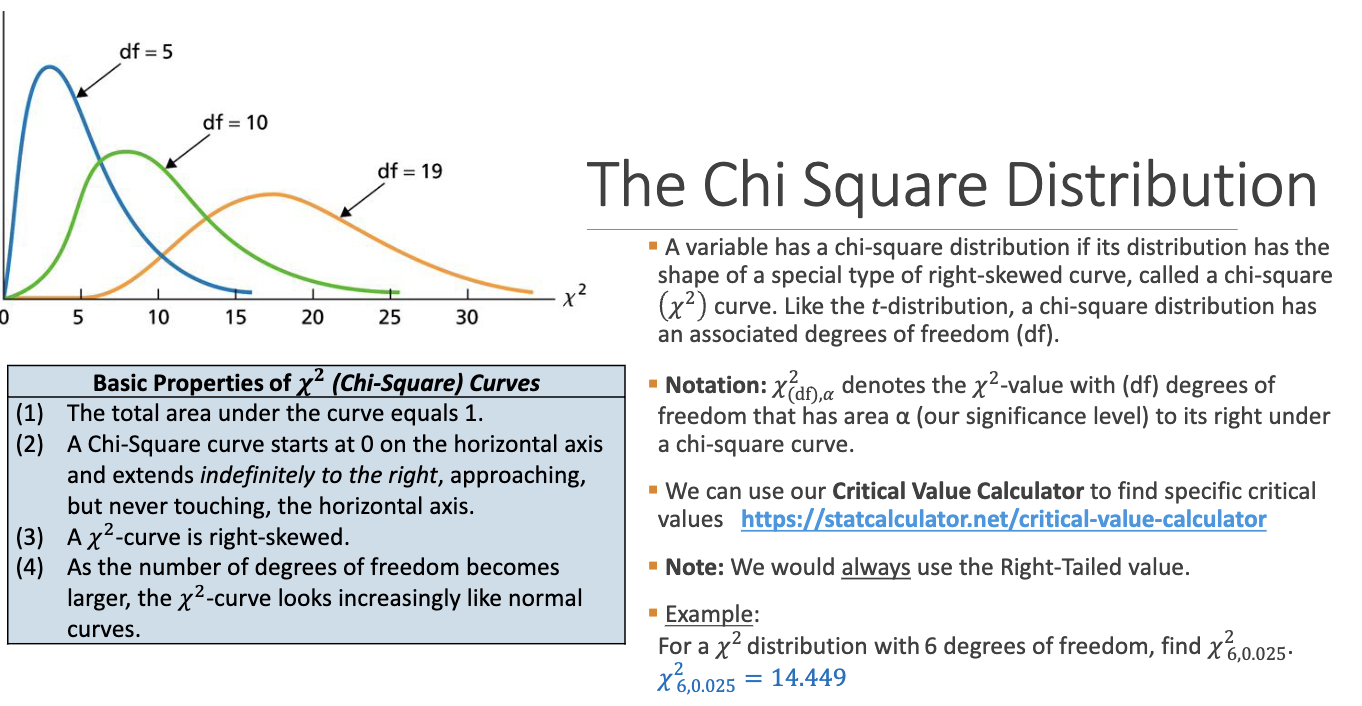
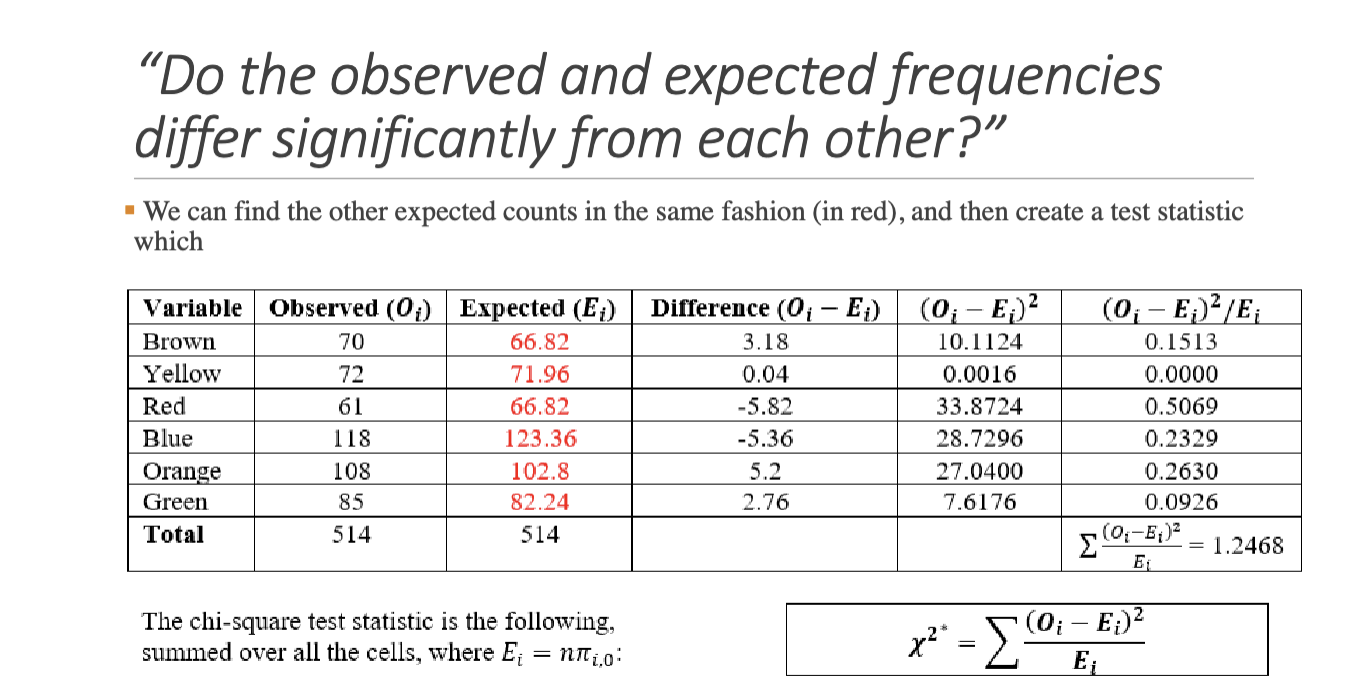
What is the test statistic for the chi-square goodness-of-fit test?
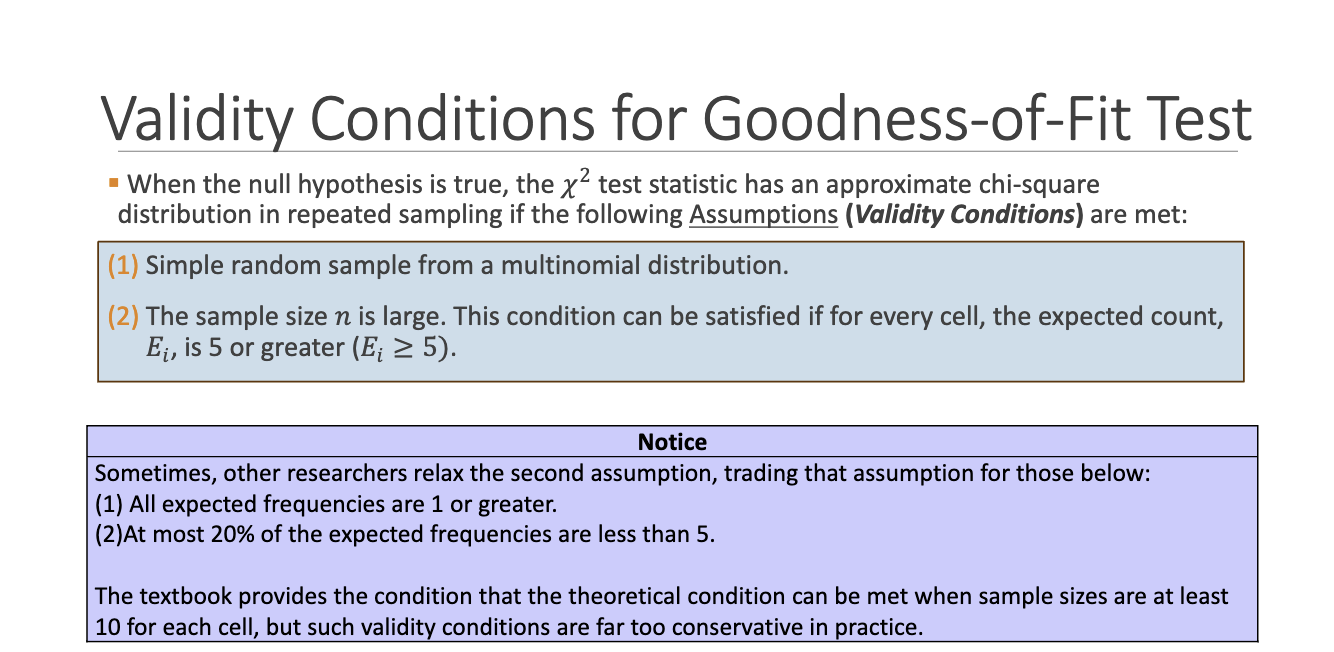
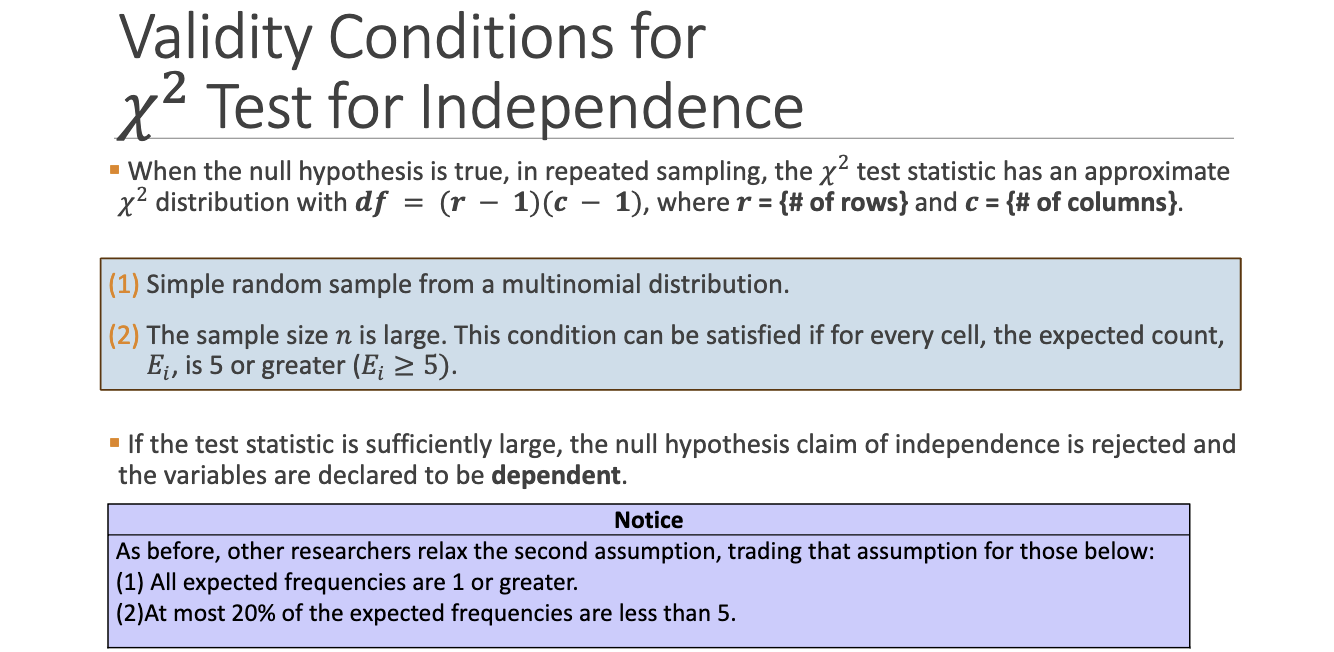
What are the assumptions (validity conditions) for the chi-square test?
How many degrees of freedom are used in the goodness-of-fit test?
The number of degrees of freedom is (𝒌 − 𝟏), where 𝒌 = {# 𝒐𝒇 𝒄𝒐𝒍𝒖𝒎𝒏𝒔/𝒄𝒂𝒕𝒆𝒈𝒐𝒓𝒊𝒆𝒔}.
What does a large chi-square value mean?
Large deviations between observed and expected counts → likely to reject H0.
When do we reject H_0 in the goodness-of-fit test?
If the p-value < significance level a , or if X² > critical value from table.
What is a contingency table?
A table that displays the frequency distribution of variables grouped by two categorical variables.
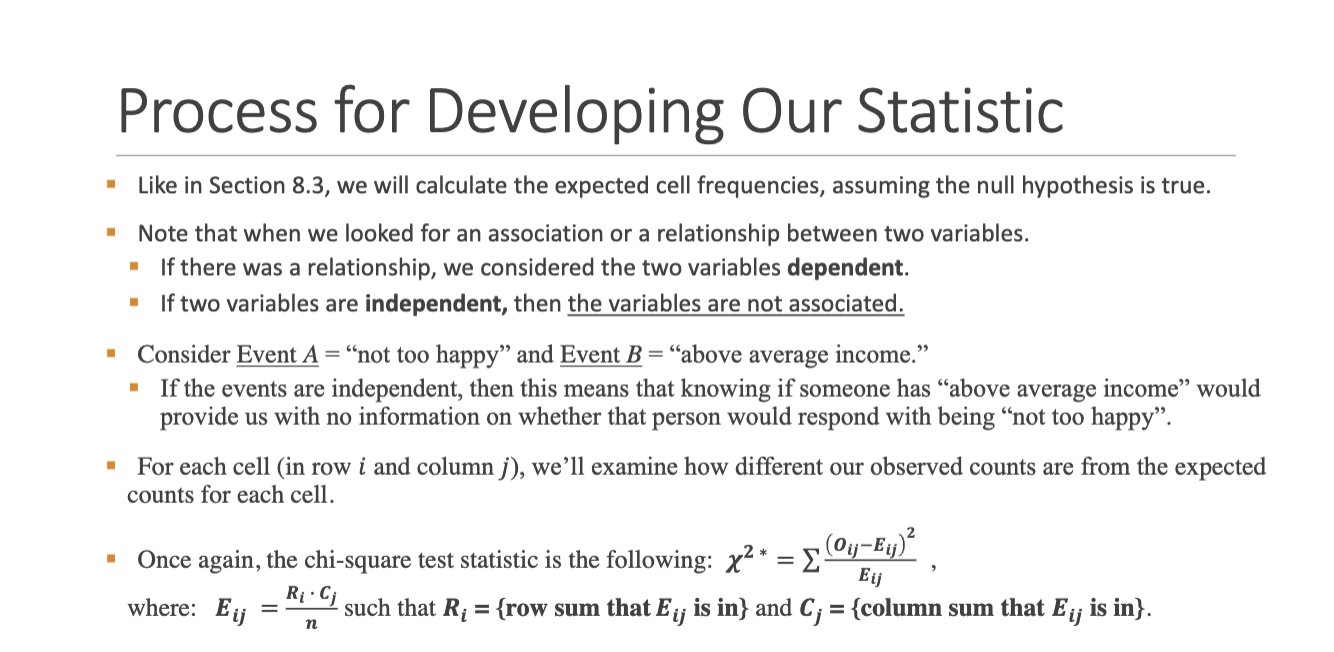
What does the chi-square test for independence assess?
Whether two categorical variables are associated (dependent) or not (independent).
What are the hypotheses for the test of independence?
• H_0: The variables are independent (no association)
• H_a: The variables are dependent (associated)
What is the test statistic formula for independence?
How are degrees of freedom calculated for a contingency table?
What do we do if validity conditions for the chi-square test aren’t met?
1. Combine rows/columns
2. Remove categories
3. Increase sample size
4. Use a simulation-based method
What is Simpson’s Paradox?
A statistical phenomenon where a trend appears in several groups but reverses or disappears when the groups are combined.
Does association imply causation?
No. Even with significant association from a chi-square test, we cannot conclude causality without proper experimental design.
Why must we be cautious when collapsing categories in a contingency table?
Collapsing improperly can hide or distort real effects, especially in sensitive or political data (e.g., discrimination cases).