Biostatistics II Exam #2 Review
1/19
There's no tags or description
Looks like no tags are added yet.
Name | Mastery | Learn | Test | Matching | Spaced |
|---|
No study sessions yet.
20 Terms
In a small-scale experimental study of the relation between degree of brand liking (Y) and moisture content (X1) and sweetness (X2) of the product, the following estimated regression function is obtained Y=2.3+4.9X1+3.7X2. How to interpret b1=4.9 here?
The mean degree of brand liking increases 4.9 when moisture content of the product increases one unit and sweetness of the product remains constant.
What are the multiple regression assumptions?
-Independence
-Linearity
-Homoscedasticity
-Normality
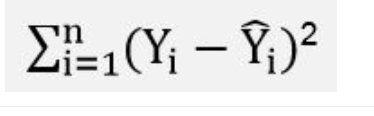
Which of the following equation about SSE (Residual sum of squares) is correct?
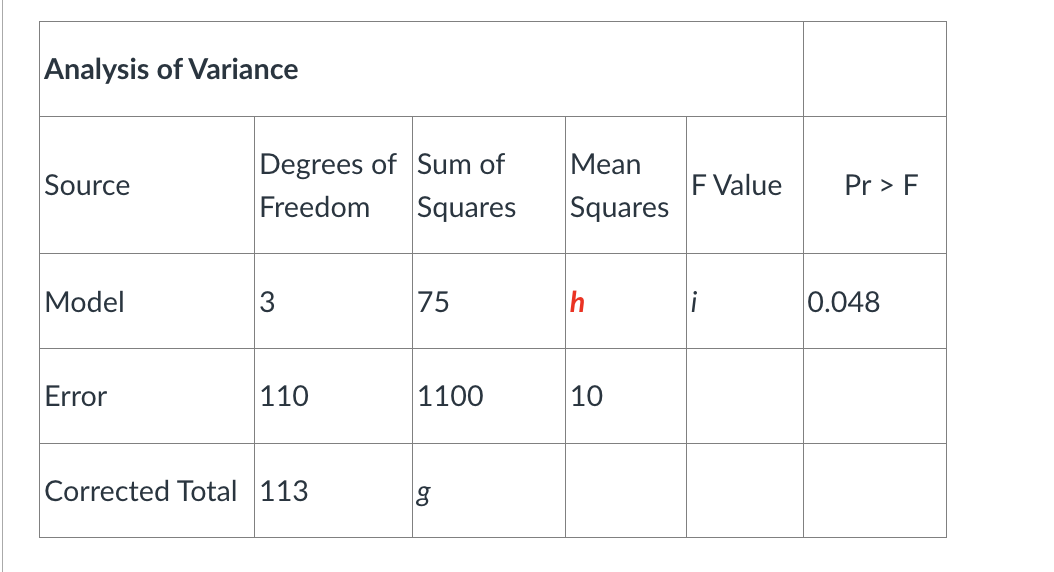
The following ANOVA table generated by a statistical software package for a regression model. There are some missing pieces of information in the table. Please fill in these blanks with your understanding of ANOVA. What is the value of h model regression mean square?
Mean square= Sum of Squares (model)/Degrees of freedom (model)
h= 75/3= 25
The following ANOVA table generated by a statistical software package for a regression model. There are some missing pieces of information in the table.
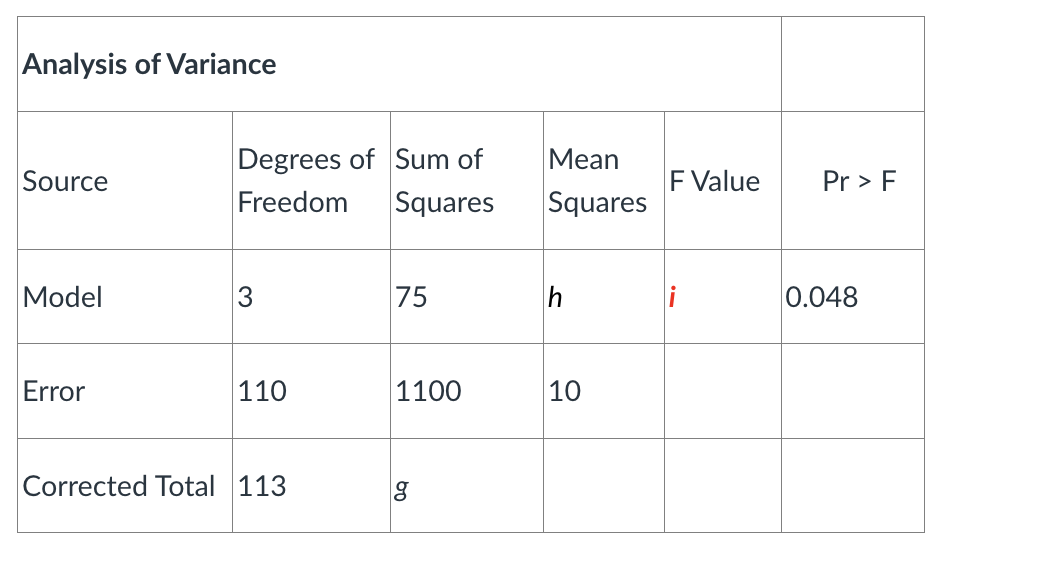
What is the value for i (model regression) mean square?
F= Mean square for model/ Mean square for Error
25/10= 2.5
Which of the following regarding F tests is NOT true?
The F distribution can be related to the t distribution when the numerator degrees of freedom is less than or equal to 2.
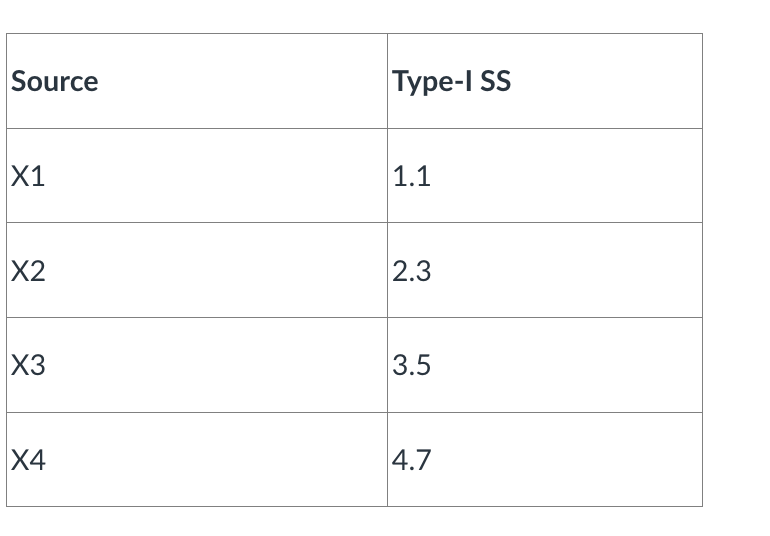
In the following SAS output table for Type I type of sum of squares, compute SSR (X4, X3|X1, X2) when the total sum of squares is 17.0. What is the correct answer?
SS for X3 given X1, X2= 3.5
SS for X4 given X1, X2, X3= 4.7
SSR (X4, X3|X1, X2)= SS for X3 +SS for X4= 3.5+4.7= 8.2
Assume that we have 9 candidate predictors X1, X2, .. X9, and the sample size is 142. What is the degree of freedom for the extra sum of squares SSR (X1, X3, X4, X5|X2, X6, X7, X8, X9)
You are adding X1, X3, X4, X5 to the model which is 4 variables.
-4
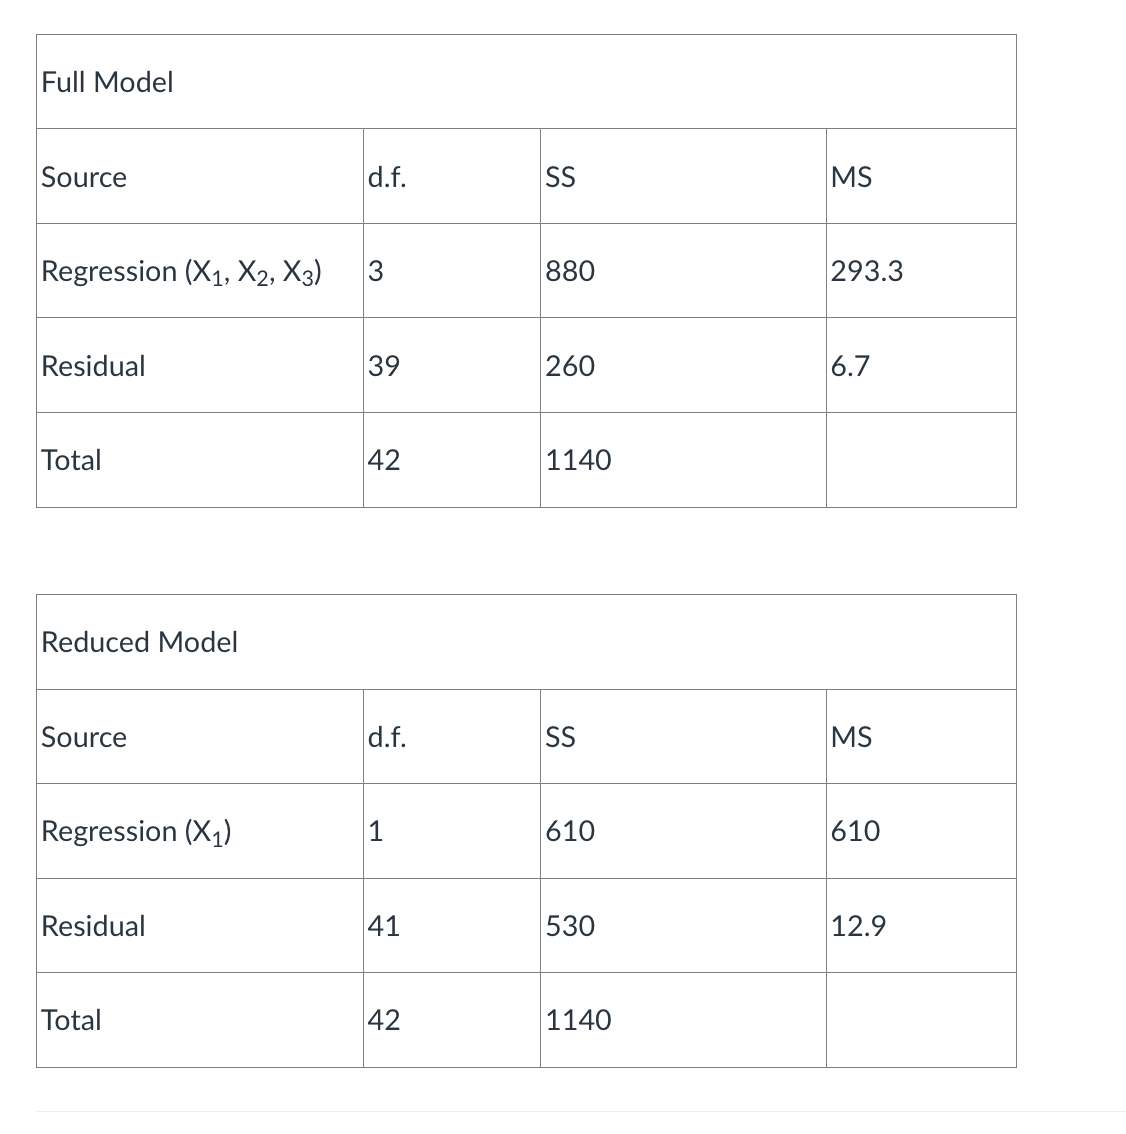
For a model containing only a single predictor smoking frequency (X1) what is the F-value for adding gender (X2) and blood pressure (X3) in order to predict Lung cancer based on the information provided in the table.
F= (SSRfull-SSRreduced)/(dffull-dfreduced)/MSE full
numerator=880-610/3-1=270/2=135
MSEfull=6.7
F=135/6.7= 20.1
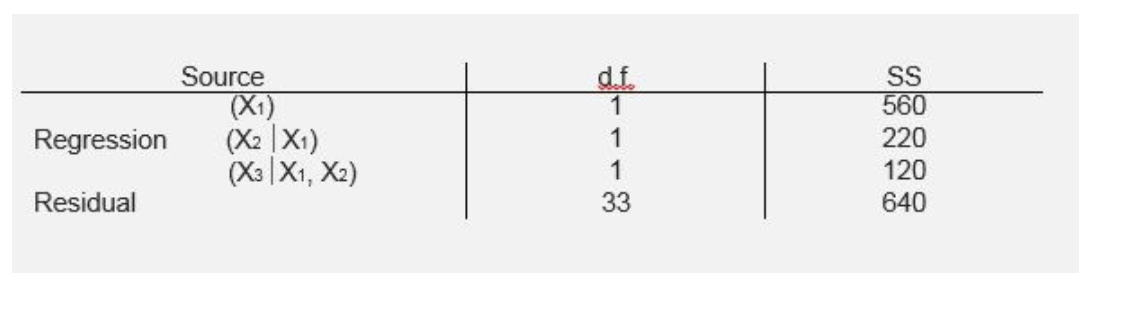
A pyschologist examined the regression relationship between anxiety level (Y) measured on a scale ranging from 1 to 50 as the average of an index determined at three points in a 2-week period and the following independent variables X1= systolic blood pressure X2=IQ, and X3= job satisfaction. The following ANOVA table summarizes the results obtained from a variables added in order regression analysis on data involving 37 outpatients who were undergoing therapy at a certain clinic.
What is the F value for adding independent variable X1 if we test H0: B1= 0 vs. HA: B1 not equal to 0 in the model Y=B0+B1X1+E.
-20
Which of the following regarding the multiple correlation coefficient Ry|X1,X2,..Xk is true?
All of the above:
R²Y|X1, X2..Xk= SSY-SSE/SSY
Multiple correlation coefficient is a measure of the overall linear association of one of the dependent variable Y with several independent variables X1, X2, ..Xk.
RY1/2X1, X2..Xk measures the strength of the association between Y and the best fitting linear combination of the X’s.
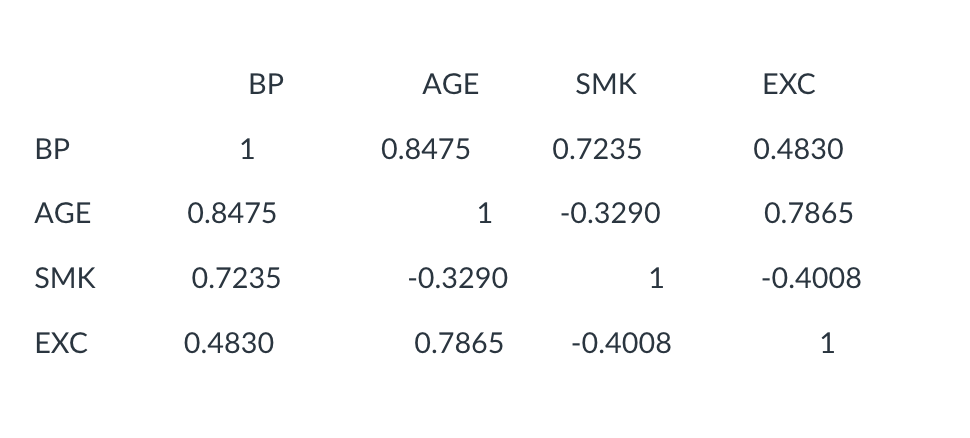
The correlation matrix obtained for the variables BP (blood pressure), AGE (X1), SMK (X2 smoke), and EXC (X3, exercise) is given by
based on the matrix, which of the following independent variables AGE, SMK, and EXC explains the largest proportion of the total variation in the dependent variable BP?
AGE
R²= r²
AGE= (0.8475)²=0.7183
SMK=(0.7235)²=0.5235
EXC=(0.4830)²=0.2333
The correlation matrix obtained for the variables BP (Y) (Blood pressure), AGE (X1), (Age), (SMK) (X2), smoke, and WET (X3) (Weight) is given by
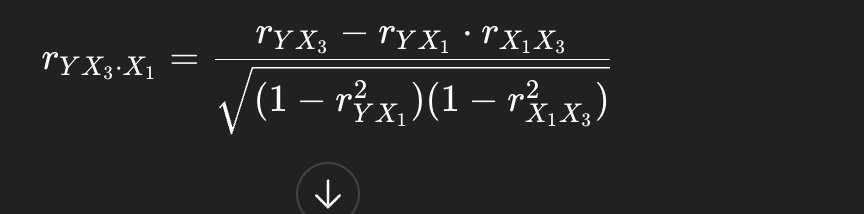
Based on this matrix calculate the partial correlation of rYX3|X1.
-rYX3X1
-0.71
rYX1X2=rYX1-rYX2*rX1X/square root of (1-r²YX1)(1-r²X1X3).
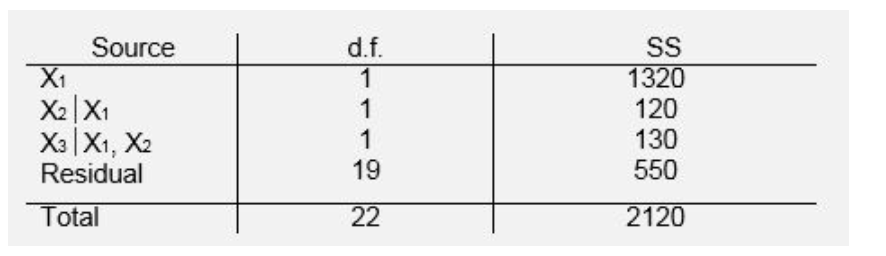
The stomach cancer mortality rate (Y) is related to pollution index (X1), mean age (X2), and percentage of workforce employed in a certain industry (X3). Please use the following ANOVA table to test the following hypothesis.
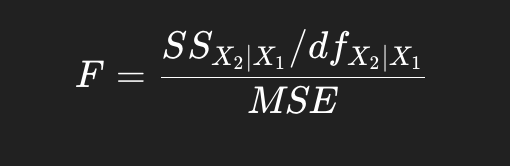
H0: pYX2|X1=0; Ha: pYX2|X1 not equal to 0. What is the calculated F-value.
3.5
MSE= SSresidual/dfResidual= 550/19= 28.95.
F=120/1/28.9=120/28.95=4.145.
The stomach cancer mortality rate (Y) is related to air pollution index (X1) mean age (X2), and percentage of workforce employed in a certain industry (X3). Please use the following ANOVA table test the following hypothesis. H0PYX2|X1=0, Ha: PYX2|X1 is not equal to 0. What is your conclusion at the alpha level of 0.05 level?
Reject H0 in favor of Ha.
Which of the following choices about confounding are true?
A confounder must be independently associated with a dependent variable Y.
Confounder must not be an intermediary step in the casual pathway between independent variable X and dependent variable Y.
(1) (3) and (4)
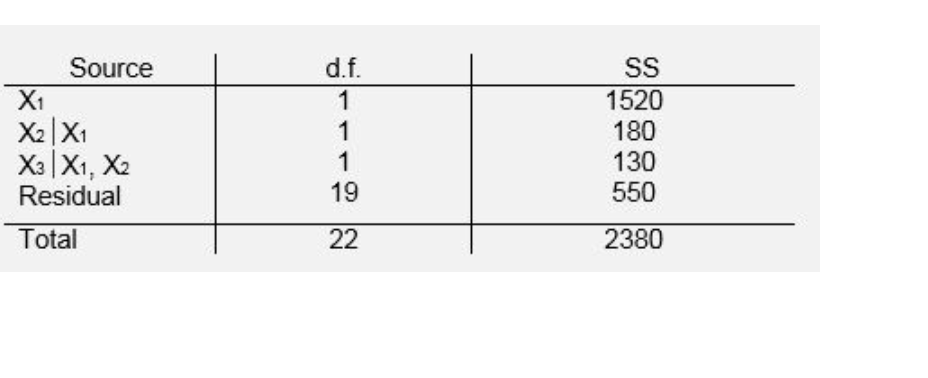
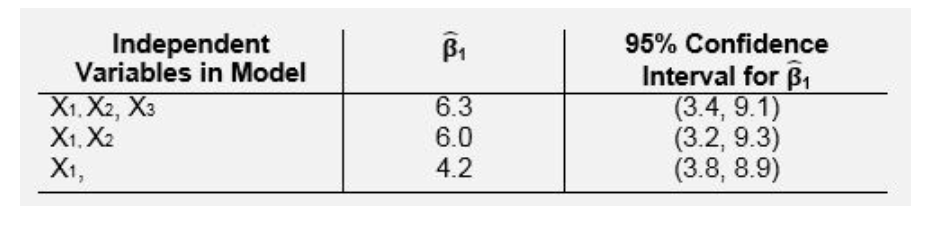
For model Y=B0 +B1X+B2C1+ B3C2+B4C3+ E all subsets of C1, C2, C3 give adjusted estimates that are roughly equal to gold standard 1|C1, C2, C3=3.5. According to the following information which subset is the best for controlling confounding and enhancing precision?
C1, C2, and C3. This is the narrowest interval.
For model Y=B0+B1X1+B2X2+B3X3+ E the following results describe regression analysis involving three independent variables X1, X2, X3 and dependent variable Y. Please determine whether confounding exists according to the following information.
There is confounding due to X2 since introducing X2 into the model after X1 drastically changes the B1 and introducing X3 doesn’t change drastically from there.
Which of the following regarding confounding are true?
-it doesn’t need to be determined by a statistical test.
-it exists if meaninfully different interpretations of the relationship of interest result when an extraneous variable is ignored or included in the data analysis.
For the model Y=34+5*DEP +6*Race-14*DEP*RACE, Y; happiness score; DEP: depression (1 for people with depression, 0 for people without); RACE is 1 for white people and 0 for non white people. According to the above model what is the happiness score for non-white with depression.
39