(6) Chi-squared tests
1/11
There's no tags or description
Looks like no tags are added yet.
Name | Mastery | Learn | Test | Matching | Spaced | Call with Kai |
|---|
No study sessions yet.
12 Terms
Goodness of fit
Measures how well an observed frequency distribution fits to a known distribution
H0 (null hypothesis)
There is no difference between the observed and theoretical distribution
H1 (alternative hypothesis)
There is a difference between the observed and theoretical distribution
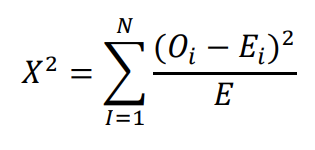
X2 formula booklet (Measure of goodness of fit)
Calculate number of degrees of freedom
Number of cells - number of constraints
(after any combining)
When to combine cells
When any of the expected values are less than 5, then combine frequencies in the table until they are greater than 5
X2 > critical value
Sufficient evidence to reject H0
X2 < critical value
Insufficient evidence to reject H0
Degrees of freedom for discrete uniform dist
v = n - 1
Degrees of freedom for binomial/poisson/geometric dist
If p/λ is not estimated by calculation: v = n - 1
Otherwise v = n - 2
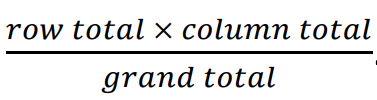
Expected frequency from contingency table
Number of degrees of freedom from contingency table
(h-1)(k-1)
h = rows
k = columns