General physiology
 Call Kai
 Learn
Learn Practice Test
 Spaced Repetition
 Match
Match Flashcards
 Knowt Play
1/42

There's no tags or description
Looks like no tags are added yet.
Name | Mastery | Learn | Test | Matching | Spaced | Call with Kai | Chat |
|---|
No analytics yet
Send a link to your students to track their progress
43 Terms
Concept of Homeostasis
( What is homeostasis, who introduced the concepts, and what does it depend on?)
Definition: Maintenance of near-constant conditions in the internal environment.
Claude Bernard: Coined the concept of "milieu interieur’” - The stability of the internal environment as a condition for free life.
Walter B. Cannon: Coined the term "Homeostasis".
Dependency: Homeostasis mainly depends on the Extracellular Fluid (ECF) / Interstitial Fluid (ISF).
Classification of control system
2 types -
Feedback system
Positive feedback
Negative feedback
Feedforward system
Feedback & Feedforward Control Systems
( Compare Positive Feedback, Negative Feedback, and Feedforward mechanisms with key examples.)
Negative Feedback: Maintains stability by reversing a change e.g.,
TRH → TSH →T_4 regulation
Barroreceptor = increase B.P →stimulate barro → stimulate parasympathetic → decrease B.P
Positive Feedback (Vicious Cycle): Amplifies a change. Examples include:
Blood clotting (Thrombin generation)
LH surge causing ovulation
Childbirth via uterine contractions (Ferguson reflex)
Suckling causing milk ejection ( Oxytocin → cause milk ejection → Suckling → increase oxytocin release)
Nerve action potential
Na+ channel opening - positive feedback
K+ channel opening -negative feedback
Sarcoplasmic Ca2+release via ryanodine receptors during excitation-contraction coupling in cardiac muscle
Feedforward Mechanism: Anticipatory control acting in one direction. Examples include:
Thermoregulation (skin sensors triggering core heat production before core temperature drops)
Increased heart and respiratory rate prior to exercise
2 variants in stomach
receptive relaxation of stomach - feedforward
Adaptive relation of stomach 0 negative feedback
Cephalic phase of gastric secretion
Adaptive functions of the Cerebellum (Basket, Golgi, Purkinje cells)
Gain of Control System
( How is the Gain of a control system calculated, and what are key numerical examples?)
Formula: Correction / Error
Higher gain → system is more effective
Baroreceptor System Example: If B.p rises from120 to 180. Baroreceptor will act but not decrease directly to 120. It decrease slowly. So if they decrease till 140 then correction is 40 and error remain is 20. So gain is → 40/20 =2
Normal barroreceptor gain in our body = -2
Normal Thermoregulation Gainin our body: -33
Kidney BP / Blood Volume System Gain: Infinite gain because error is 0 ( Perfect system)
Cell Membrane Permeability & Transport
Describe lipid bilayer permeability and the types of membrane transport proteins.
Permeability:
Small nonpolar/hydrophobic molecules (O2, CO2): Diffuse rapidly across membrane
Small uncharged polar molecules (water, urea): Diffuse slowly.
Charged molecules (ions): Impermeable to the lipid bilayer.
Transport Protein Types:
Carrier Proteins:
Bind solute, undergo a conformational change, and release solute;
exhibit saturation kinetics.
Used in facilitated diffusion and primary,secondary active transport.
Channel Proteins: Form open or gated pores for simple diffusion.
Classification of Membrane Transport
What are the key differences between Active, Passive, and Vesicular Transport?
Active Transport: Moves solutes uphill against concentration gradient; requires ATP.
Primary Active: Direct ATP use (e.g., Na-K-ATPase).
Secondary Active: Indirect ATP use via ion gradients; 2 types
Symport (e.g., SGLT)
Antiport (e.g., NCX).
Passive Transport: Moves solutes downhill; no ATP required. 2 types
Diffusion
Simple Diffusion,
Facilitated Diffusion (carrier-mediated),
Non-ionic Diffusion,
Osmosis.
Vesicular Transport:
Exocytosis
Endocytosis.
FLASHCARD 6: Na-K-ATPase Mechanism & Structure
Explain the structure, binding sites, and step-by-step mechanism of Na-K-ATPase.
Structure: A heterodimer consisting of alpha and beta subunits.
Alpha Subunit: Contains binding sites for 3 Na+, 2 K+, ATP, and phosphorylation site.
Beta Subunit: Glycosylated, faces Extracellular Matrix (ECM).
Inhibitor: Ouabain binds externally.
Mechanism Steps:
3 Na+ ions bind to alpha subunit from intracellular fluid (ICF).
ATP hydrolysis leads to phosphorylation of alpha subunit.
Conformational change releases 3 Na+ into extracellular fluid (ECF).
2 K+ ions bind to alpha subunit from ECF.
Dephosphorylation causes intracellular conformational change.
2 K+ ions released into ICF.
FLASHCARD 7: Secondary Active Transport Mechanisms
Front: Explain how SGLT and NCX function using secondary active transport mechanisms.
Symporter (SGLT): Uses the electrochemical Na+ gradient created by Na-K-ATPase to transport Glucose uphill in the same direction as Na+.
Antiporter (NCX - Na+/Ca2+ Exchanger): Exchanges Na+ and Ca2+ in opposite directions.
Clinical Note (Digoxin): Digoxin inhibits Na-K-ATPase, increasing intracellular Na+. This decreases NCX activity, resulting in increased intracellular Ca2+ and increased myocardial contractility.
FLASHCARD 8: Passive Transport & Fick's Law of Diffusion
Explain Simple Diffusion vs. Facilitated Diffusion, non-ionic diffusion, and the equation for diffusion rate.
Simple Diffusion: Direct passage through lipid bilayer (O2, CO2) or channel proteins (Na+) without ATP or saturation kinetics.
Facilitated Diffusion: Requires carrier proteins, shows saturation kinetics (Vmax), and uses no ATP (e.g., Glucose via GLUT).
Non-Ionic Diffusion: Transport of weak acids or bases across membranes in non-ionized form (important in kidney and GIT).
Fick's Law of Diffusion Rate: {D*A*C/x} (Where D = Diffusion coefficient, A = Surface area, \Delta C = Concentration gradient, X = Membrane thickness).
FLASHCARD 9: Endocytosis & Exocytosis Mechanisms
Describe the cellular mechanisms and pathways for Endocytosis and Exocytosis.
Endocytosis:
Phagocytosis: Cell eating (engulfing bacteria, dead cells).
Pinocytosis: Cell drinking (ingestion of small vesicles with fluid/solutes).
Clathrin-Mediated Endocytosis: Receptor-mediated uptake using triskelion-shaped clathrin proteins (e.g., LDL uptake).
Caveolae-Dependent Uptake: Lipid raft depressions rich in cholesterol and sphingolipids (e.g., endothelial uptake).
Exocytosis:
Membrane fusion releasing contents outside cell.
Pathways: Constitutive (continuous, unregulated) and Non-constitutive (regulated, storage-dependent, Ca2+-dependent).
FLASHCARD 10: SGLT Transporters (Secondary Active)
List the location and primary role of SGLT 1, SGLT 2, and SGLT 3.
SGLT 1: Located in Intestinal luminal membrane and Kidney PST (Proximal Straight Tubule - reabsorbs ~10% glucose).
SGLT 2: Located in Kidney PCT (Proximal Convoluted Tubule - reabsorbs ~90% glucose).
SGLT 3: Located in Skeletal Muscle and Small Intestine (functions as a glucose sensor).
FLASHCARD 11: GLUT Transporters (Facilitated Diffusion)
Summarize the distribution and key functions of GLUT 1 to GLUT 5, GLUT 8, and GLUT 12.
GLUT 1: Universal GLUT; present in RBCs, Blood-Brain Barrier (BBB) endothelium, placenta, and fetus.
GLUT 2: Present in Beta-cells of pancreas, liver, and intestinal basolateral membrane.
GLUT 3: High affinity; present in Neurons and WBCs.
GLUT 4: Insulin-responsive GLUT; present in Skeletal muscle, Cardiac muscle, and Adipose tissue.
GLUT 5: Fructose transporter; present in luminal membrane of intestine, sperm, and astrocytes.
Special GLUT Notes:
Insulin-responsive GLUTs:
GLUT 4 and GLUT 12
GLUT 8 in blastocysts
Fructose Transporters: GLUT 5 and GLUT 11.
CNS Distribution:
GLUT 1 (BBB endothelium),
GLUT 3 (Neurons),
GLUT 5 (Astrocytes).
Major GLUT in fetus placenta
FLASHCARD 12: Total Body Water & Fluid Compartments Distribution
What is the normal composition of body weight, and how is fluid distributed between ICF, ECF, ISF, and Plasma?
Body Weight Composition:
By chemical level →
Water (~60%),
Protein (18%),
Fat (15%),
Minerals (6%),
Glycogen (1%).
By tissue level →
Skeletal muscle holds 36% of body water.
Non-skeletal (29%)
Adipose tissue (25%)
Bone (10%)
Total Body Water (TBW): 60% of total body weight. Divided in
Intracellular Fluid (ICF): 2/3 of Total body water (40% of body weight).
Extracellular Fluid (ECF): 1/3 of Total body water(20% of body weight).
Interstitial Fluid (ISF): 3/4 of ECF (15% of body weight).
Plasma: 1/4 of ECF (5% of body weight).
FLASHCARD 13: Transcellular Fluid Volumes & Age-Related Body Water Changes
Front: List key Transcellular Fluid volumes and explain how Total Body Water and fluid distribution change with age.
Transcellular Fluid Volumes:
CSF = 150 ml,
Pleural = 10 to 20 ml,
Pericardial = 50 ml,
Peritoneal = 0 ml (20ml - post ovulation),
Synovial = 1 ml/joint.
Age-Related Changes:
At Birth: TBW is ~75-80%% of body weight in term infants (up to 90% in preterm infants). ECF > ICF at birth.
3-4 Months(postnatal life): ICF volume equals ECF volume (ICF = ECF).
1 Year: ICF:ECF ratio reaches adult levels.
Puberty: Body fluid percentage and distribution match adult levels (Males ~60%, Females ~55% due to higher fat percentage).
FLASHCARD 14: Indicator Dilution Principle & Fluid Volume Measurement
State the formula for measuring body fluid compartments and list the specific indicators used for each compartment.
Indicator Dilution Formula: Volume of Distribution } (V) = {Q - e}/{C} (Where Q = Amount of indicator injected, e = Amount excreted/metabolized, C = Concentration in plasma sample).
Specific Indicators:
Total Body Water: D2O (Deuterium oxide), Tritium oxide, Antipyrine.
ECF Volume: Inulin, Sucrose, 22Na, 125I-iothalamate, Mannitol.
Plasma Volume: 125I-albumin, Evans' blue.
RBC Mass: 51Cr or 59Fe tagged RBCs.
Calculated Values:
ICF Volume} = TBW - ECF
ISF Volume = ECF - Plasma
Blood Volume = Plasma Volume} / {1 - {Hematocrit}}
FLASHCARD 15: Electrolyte Composition of Body Fluids
Compare the major cation and anion concentrations across Plasma, Interstitial Fluid (ISF), and Intracellular Fluid (ICF).
Cations (mEq/L or mOsmol/L):
Na+: Plasma = 142, ISF = 139, ICF = 14.
K+: Plasma = 4.2, ISF = 4.0, ICF = 140.
Ca2+: Plasma = 1.3, ISF = 1.2, ICF = 0 (free).
Mg2+: Plasma = 0.8, ISF = 0.7, ICF = 20.
Anions & Proteins:
Cl-: Plasma = 106, ISF = 108, ICF = 4.
HCO3-: Plasma = 24, ISF = 28, ICF = 10.
Protein: Plasma = 7 g/dl, ISF = 1 g/dl, ICF = 30 g/dl.
Total Osmolality: ~300 mOsmol/L across all compartments (Corrected osmolar activity = ~281-282 mOsmol/L).
FLASHCARD 16: Osmolality vs. Tonicity & Solute Permeability
Differentiate Osmolality from Tonicity and explain how solute permeability affects cell volume.
Osmolality: Concentration of osmotically active particles(osmoles) per kilogram of water (mOsmol/kg). Includes both permeant and impermeant solutes.
Tonicity: Predicts the effect of a solution on cell volume at equilibrium. Depends only on impermeant solutes (e.g., NaCl).
Effect of Permeant Solutes (e.g., Urea):
Urea freely crosses cell membranes. Normal osmolarity of cell is 300.
A solution of 200 mOsmol/L NaCl + 200 mOsmol/L Urea is hyperosmotic (400 mOsmol/L total), but hypotonic relative to the cell because only the 200 mOsmol/L NaCl acts as an effective osmotic force, causing water to enter the cell and making it swell.
400 mOsmol/L NaCl alone is hyperosmotic and hypertonic, causing cell shrinkage.
300 mOsmol NaCl with 100 mOsmol urea is hyperosmotic and isotonic.
Say "Next" whenever you are ready for the next batch!
FLASHCARD 17: Clinical Isotonic Solutions
List common isotonic solutions and state their key physiological properties.
0.9% NaCl (Normal Saline): ~300 mOsmol/L, isotonic.
5% Mannitol: ~300 mOsmol/L, isotonic.
5% Dextrose: Isotonic in vitro (~300 mOsmol/L), but becomes hypotonic in vivo as glucose is rapidly metabolized by tissues, leaving free water.
Lactated Ringer's (Hartmann's Solution): Isotonic solution similar to plasma, but contains No Mg2+.
Ringer's Solution: Same constituents as Lactated Ringer's, but without sodium lactate.
FLASHCARD 18: Darrow-Yannet Diagrams (Isotonic & Hypotonic Fluid Shifts)
Front: Explain the volume and osmolality changes in ICF and ECF during Isotonic and Hypotonic fluid gain/loss using Darrow-Yannet principles.
Isotonic Gain (e.g., Infusion of 0.9% NaCl): ECF volume increases; Osmolality remains unchanged; No fluid shift into ICF (ICF volume unchanged).
Isotonic Loss (e.g., Hemorrhage, Diarrhea): ECF volume decreases; Osmolality remains unchanged; ICF volume unchanged.
Hypotonic Gain (e.g., Excess water drinking, SIADH): ECF volume increases, ECF osmolality decreases. Water shifts via osmosis from ECF into ICF → ICF volume increases and ICF osmolality decreases.
Hypotonic Loss (e.g., Diabetes Insipidus, Profuse Sweating): ECF volume decreases, ECF osmolality increases. Water moves from ICF to ECF → ICF volume decreases and ICF osmolality increases.
Hypertonic Gain (e.g., Infusion of 3% NaCl): ECF osmolality increases. Water moves out of ICF into ECF → ECF volume increases, ICF volume decreases, and ICF osmolality increases.
Hypertonic Loss / Solute Loss (e.g., Primary Adrenal Insufficiency / Aldosterone Deficiency): Na+ loss causes ECF osmolality to decrease. Water shifts from ECF into ICF \rightarrow ECF volume decreases, ICF volume increases, and ICF osmolality decreases.
Cytoskeletal components
CELLULAR PHYSIOLOGY: CYTOSKELETON
1. Overview of Cytoskeleton Components
The cytoskeleton is divided into dynamic and static structures based on mobility and structural support.
Cytoskeleton Type | Component | Subunits & Polymerization | Markers / Functional Notes |
Dynamic Cytoskeleton | Microtubules | Tubulin (Alpha, Beta subunits); requires GTP for polymerization | Forms mitotic spindles; facilitates organelle transport. |
Dynamic Cytoskeleton | Microfilaments | G-Actin polymerizes into F-Actin; requires ATP for polymerization | Involved in cellular contraction and motility. |
Static Cytoskeleton | Intermediate Filaments (IF) | Provides fixed cell shape and structural strength | Tissue Markers: -
|
Drugs acting on cytoskeleton
2. Pharmacological Agents Acting on Cytoskeleton
Colchicine & Vinblastine: Prevent microtubule assembly and polymerization.
Paclitaxel (Taxol): Binds to microtubules and stabilizes them so excessively that disassembly is prevented. This inhibits organelle movement and prevents mitotic spindle formation, leading to cell death.
INTERCELLULAR JUNCTIONS & MEMBRANE ARCHITECTURE
1. Intercellular Junctions Overview
Intercellular junctions are categorized by location (apical to basal) and functional role.
Junction Type | Category | Transmembrane Binding Proteins | Intracellular Cytoskeletal Attachment | Primary Function |
Tight Junction (Zona Occludens) | Occluding | Claudin, Occludin | Actin filaments | Seals gaps between adjacent epithelial cells; regulates paracellular transport. |
Adherens Junction | Cell-Cell Anchoring | Cadherin | Actin filaments | Connects actin filament bundles between neighboring cells. |
Desmosome | Cell-Cell Anchoring | Desmoglein | Intermediate filaments | Connects intermediate filaments between neighboring cells for mechanical strength. |
Gap Junction | Channel-Forming | Connexon (composed of 6 Connexins) | None | Allows direct passage of small water-soluble molecules/ions between cells. |
Hemidesmosome | Cell-Matrix Anchoring | Integrin | Intermediate filaments | Anchors intermediate filaments of cell to the basal lamina / basement membrane. |
Focal Adhesion | Cell-Matrix Anchoring | Integrin | Actin filaments | Anchors intracellular actin filaments to extracellular matrix. |
GAP JUNCTIONS & CONNEXINS
1. Structure and Mechanism of Gap Junctions
Structure: A complete gap junction channel is formed by two hemichannels (connexons) aligned across a 3.5 nm intercellular gap.
Connexon Composition: 1 Connexon = 6 Connexin protein subunits.
Connexin Structure: Each individual connexin subunit contains 4 membrane-spanning helical regions.
Pore Diameter: 0.8 nm to 1.4 nm.
Permeability Limit: Permits passive passage of ions and small water-soluble molecules up to a molecular weight of 1000 Da.
Genetics: Encoded by approximately 20 different genes in human tissues.
Connexin mutation in diseases
2. Clinical Pathophysiology: Connexin Mutations in Disease
Mutations in connexin genes cause various clinical conditions affecting different tissue systems:
Connexin Mutation | Clinical Disease | Key Clinical Manifestations / Features |
Connexin 30 (Cx30) | Clouston Syndrome | Ectodermal dysplasia with abnormal development of skin, hair, and nails. |
Cx30.3 & Cx31 | Erythro-keratoderma Variabilis | Skin disorder presenting with migratory erythema and fixed hyperkeratotic plaques. |
Cx46 & Cx50 | Cataract | Lens opacity leading to impaired vision. |
Cx40 | Idiopathic Atrial Fibrillation | Cardiac conduction defects leading to irregular atrial rhythms. |
Cx32 | X-linked Charcot-Marie-Tooth Disease | Peripheral neuropathy affecting motor and sensory nerves |
Neuron structure and organelle
Functional Anatomy of a Neuron
Neurons consist of a cell body (soma), dendrites for input reception, and a single axon for signal transmission.
Structural Region | Key Organelles & Components | Functional Role |
Soma (Cell Body) | Nucleus, Rough ER (Nissl bodies), Golgi apparatus, Mitochondria | Primary metabolic and protein synthesis center of the neuron. |
Nissl Substance / Bodies | Concentrated Rough Endoplasmic Reticulum and ribosomes | Synthesizes structural proteins and neurotransmitters. Present in soma and dendrites; absent in axon hillock and axon. |
Dendrites | Dendritic spines, Microtubules, Microfilaments, Nissl bodies | Receive synaptic inputs from other neurons; conduct graded potentials toward soma. |
Axon Hillock | High density of voltage-gated Na+ channels | Region connecting soma to axon; acts as the spike initiation zone (triggers action potentials). |
Axon (Axoplasm) | Microtubules, Neurofilaments, Mitochondria (No Nissl bodies) | Conducts action potentials away from soma toward target terminal. |
Axonal transport
AXONAL TRANSPORT (AXOPLASMIC FLOW)
1. Overview of Axonal Transport
Axonal transport is the active movement of organelles, proteins, and vesicles along the axon using cytoskeletal tracks.
Comparison of Anterograde vs. Retrograde Motors
Kinesin: Moves cargo toward the plus (+) end of microtubules (toward the axon terminal).
Dynein: Moves cargo toward the minus (-) end of microtubules (toward the soma).
|
| ---- (Anterograde: Kinesin / Microtubules) ----> [AXON TERMINAL]
|
| <--- (Retrograde: Dynein / Microtubules) <----- [AXON TERMINAL]
2. Classification of Axonal Transport
Transport Type | Direction | Motor Protein | Rate / Speed | Cargo / Transported Materials | Clinical / Pathological Significance |
Fast Anterograde Transport | Soma \rightarrow Axon Terminal | Kinesin (uses ATP) | 200 to 400 mm/day | Membrane-bound vesicles, neurotransmitter precursors, mitochondria, synaptic proteins | Essential for ongoing synaptic function and maintenance. |
Slow Anterograde Transport | Soma \rightarrow Axon Terminal | Microtubule treadmilling / motor-assisted | 0.2 to 5 mm/day | Microfilaments, neurofilaments, tubulin subunits, enzymes (e.g., glycolytic enzymes) | Determines the rate of nerve regeneration following injury. |
Retrograde Transport | Axon Terminal \rightarrow Soma | Dynein (uses ATP) | 100 to 200 mm/day | Recycled membrane vesicles, Nerve Growth Factor (NGF), trophic signals | Pathogen entry route: Rabies virus, Poliovirus, Herpes simplex, and Tetanus toxin travel via retrograde transport to reach CNS. |
Membrane potential
1. Membrane Potential Concept
Electrical potentials exist across membranes of virtually all body cells.
At rest, the inside of the cell is negative relative to the outside by approximately 10 to 100 mV.
Measured relative to a reference point outside the cell (0 mV). .
Resting membrane potential
Resting Membrane Potential (RMP) is of -70 mV
Three Main Factors Determining RMP
1. Ion Concentration Differences: Driven by uneven ion distribution across the selectively permeable membrane and differential permeability in the resting stage.
2. Potassium (K+) Diffusion Potential: Dominant contributor due to high resting permeability through constitutively open K^+ leak channels.
3. Na+-K+ ATPase Pump: Electrogenic contribution accounts for 5% to 10% of total RMP.
GOLDMAN-HODGKIN-KATZ (GHK) EQUATION & RMP VALUES
1. GHK Equation Accounts for membrane potential (V_m) when multiple ions are permeable simultaneously: used to calculate resting membrane potential.
See equation in pdf
2. RMP Values Across Different Cell Types
Cell Type | Resting Potential (mV) | Normal Range (mV) |
Neurons | -70 | -60 to -70 |
Skeletal Muscle | -90 | -85 to -95 |
Smooth Muscle | - | -50 to -60 |
Cardiac Muscle | -90 | -80 to -90 |
Hair Cells (Cochlea) | +40 | -15 to -40 |
Astrocytes | -80 | -80 to -90 |
Erythrocytes (RBCs) | -10 | -8 to -12 |
Photoreceptors | - | -40 (Dark) to -70 (Light) |
3. Key RMP Principles (Slide 15)
RMP of almost all vertebrate cells is close to E{K+} due to constitutive K+ leak channels.
In neurons, RMP (-70 mV}) is equal to E{Cl-}.
Resting permeability order: K+ > Cl- > Na+.
Maintainence of uneven distribution of ions / Donnan effect
SLIDE 11: DONNAN EFFECT (GIBBS-DONNAN EQUILIBRIUM)
Definition: Unequal distribution of diffusible ions across a membrane caused by the presence of non-diffusible charged proteins on one side.
Equilibrium Condition: {Total Ions Side A]} = [Total Ions Side B]}
E.gCompartment A (containing 6 Na+, 3 Cl-, and 6 non-diffusible Proteins) and Compartment B (containing 6 Na+ and 3 Cl-). At equilibrium, ions redistribute to Compartment A (8 Na^+, 2 Cl^-) and Compartment B (4 Na^+, 4 Cl^-) to balance product products (8 times 2 = 4 times 4 = 16).
Equilibrium potential and nernst equation
EQUILIBRIUM POTENTIAL & NERNST EQUATION
1. Nernst Equation Calculates the equilibrium potential (E_Q) for a specific permeable ion across a membrane:
EQ = RT/ZF ln [Out]/[In] = +61/Z(charge) ln [Out]/[In]
2. Calculated Equilibrium Potentials for Individual Ions
E_{K^+}: -90 mV (calculated as +61 \log_{10}(14/140) = -61 \times 1 = -61 \text{ mV} at given simplified values, standard value \mathbf{-90 \text{ mV}})
E_{Na^+}: +63 mV
E_{Cl^-}: -70 mV (calculated using 110/11 concentrations: {+61}{-1} \log{110}/(10) = -61 mV
E_{Ca^{2+}}: +132 mV
Relative permeability at rest: K+ » Cl- » Na+.
If only one type of leak channel is open, RMP = EQ for that ion. Since K+ has the highest permeability, overall RMP is closest to E{K+}.
Graded (Local)vs action potential
GRADED POTENTIALS VS. ACTION POTENTIALS
1. Definitions
Depolarization: Potential becomes less negative (e.g., -70 mV} → -55 mV→0 mV}).
Hyperpolarization: Potential becomes more negative (e.g.-70 mv → -80 →-85)
2. Local Potential / Graded potential
Stimulus causes initial Na^+ influx → Potential moves from -70 mV →-65 mV} →-60 mV}.
Threshold Voltage: -55 mV. Once reached, voltage-gated Na+ channels (Na_v) open, firing an Action Potential up to +35 mV.
3. Comparison Table
Parameter | Local Potential (Graded Potential) | Action Potential |
Propagation | Non-propagated | Propagated |
Amplitude | Graded (varies with stimulus strength) | Non-graded (fixed amplitude) |
Conduction Type | Decremental (fades over distance) | Non-decremental |
All-or-None Law | Does NOT follow | Follow all or none |
PHASES OF ACTION POTENTIAL & IONIC PERMEABILITIES
1. Phases & Ion Movement
Local Potential: Small initial Na+ entry up to -55 mV threshold.
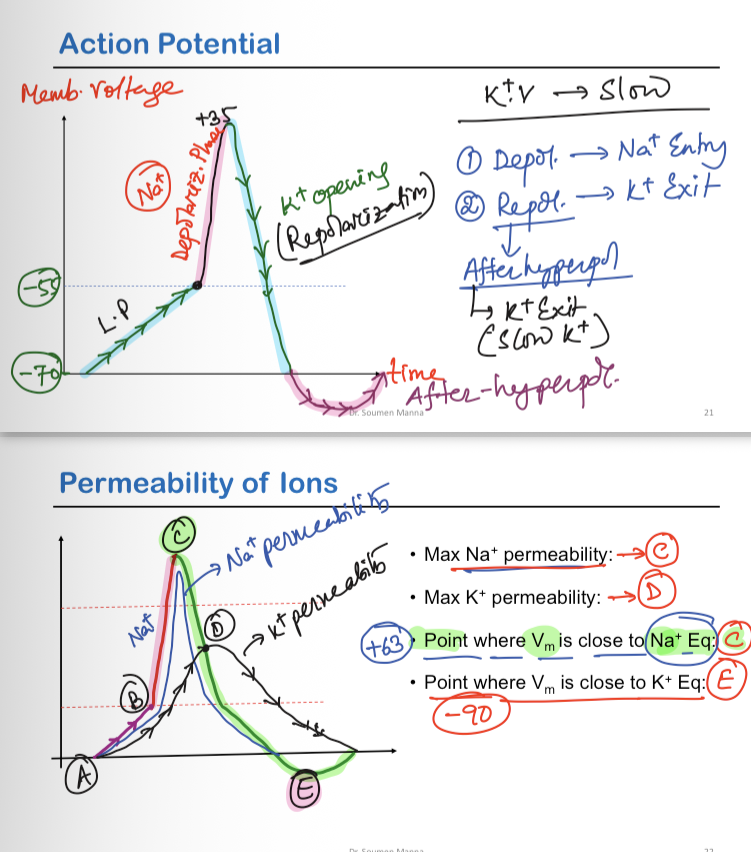
Depolarization Phase: Opening of fast Na+ channels → massive Na+ entry driving potential to +35 mV.
Repolarization Phase: Na+ channels close; voltage-gated K+ channels open slowly → K+ exit.
After Hyperpolarization: Slow closing of K+ channels allows continued K+ exit, dipping below RMP.
2. Key Points on Permeability Curve (Slide 22)
Point A: Resting potential (-70 mV}).
Point B: Firing threshold (-55 mV}).
Point C (Peak overshoot): Maximum Na+ permeability; membrane potential Vm is closest to E{Na+} (+63 mV}).
Point D: Maximum K+ permeability during repolarization.
Point E: Maximum hyperpolarization; membrane potential V_m is closest to E{K+} (-90 mV}).
Refractory periods
REFRACTORY PERIODS
2 types
Absolute Refractory Period (ARP):
Spans total depolarization plus the first 1/3 of repolarization.
No second Action Potential is possible, regardless of stimulus strength.
Relative Refractory Period (RRP):
Spans the later 2/3 of repolarization and the after-hyperpolarization phase.
A second Action Potential is possible, but requires a stimulus of higher strength than normal.
Nerve fiber classification
ERLANGER-GASSER NERVE FIBER CLASSIFICATION
Fiber Type | Numerical Class | Myelination | Diameter (\mu\text{m}) | Conduction Velocity (m/s) | Primary Functions / Locations |
A-Alpha | Ia, Ib | Myelinated | 12 -20 | 70 - 120 | Proprioception, Motor output |
A-Beta | II | Myelinated | 5 - 12 | 30 - 70 | Touch, Pressure |
A-Gamma | - | Myelinated | 3 - 6 | 15 - 30 | Efferent motor to muscle spindles |
A-Delta | III | Myelinated | 2 - 5 | 12 - 30 | Temperature, Fast Pain |
B | - | Myelinated | < 3 | 3- 12 | Preganglionic autonomic fibers |
C | IV | Unmyelinated | 0.4 - 1.2 | 0.5 - 2 | Warmth, Slow Pain, Postganglionic sympathetic |
SUSCEPTIBILITY & ACTION POTENTIAL DURATION
1. Sensory Modality Carry Fiber Types
Cold Sensation: Carried by A-delta fibers.
Warm Sensation, Burning Pain, & Freezing Pain: Carried by C fibers.
2. Order of Susceptibility to Blockers
Local Anesthetics:(Small unmyelinated fibers blocked first; specifically A-gamma > A-delta > A-beta > A-alpha > B > C).
Pressure / Mechanical Compression: A > B > C
Hypoxia / Ischemia: B >A} > C.
3. Spike Action Potential Duration
C Fiber: 2.0 ms
B Fiber: 1.2 ms
A Fiber: 0.4 to 0.5 ms
Overall Action Potential Duration Order: C >B > A
TYPES OF MUSCLE
Skeletal Muscle: Responsible for voluntary movement of bones (locomotion) and the breathing cycle of lungs.
Cardiac Muscle: Specific to the heart, functioning as a biomechanical pump.
Smooth Muscle: Provides mechanical control over organ systems such as the digestive tract, urinary bladder, and reproductive tract.
SKELETAL MUSCLE HIERARCHY
Structural hierarchy from largest to smallest:
Whole Muscle
Fascicle (bundle of muscle fibers)
Muscle Fiber / Cell (contains sarcoplasm and nuclei)
Myofibril
Thick and Thin Myofilaments arranged into Sarcomeres
SKELETAL MUSCLE FIBER COMPONENTS
Sarcolemma: Lipid bilayer and protein membrane outer layer.
Sarco-tubular System:
T-tubules (Transverse tubules): Contain Dihydropyridine Receptors (DHPR).
L-tubules (Sarcoplasmic Reticulum): Contain Ryanodine Receptors (RyR).
Myofibril: The contractile unit array inside the fiber.
SARCOLEMMA PROTEINS & DYSTROPHIN COMPLEX
Peripheral Proteins: Dystrophin, Syntrophin.
Integral Proteins: Sarcoglycan complex (\alpha, \beta, \gamma, \delta), Sarcospan, Dystroglycan (\alpha, \beta).
Extracellular Matrix Attachment: Laminin 211 (\alpha 2, \beta 2, \gamma 2).
Functional Link: Dystrophin anchors internal actin filaments directly to the trans-sarcolemmal glycoprotein complex.
MUSCULAR DYSTROPHY
Duchenne Muscular Dystrophy (DMD):
Dystrophin protein is completely absent from muscle.
Severe clinical course, usually fatal by age 30.
Becker Muscular Dystrophy (BMD):
Milder form of the disease.
Dystrophin is present but altered in structure or reduced in quantity.
EXCITATION-CONTRACTION COUPLING (DHPR-RyR)
Skeletal Muscle :
Mechanical (Electromechanical) coupling.
Action potential travels down T-tubule \rightarrow activates DHPR \rightarrow direct physical conformational change triggers RyR on SR.
Source of Ca2+: 100% from Sarcoplasmic Reticulum (SR).
Cardiac Muscle :
Chemical coupling via Calcium-Induced Calcium Release (CICR).
Action potential opens DHPR → entry of extracellular Ca2+ from ECF → triggers RyR on SR to release massive internal Ca2+ → Contraction.
SARCOMERE STRUCTURE
Z-line (Zwischenscheibe): Boundary disc separating adjacent sarcomeres.
M-line (Mittelscheibe): Center/middle anchor point of the sarcomere.
A-band (Anisotropic): Dark band representing the full length of the thick (myosin) filaments.
I-band (Isotropic): Light band containing thin (actin) filaments only (no thick filament overlap).
H-zone (Heller): Bright central zone within the A-band containing thick filaments only (no thin filament overlap).
MECHANISM OF CONTRACTION & CROSS-BRIDGE CYCLE
1. Sequential Steps to Power Stroke
Ca2+ release into cytoplasm.
Ca2+ binds to Troponin.
Conformational shift of Tropomyosin exposes active myosin-binding sites on actin.
Myosin head binds to Actin forming a cross-bridge.
Power Stroke occurs \rightarrow muscle contracts.
2. Cross-Bridge Cycle States
Resting State: Tropomyosin blocks active sites.
Cocked State: ADP + Pi attached to myosin head.
Cross-Bridge State: Ca2+ presence allows myosin to bind to actin with ADP + Pi.
Power-Stroke State: Release of ADP + Pi swivels myosin head, pulling actin filament toward M-line.
Release State: Binding of a new ATP molecule causes detachment of the myosin head from actin
SMOOTH MUSCLE CHARACTERISTICS
T-tubules: Absent (replaced by Caveolae).
Z-line: Absent (replaced by Dense bodies).
Actin & Myosin: Present.
Troponin: Absent (replaced by Calmodulin for calcium binding).
Tropomyosin: Present.
Nebulin & Titin: Absent (both present in skeletal muscle).