Mega geography final exam flashcard set - updated 8/10/25
1/117
There's no tags or description
Looks like no tags are added yet.
Name | Mastery | Learn | Test | Matching | Spaced |
|---|
No study sessions yet.
118 Terms
What is my country of origin, it’s location and why it is experiencing forced movement
Sudan
Central eastern Africa
civil war
What is my host country, it’s location and why it is experiencing movement
Central African republic (CAR)
forced immigration - movement of people from their homes due to circumstance when they have little or no choice but to leave their residence, happens when person's safety, livelihood, or freedom is endangered, compelling them to move for survival.
medium-low agency
push and pull factors of migrating form Sudan to the central African republic
Push | Pull |
Civil conflict Local & National instability High unemployment – limited growth in labor-intensive sectors High pop growth Poverty, deprivation Food insecurity Climate – leads to low agricultural productivity | Refugee communities, formal & informal settlements Low cost of migration |
Interconnection between Sudan and the Central African Republic (CAR)
Political: both experienced long periods of internal conflict (civil wars, rebellions from ethnic tensions, resource competition.
Conflicts spilling into neighbouring countries, and vice versa as well as weak governance
Religious: Both have significant Muslim populations. CAR, minority whilst in Sudan its dominant |
No. of people that travel for holidays: Sudan – 836,000 in 2018 | CAR – 109,000 in 2018 |
Visa options: Tourist visa, Business visa, Transit visa
Physical: share a 174km border, porous border (lack of strong control from either gov)
Social: informal trading across border, illicit economies (drugs,weapons,natural resources), communities
Benefits and costs of moving to SUDAN and the Central african republic
| Benefits | Costs |
CAR | Rich in natural resources Growing workforce in agriculture & mining Economic growth < Cost of living | Extreme poverty Poor infrastructure (transportation, communication, healthcare) < Life expectancy |
Sudan | Natural resources Economic growth (gold mining) | Conflict Displacement Lack of essential services Environmental degradation |
What happens when sudanese people reach the central african republic
make a makeshift shelter, gender-based violence, limited access to resources, humanitarian assistance
DData relating to migration from Sudan to the Central Africal Republic
Immigration numbers over time: 30,000 (2024), 4,758, (2010), 20,329 (2005)
Population changes in the time period of migration: growth, 42,000 refugees since 2023 esp in northern regions
Location of Niger
17.6078° N, 8.0817° E
central north africa
capital is niamey
landlocked
neighbours are chad (east), nigeria (south), algeria (north-west)
human features
population: 24m
highest pop growth in the world
TFR: 6.8 babies per woman - worlds highest
CDR: 7.8 per 1000 people - has declined
42.9% of children 5-14 are children
90% of pop live on 1/3 of the land
natural features
80% of Niger is covered by the Sahara desert
strong spacial association between airable land & population
periodic drought over the last 40 years
main biome: desert and the savanna
trend in population structure
population growth
70% of population was < the age of 25
what poulation dynamics cause population growth
youth
>50% of all children 7-16 are NOT enrolled in school
60% of girls complete primary school, < in rural areas
< 1/10 of girls attend secondary schools
early age of marriage:
28% of girls married before they’re 15
76% before they’re 18
legal age of marriage is 15
encouragement to have large families because of popular conservative type of islam
Locall response to food insecurity & what does it do
Gobro cereal bank funded in 2007
lets families take from cereal bank during the lean season & pay back when they’re making a profit seasonally
prevents starvation & malnutrition (1.9 million malnourished children in 2023)
prevents travel by long distances for food
Positive outcomes for the food bank
Reduces malnutrition and starvation for the whole community
protects vulnerable children, large young dependency ratio
412,000 children with severe acute malnutrition
What’s a challenge for the local food bank
Management issues, because of high illiteracy rates and lack of education as a whole - many children, especially girls, are not enrolled or drop out early
National response to high young dependency ratio
National family planning costed implementation plan (NFPCIP)
Government policies with costed implementation plans (CIP’s)
started in 2012
which are multi-year roadmaps what reflects the gov’s priorities to achieve better family planning and reproductive health outcomes
What does the costed implimentation plan target
aims to raise modern contraceptive prevalence rate (mCPR) from 21.8% in 2020 to 36.8% by 2030
What are the strageties used by the government to raise the mCPR
expand community-based distribution of contraceptives
train health workers in post-abortion and postpartum family planning
promotes long-lasting reversible contraceptives (implants and IUD’s)
How is the gov implimenting strageties
using quick results like 100-day projects to show rapid gains
monitor indicators tied to maternal health, child survival and education outcomes
What is a geospatial technology being used to evaluate high youth dependency ratio
GIS - National statistics institute of Niger (NSI) with National community health workers (CHW)
uses GIS to model travel time access to heath facilities, and identifies wher future CHW should be located to improve health service delivery and resource allocation.
RESULTS: increased access for 22.3 million people (2000-2013)
What layers are used in the GIS model of niger
where health facilities are located and realistic travel times
satellite data (settlements, rivers, land cover, elevation)
population grids
Pros of geospecial tech
results in better access to healthcare
helps visualize and give importance to high youth dependency ratio
identifies “cold spots”, areas where women/girls have little to no access to reproductive health services
data is easy to read for policy makers
Cons of geospatial tech
cost and time
Data could contain errors or misrepresented areas - last census was in 2012
What does SALTS stand for
Title, Axes, Labels, and Scale, source
Environmental Drivers for food insecurity
Soil degradation (enviro)
>100,000 km2 of land is affected by desertification
63% of nigers pop depends on degraded land
topsoil loss has cut cereal yields by up to 30% in some regions
lowest rainfall in 30 years in june and july 2022
climate shocks
alternating droughts and floods
foods destroyed 24,000 ha of crops
kiled 25,000 livestock
affected 1.5million people
Social and political Drivers for food insecurity
Conflict & displacement (social/political)
over 600,000 people are internally displaced or refugees
because of armed conflict and insecurity from armed groups in diffa and tahoua.
disrupts farming, trade and humanitarian aid delivery
causes high food prices from poor harvests and coups
challenges of food insecurity
environmental degradation
food supply sustainability and movement
Local response to deforestation (ICF)
ICF (International Conservation Fund)
Founded in 2019, located South-East Amazonia, Brazil
protect land with:
guard posts that discourages potential invaders
create sustainable incomes with Brazil nut harvesting
annual income for kayapo communities
aim: To ensure Kayapo culture, economic, political and territorial autonomy.
outcome: kayapo have successfully defended their land, satellite images reveal no deforestation.
negatives
Potential conflicts with external interests
limited funding for long-term projects
reliance on consistent local governance
National response to deforestation (The forest code)
Forest code (national)
Introduced 1985
Updated from 1965-2023
Legally covers rivers, forests, soils
Enforced with inspections, sanctions (administrative and criminal)
aim: balancing agricultural land use as well as restoration of degraded areas
to conserve biodiversity
outcome: critics argue that the revised Forest Code has led to a decline in environmental protections and increased deforestation.
positives
claim to be “ensuring environmental protection”
Actively monitoring deforestation through rural environmental registry (CAR)
negatives
reduced required forest cover on private land from 80% to 50%
code has been difficult to enforce
increased deforestation, loss of up to 190 million acres of forest
unclear regulations and inadequate support for sustainable practices
conflicts with local communities
Global response to deforestation (REDD+)
Redd+
Introduced in cop19
Purpose: incentivizing developing countries to reduce greenhouse gas emissions by preserving their forests
Stands for reducing emissions from deforestation and forest degradation
Aims:
reduces emissions from conservation of forest-carbon stocks
sustainable management of forests, enhancement of forest carbon stocks
Outcomes:
projects have led to significant carbon storage and improved livelihoods, others have yielded mixed results
failure to create a large-scale funding mechanism
not successful, why
Impacts on wellbeing in local communities have been mixed
Deforestation is still a significant issue
backlash from political groups in favor of weaker environmental policies
lack of transparency
difficult to assess overall effectiveness
Geospatial (global forest watch)
Global forest watch
Geospatial technology program (GIS, GNSS, Remote sensing)
Established in 1997 - established by world resources institute (WRI)
Started as a network of NGO’S, Worked its way up by working with governments to address changes with deforestation
Aim:
Detect illegal gold mining and logging
To provide precise information
Track fires
Outcome:
increased awareness of deforestation trends
enhanced decision-making by governments and organizations
the potential for more effective forest protection and restoration efforts
good because
Satellite-derived alerts
indicates areas of potential deforestation/tree cover disturbance
based on LANDSAT (land satellite) imagery
help monitor forest health
provides detailed mapping at a global scale
real-time monitoring
accessible on the internet
identifies large-scale events
Location ( relative and absolute ) of brazil
14.2°S, 51.9°W
Central-eastern part of south America
Bordering the Atlantic ocean
North east of Bolivia
What is Deforestation
the conversion of forest to other land use independently of whether human-induced or not
Human characteristics of Brazil
Speak Portuguese, spanish, english
pop concentrated on south eastern coast
major cities: sao paulo, rio de janero, brasilia (capital)
pop 211.1 million
305 distinct ethnic groups
Geographic characteristics of Brazil
60% of Brazil is the amazon basin (1.5 million miles2)
60% of brazil is rainforest
12.2% of world forests are in brazil
tropical rainforests
2.9m km2 of forest
Characteristics of deforestation
Climate change when forests are located between HCO and LGM
habitat loss
increased soil erosion
climate change exacerbation and biodiversity decline, often driven by agriculture
urbanization
mining
Human and natural causes for deforestation
human
Agricultural expansion
Projects to improve infrastructure
Poor forest management
Wars and civil distribution
Pursuit of economic development
natural
Insects, pests, diseases
Wildfires
Short term: Storms, drought, landslides, volcanos
Long Term: Climate change
Interconnection between human and natural causes
Overall, human activity is the driver of deforestation
Human activities are speeding up natural climate change
Human disturbances like selective logging and land clearing, forest edges become more prone to natural disturbances
Clearance areas for agriculture and cattle ranching are more susceptible to fires
Causes for deforestation (agricultural expansion)
responsible for 73% of global deforestation
supported by government subsidies to promote food security
cattle ranching accounts for 80% of forest clearing in the Brazilian rainforest
Causes for deforestation (poor forest management)
lack of workforce capacity to enforce laws
international criminal police organisation (INTERPOL) estimates forestry crimes total 51 billion USD - $152 billion USD per year (3/4 of this comes from Indonesia and Brazil)
high corruption because forest products provide high financial rewards
logging licenses often encourage rapid wasteful exploitation for short term financial gain
Causes for deforestation (wildfires)
affects about 3% of global forest area each year
primarily in dry temperate & tropical regions
e.g australia, canada, chile, greece
some forests naturally regenerate after a fire, or even depend on fires to regenerate
Causes for deforestation (pursuit of economic development)
underlying driver for deforestation
as countries develop economically, deforestation occurs rapidly
event in warmer climate
forest dieback has been documented n every vegetated content over the past three decades
impacts of deforestation on the economy
Brazil could face losses of $317 Billion per year if amazon deforestation continues - short term gain for individuals
non-timber forest products need forest ro survive (rubber, Brazil nut and açai) - contributes income to 6 million households in Brazil
forest sector makes up 1.2% of brazils GDP - most of deforestation that happens is illegal
impacts of deforestation on society
social
indigenous communities - 422 indigenous reserves, 700,000 indigenous people live in reserves
deforestation on indigenous lands has increased by 129% between 2013 and 2021
health - air pollution = respiratory issues
vulnerable groups will me harmed more, long term effects from toxic pollutants can cause cardiovascular diseases and premature death
impacts of deforestation on the environment
environment
biodiversity - 3 million species live in the amazon rainforest
estimated 137 plant, animal, insect species lost in amazon east year
waters absorbanccy is reduced, as well as quality and increased erosion
adding to climate change - reducing carbon sink, less trees to take in more carbon
Location of japan
East Aisa
36.2° N 138.2° E
Population statistics
124 million
‘hyper-aged’ - >30% of citizens are over 65
median age is 48 - nearing post reproductive years
aging and declining pop
uneven distribution of pop - higher in the south
capital city is tokyo - 13 million people live there
literacy rate is 99%
highest average life expectancy in the world - 88 for women & 81 for men
Geographic features
made up of around 6800 islands
¾ is mountainous because of tectonic plate movement along pacific ridge
temp is temperate, varies from north to south
37,000 square kilometers, which is about 120th the size of Australia
What is causing the shrinking & aging population (population dynamics data)
current DTM stage: 5
peak pop was 148 million in 2010
pop pyramid went from: pyramid to coffin
BR: 6 per 1000 people
DR: 12 per 1000 people
TFR: 1.21
IMR: 1.50 (good healthcare)
LE: 84 yrs
pop growth rate: -0.4% (2024)
About the smaller workforce in Japan
Workforce has been declining since 1995
because of aging population
less people contributing to the economy
Social drivers for a smaller workforce
Social/cultural drivers
low birth rate - 6
high life expectancy - 84
work habits - 11% of employees work >60 hours per week (8 hours each day w/ no weekends)
family-based support for the elderly means less time at work, making money and contributing to the economy
Traditional gender roles - women leave the workforce once they get married and have children
What is the population trend in japan
Aging and shrinking population
One issue the population faces becuse of shrinking & aging population
smaller work force, smaller domestic market, less women having children
Context for smaller work force
Employment-to-population ratio is 60.2% in 2024
minimum mandatory retirement age is 60
uneven old age dependency ratio
working-age population fell 13% (from 87.3 million in 1995 to 73.7 million in 2024)
low immigration - represent only about 2% of Japan's population (approximately 2.93 million people in 2020)
Only about 11% of Japan's land is arable
Context for smaller domestic market
smaller population directly results in a smaller domestic market and less demand for goods and services, negatively impacting the country's Gross Domestic Product (GDP)
Context for women having less children
Childbearing in Japan is strongly linked to marriage, but marriage rates are falling
average age of marriage for Japanese women has increased to 29.9 years. This results in fewer reproductive years to have children
Long working hours - averaging up to 60 hours per week for employees
11% working > 60 hours
More than 50% of women stop working after the birth of their first child
husbands contribution to household tasks never exceed 5.3 hours per week on average
husbands have estimated 1 hour of childcare contribution compared to 3 in the USA and Germany
what are the challenges faced because of the smaller work force, smaller domestic market, less women having children
WF -Increased Elderly Dependency Ratio - elderly dependency ratio increased rapidly
7 economically active individuals supporting each person over 65 in 1985
2.8 in 2010
projected to fall to 1.7 by 2035
less government revenue from taxation
Benefits for the aged account for about 70% of Japan's total social security expenditure
exceeds ¥2,200 billion annually and is expected to grow
proportion of the 0 to 14 age group has significantly reduced, almost by one-third between 1950 and 2020, to 12%
What’s a response to Increased Elderly Dependency Ratio
self-driving tractors using GNSS (geographic navigation satellite systems)
first automatic tractor was made in 2017
updated in 2020 with x-tractor (which uses AI)
11,000 units were sold in 2024
38% of tractors sold in 2024 are semi-automatic
costs between $160-$250 AUD NEW
operated with supervision
provides accurate plowing, seeding & fertilization
How has the Kubota tractors affected the environment
Environ Factors
reducing waste or runoff of fertilizers
how has the Kubota tractors affected the economy
Economic factors
significant investment - $160,000 and $250,000 Australian Dollars.
reduce the labor needed in the fields - lead to cost savings for farmers by lowering labor expenses
Improved Efficiency and Accuracy - X-Tractor model, updated in 2020, uses AI to achieve accuracy between 1-5 cm, leads to more efficient use of resources and potentially higher yields
how has the Kubota tractors affected the social
Social factors
Response to Aging Farmers - helps alleviate the physical demands of farming
average age of Japanese farmers increased from 51 years in 1980 to 65 years in 2020, with 70% of farmers aged 65 years and over in 2020
Effectiveness (SAFFEIT)
sustainability - could prevent eventual runoff, keeps waterways healthy
accessibility - expensive (160,000-250,000 AUD), able to be accessed on phone
flexibility - precise between 1-5 cm accuracy using AI
fairness - using a retrofitted tractor ($17,000 AUD)
effectiveness - uses GNSS/QZSS (quasi-zenith satellite system) to reduce labor shortages
incentives - the profit from the more precise harvesting
time - reduces travel time to operate vehicle
How much of present-day land cover is: Forest
31% worldwide, unequally distributed
17% australia found primarily on the coast
temperate and tropical regions
How much of present-day land cover is: Grassland
40% worldwide, found in clusters
70% australia
between forests and deserts at subtropical latitudes
How much of present-day land cover is: Tundra
10% worldwide
0% australia
in and close to polar regions
all found 60° north
How much of present-day land cover is: Barelands
35% worldwide uneven and sparse
35% australia
tends to be in countries close to the equator
How much of present-day land cover is: Wetlands
6% Worldwide
6% Australia
found below the arctic and tropical regions and on the coast
How much of present-day land cover is: Ice
10% Worldwide evenly in polar and arctic regions
made up of ice sheets, glaciers and sea ice
How much of present-day land cover is: Water
71% of the worldwide
How much of the earths surface was covered by ice during the LGM
8%
How much of the earth land surface was covered by ice during the LGM
25% during the LGM
11% Present-day
How much did the temperature rise near the south pole during the warm event
4°
How much of earths surface was covered in forest during the HCO
47% worldwide
Local response to melting glaciers and ice sheets (ilulissat hydroelectric project)
aim: replace diesel generated energy in green energy
uses meltwater coming from permafrost layers and glaciers
Located in west Greenland
started in September 2013
produced energy for ilulissat (pop of 4,500)
plants capacity is 22.5 megawatts
45k’s NE of town
turbines are as deep as 200m below surface
provides 20-30% of greenlands power
funded by gov
clean energy = less heat and less reliance on fossil fuels
National response to melting glaciers and ice sheets (tourism)
introduced in 2021 and ran throughout 2021-2024, post pandemic
aims to rebuild tourism post-covid-19 to distribute tourism seasonally and geographically
interconnected with broader national tourism to open new and larger
airports in ilulissat and nuuk
global tourism is projected to geow 13.3% per year from 2019-2026
Global response to melting glaciers and ice sheets (COP)
Conference of parties
under the UN framework convention on climate change (UNFCCC)
made up of 200 countries as of 2024
aims: to limit climate change at 2oC above pre-industrial levels
avg temp as risen 1.5oC since 1850 - more manageable than 2oC
Europe greenhouse gas pollution dropped by 18% in 2024
COP 26 (2021) was last chance to save planet from effects of more than 1.5oC warming
2015 Paris agreement was first time countries held themselves accountable - legally binding
Geospatial response to melting glaciers and ice sheets (PROMICE)
began in 2007 - 18 years of solid data now
ran by the department of glaciology and climate at the geological survey of Denmark and Greenland
monitors/assess’:
ice thickness
ice extent
signs of ice loss
mass loss on ice sheet specifically
change in ice sheet over time as a result of global warming
done by:
airborne surveys to gather data using LIDAR & RADAR (Light/Radio detection and ranging)
GNSS units used to measure ablation
automatic weather stations in Greenland
keeps well documented and open source database
Location (Absolute and Relative)
71.7o N, 42.6o W
In the north Atlantic ocean, off northeastern coast of Canada
Human characteristics
Speak greenlandic and Danish
pop concentrated on southwest coast
0.14 people per km2
56,000 population
major cities: Nuuk, sisjimiut & ilulissat
self governed
Geographic characteristics
Geologically apart of North America
1.71 million km2
80% ice
avg thickness of ice is 2km
max thickness is over 3km, central east
10% of earths ice
10% of earths freshwater
ice per km2 is 1.7
215 glaciers
HCO (Holocene climactic optimum)
warm period from 9,000-5,000 years ago, started 15,000 years ago after age age (glacial termination)
large ice sheets covering NA and Europe started melting
event consisted of 4oC increase near north pole
southern Europe experienced cooling
avg temp change declines rapidly due to latitude
why?
Milankovitch cycles - change in earths orbit = increased solar radiation in the horthern hemisphere
Greenhouse gas levels - co2 & methane concentration in the atmosphere began to rise due to human activities (deforestation & agriculture)
compared to today
temps warmer than now
tropics and parts of southern hemisphere were cooler than average
LCM (Last Glacial Maximum)
18,000-20,000 years ago
last ‘ice age’ where land ice was dominant
8% (today is 3% )of world surface was covered by ice (including land & sea ice)
25% (today is 3%) of earths land surface was covered in ice
sea level was approximately 112-125cm lower than today
surface temp was 4-6oC colder than average median temp
Cooling was distributed unevenly
Antarctica stayed the same
North Pole changed - ice formed over land meaning it melted quicker
forest cover was less expensive, climate caused cooler and drier rainfall
grassland became more widespread
africa had grasslands in the south & deserts in the north (closer to equator)
aisa had a mix of tropical deserts in the west, alpine deserts in the north
grasslands in indian subcontinent
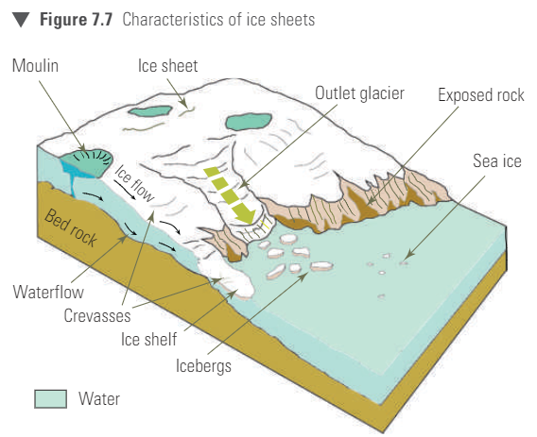
Anatomy of an Ice Sheet
Outlet Glacier
Ice Shelf
Icebergs
Exposed rock
Sea Ice
Moulin
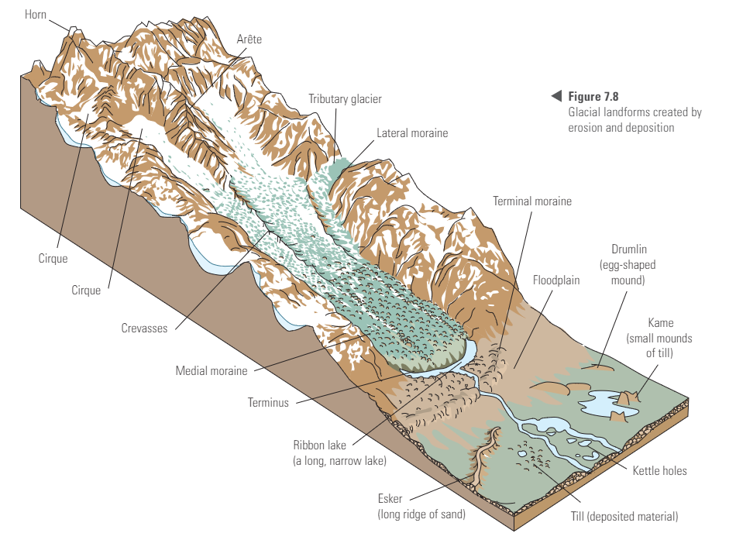
Anatomy of a Glacier
Horn
Arete
Terminal moraine
maternal moraine
Cirque
Calving
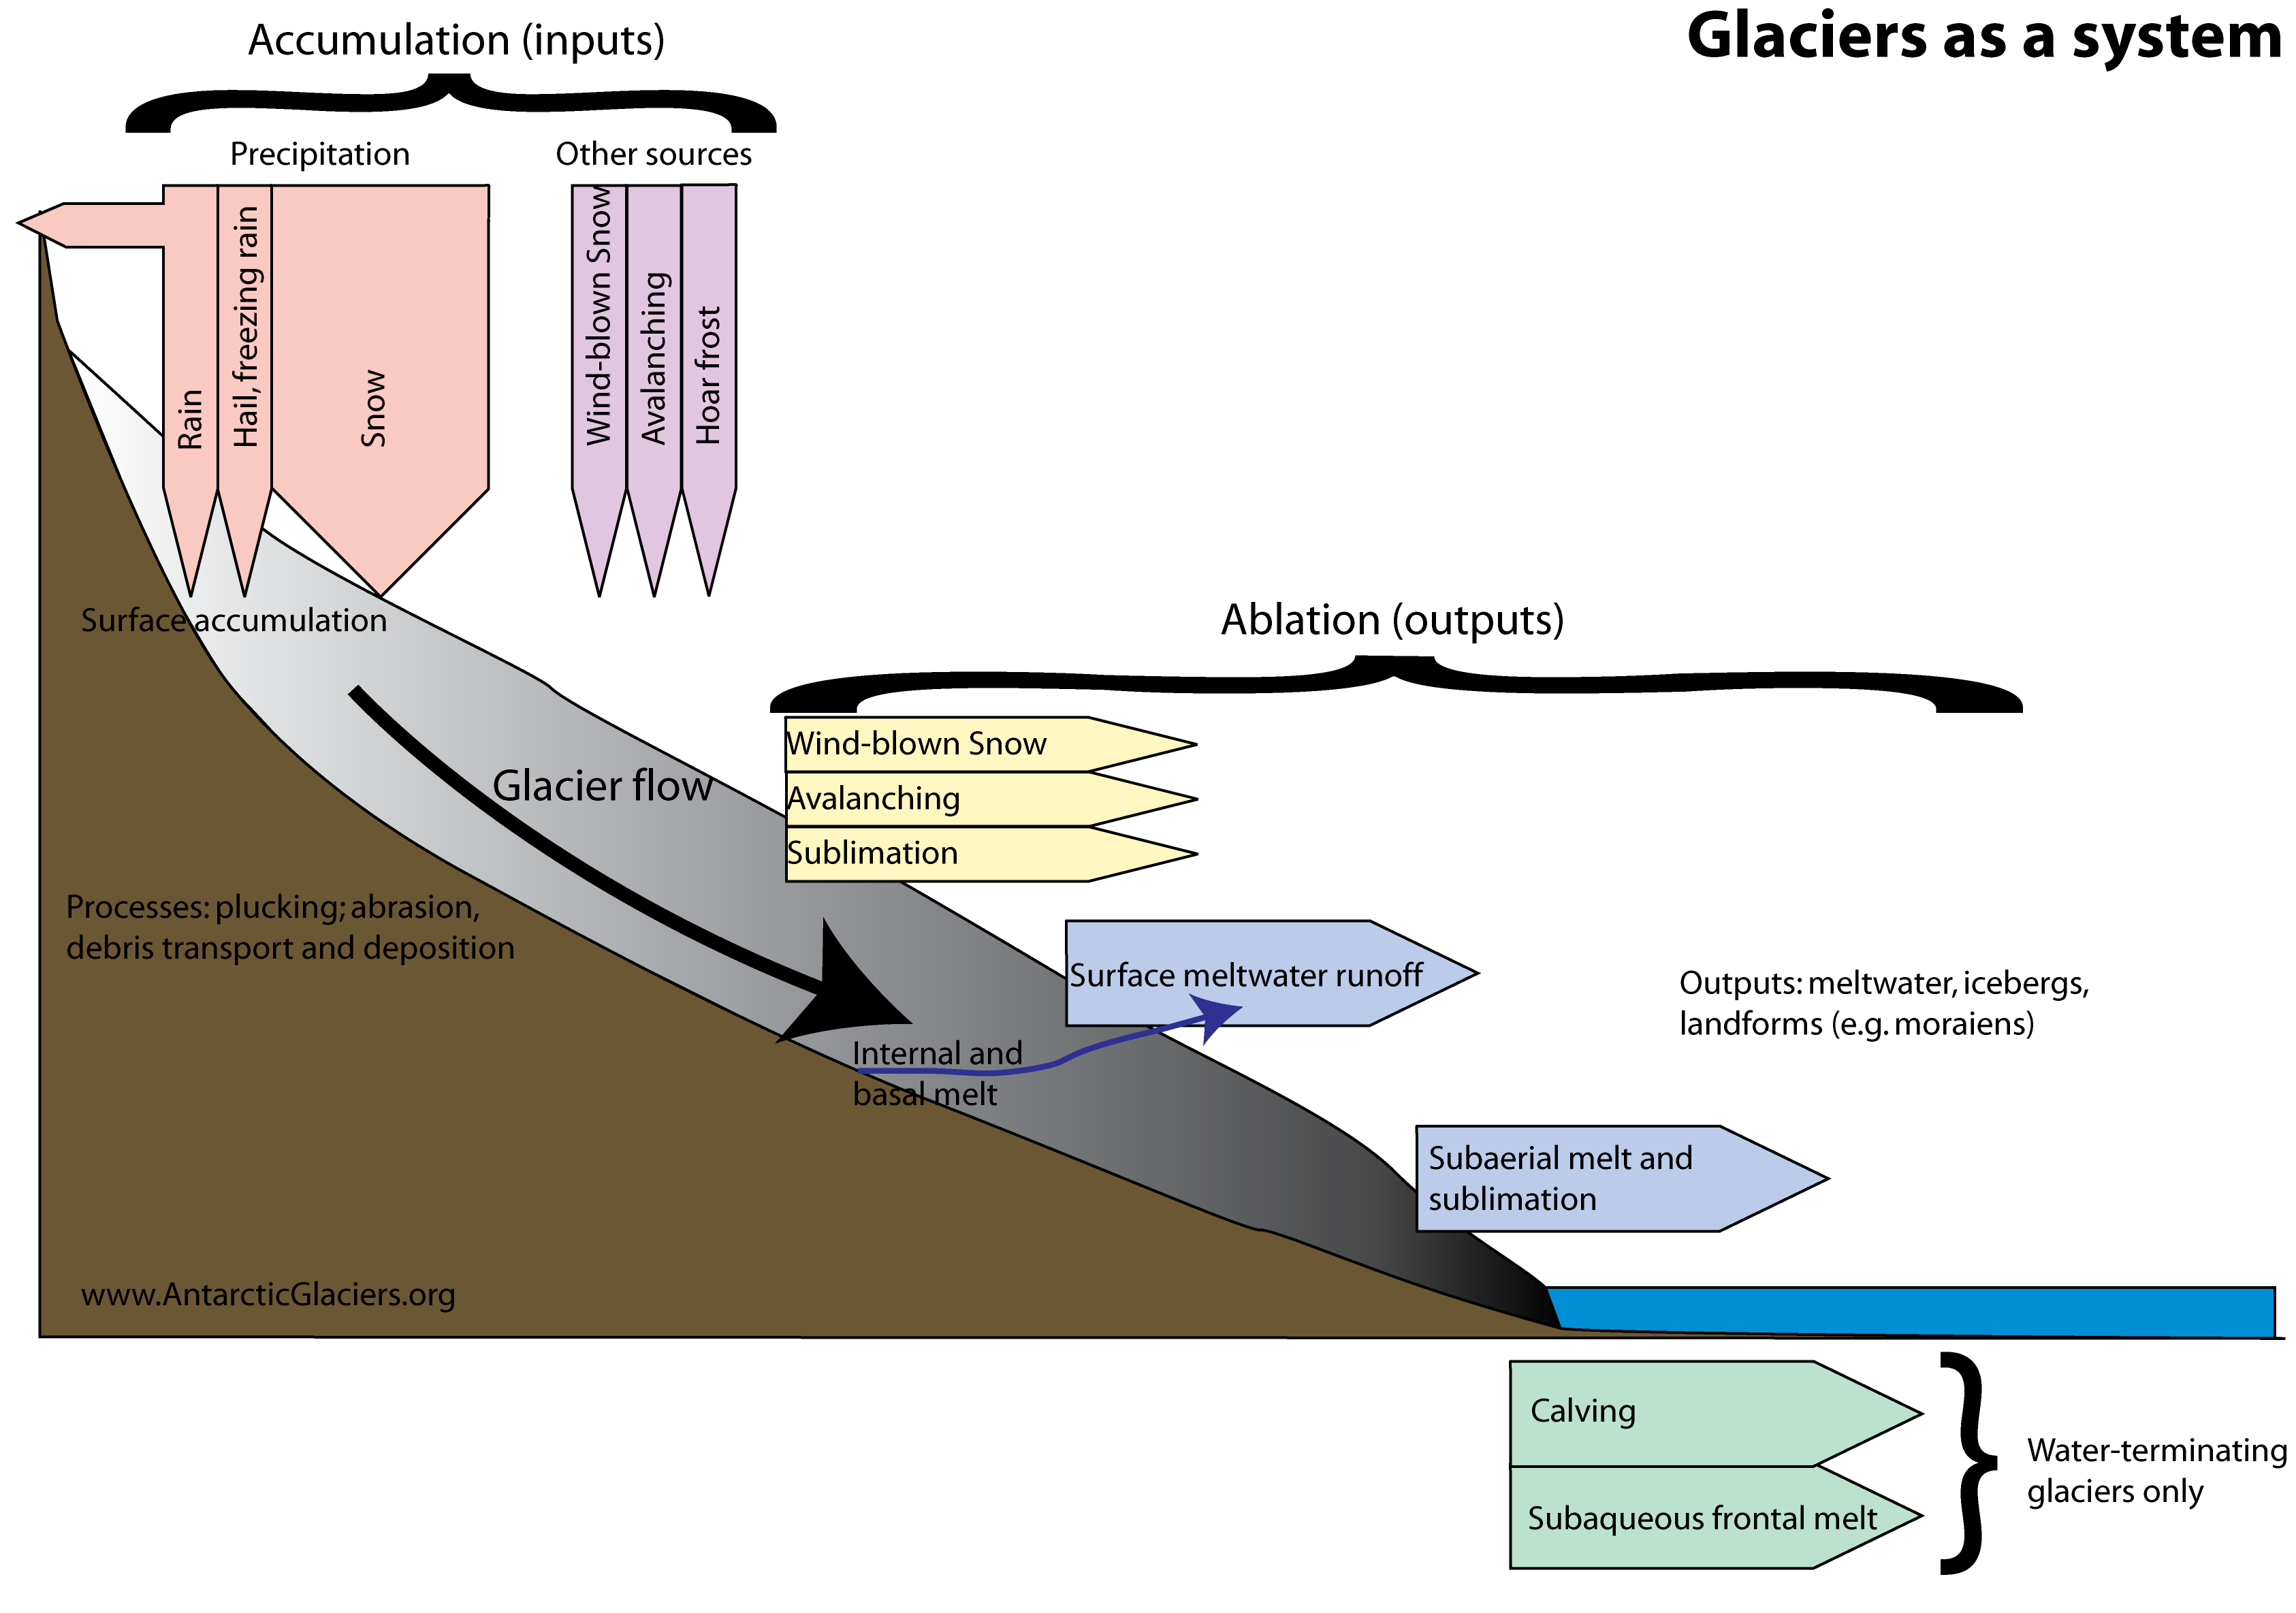
General process for melting
accumulation
temps are cold
snow collects, adds to mass
starts with first autumn snow
older snow compacts
ablation
mass starts to reduce (melting, calving or sublimation/evaporation)
starts late spring
warm air & sun melts snow and ice into water
calving happens, otherwise slow shrinkage
all new snow disappears from lower reaches of glacier
remaining snow form hard layer of firm
new equilibrium line is made
Human and natural causes for melting
natural
variation in solar energy
not consistent
milankovitch cycle correspond with periods of glaciation
volcanic activity
significant amounts of dust and gas ejected into the air = both warming and cooling
deep water currents
aka thermohaline circulation
driven by differences in water density due to temp and salinity
human
localized addition of heat
activities of everyday living into the atmosphere (industrial processes - heating, cooling, transport)
alteration of landscapes
changed in albedo (light refraction)
clearance of forests
urbanization
changed in soil moisture
Interconnection between human and natural causes of melting ice in Greenland
amplification
humans accelerate naturally occurring processes
like fluctuations of cold and warm periods
rate of melting that is faster than what would occur through natural cycles alone
release of more greenhouse gasses (co2) from burning fossil fuels has strengthened the natural greenhouse effect
human-induced warming is laid on top of the natural cycles - increasing global average temp
positive feedback loop
Ice reflects most sunlight back into space, helps keep planet cool
Ice melts naturally after ice age - darker ground exposed = absorbs more sunlight as heat - more melt
Humans cause initial melt from activities - natural melt is accelerated more with more ground exposed
Causes for melting ice sheets (plate tectonics)
redistribution of land masses change climates as continents move into different latitudes
changes sunlight reflection and ocean heat balance
long term process
Causes for melting ice sheets (increase in global temperatures)
human and natural
global temps have increased by at least .94oC since 1880
estimated 40% of ice in the arctic melting is due to warming
more ablation over accumulation
could be from volcanic activity or output of greenhouse gasses
Causes for melting ice sheets (cryoconite)
airborne material from industry, desert dust and volcanic particulate
melting is increased because it settles on ice pats
reduces albedo (light refraction) and accelerates melting
Causes for melting ice sheets (population change)
60% of all emissions come from cities
emissions come from reduction of forest of forest cover and mangroves (carbon sinks)
methane from thawing permafrost enhances emissions
421 ppm of co2, pre industrial co2 was 250 ppm
impacts of melting ice on the economy
economy (fishing)
warmer water brings different fish species - shrimp, cod, salmon
increase in fishing industry
large companies adapt better than small independent companies - struggle to buy new equipment (e.g bigger boats, nets, processing machinery, crab pots & trawlers)
fishing export has grown from 138 million USD (1980) to 470 million USD (2014) - 34 years
impacts of melting ice on the society
society
changing diets - replacing traditional foods (seal & whale) to imported food
- native fish are leaving because of increase of freshwater from melting ice
people leaving/migration - women aged between 15-25 leaving for education or better job offers and resources and more housing accessibility
average of 2,544 people leaving every year (data from 2012-2022)
impacts of melting ice on environment
environment
water salinity changing because of glacial meltwater
more land for agriculture - land increased 30%, no. of farms decreased by 20% both in the last 20 years
lack of nutrients in soil after melting means bad soil quality
rate of melting increased - 5x greater in last 20 years than pre-industrial levels
land cover (purpose, define)
define:
Area with specific regulations and rules governing the types of land uses
determine building activities and development permitted within it
purpose:
To regulate land use
protects resources
avoids conflicts between different land uses
land cover example
Residential
Commercial
industrial
agricultural
recreation
historic
example of property overlays
Vegetation protection
environmental significance
bushfire management
erosion management
flooding
design & development
difference between land cover and land use
land cover is what covers the surface, land use is how the land itself is used
what zones are in paynesville
General residential zones
public park & recreation zones
mixed use zones
industrial zones
public use zones
FZ zone (purpose)
farming zone
purpose:
to provide land use for agriculture
encourage use & development with sustainable land development practices efficient land use