describing and summarizing data of a variable
 Call Kai
 Learn
Learn Practice Test
 Spaced Repetition
 Match
Match Flashcards
 Knowt Play
1/13

There's no tags or description
Looks like no tags are added yet.
Name | Mastery | Learn | Test | Matching | Spaced | Call with Kai | Chat |
|---|
No analytics yet
Send a link to your students to track their progress
14 Terms
discreate variable
discrete variables are variables that take finite number of values
frequency distribution
frequency distribution visual summary that shows how often each value occurs in the dataset
what is the different type of frequency distribution
absolute frequency: the raw count of observations
relative frequency (percentage): the precent of observations for each value
cumulative percentage: the total percent of observations that fall below or above a certain
continues variable
continues variables are variables that have infante amount of values
types of ways to measure continues variables
discretization: grouping continues variables into “bins” to create relative frequency
probability density function (PDF): describes the relative likelihood for a random variable to take on a given value
cumulative density function (CDF): represents the probability that a variable takes less than or equal to the specific limit
measures of loction
Mean: average value
median: the exact middle value
mode: the most frequent occurring value
measure of variability
range: largest - smallest
variance: measures how sped out a set of numbers is from the mean
standard deviation: measure the average distance between individual data points
measure of shape
skewness: measure distribution asymmetry
Kurtosis: measures tail weight
normal distribution (z test)
the classic bell curve. Most data points cluster around the middle, while extreme values trail off evenly on both sides
t-distribution (t-test)
looks like a normal bell curve but fatter outer edges. Used when you have a small sample size, because small samples are more unpredictable and carry extra uncertainty
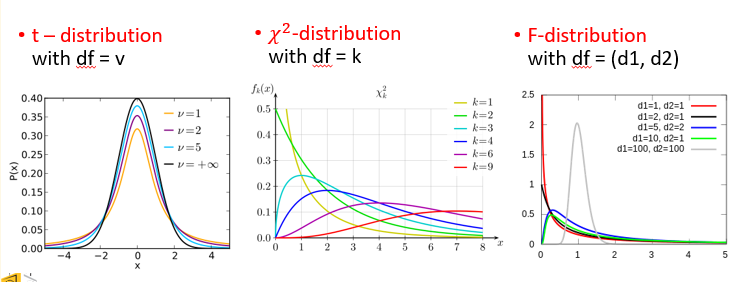
Chi-square distribution
Chi-square is an asymmetry curve that starts at zero and skews heavily towards one side. Use when counting categories instead of averages
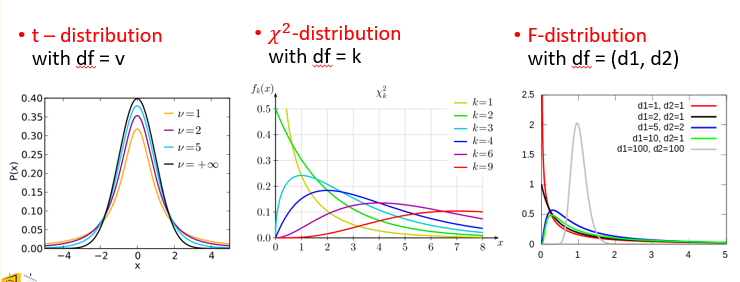
F distribution
F distribution is a skewed curve used when comparing variances or spreads across groups. Used when comparing three or more group at once
