AP Precalculus Formulas
1/8
There's no tags or description
Looks like no tags are added yet.
Name | Mastery | Learn | Test | Matching | Spaced |
|---|
No study sessions yet.
9 Terms
The domain
The set of input values(x) of a function represented by the independent values
The range
The set of output values(y) of a function represented by the dependent values
When the graph of f lies above the x-axis…
The function f is positive and the outputs (y-values) are greater than zero
When the graph of f lies below the x-axis…
The function f is negative and the outputs (y-values) are less than zero
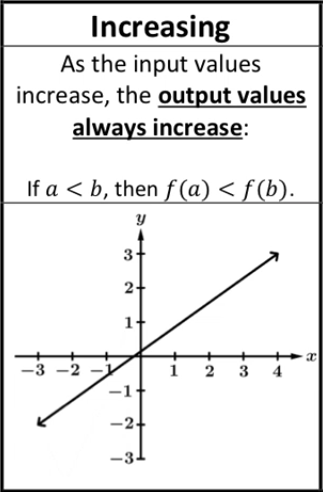
Increasing Graphical Behavior of a Function
As the input values increase, the outputs values always increase.
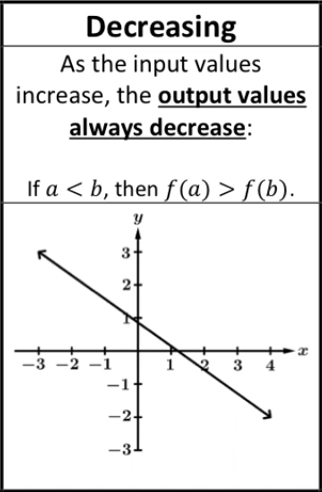
Decreasing Graphical Behavior of Functions
As the input values increase, the output values always decrease
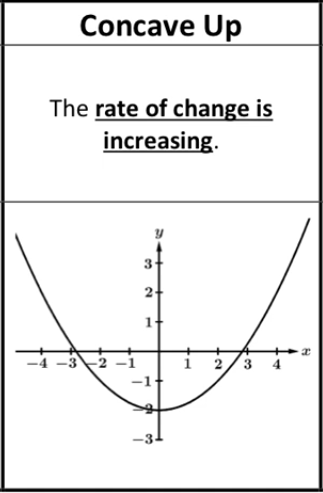
Concave Up
The rate of change (slope) is always increasing
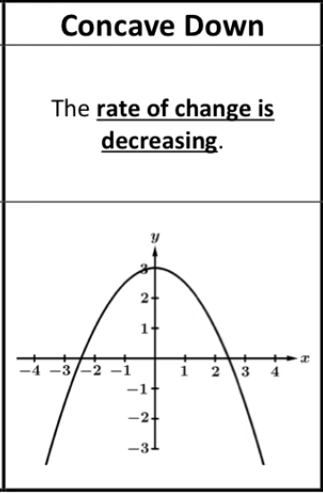
Concave Down
The rate of change (slope) is decreasing
Average Rate of Change (AROC)
f(x2) - f(x1)/x2 - x1