Chapter 4 - The Market Forces of Supply and Demand
1/46
Earn XP
Description and Tags
Name | Mastery | Learn | Test | Matching | Spaced | Call with Kai |
|---|
No analytics yet
Send a link to your students to track their progress
47 Terms
market
Group of buyers and sellers of a particular good or service
organized markets
markets for agricultural commodities like wheat and corn
less organized markets
much more common like the ice cream market
what are price and quantity determined by?
all buyers and sellers as they interact in the marketplace
competitive market
a market in which there are so many buyers and sellers that each has no large impact on price
perfectly competitive market
goods offered are exactly the same
so many buyers & sellers that no single buyer or seller has influence over market price
price takers
buyers and sellers that must accept the price the market determines as they cannot influence prices
monopoly
market where there’s only one seller who sets the price, facing no direct competition
quantity demanded
amount of a good that buyers are willing to buy
law of demand
claim that other things equal, the quantity demanded rises when price falls
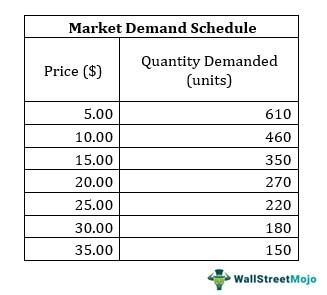
demand schedule
table showing the relationship between price of a good & quantity demanded (quantity demanded at each price)
demand curve
graph of the relationship between price of a good and quantity demanded
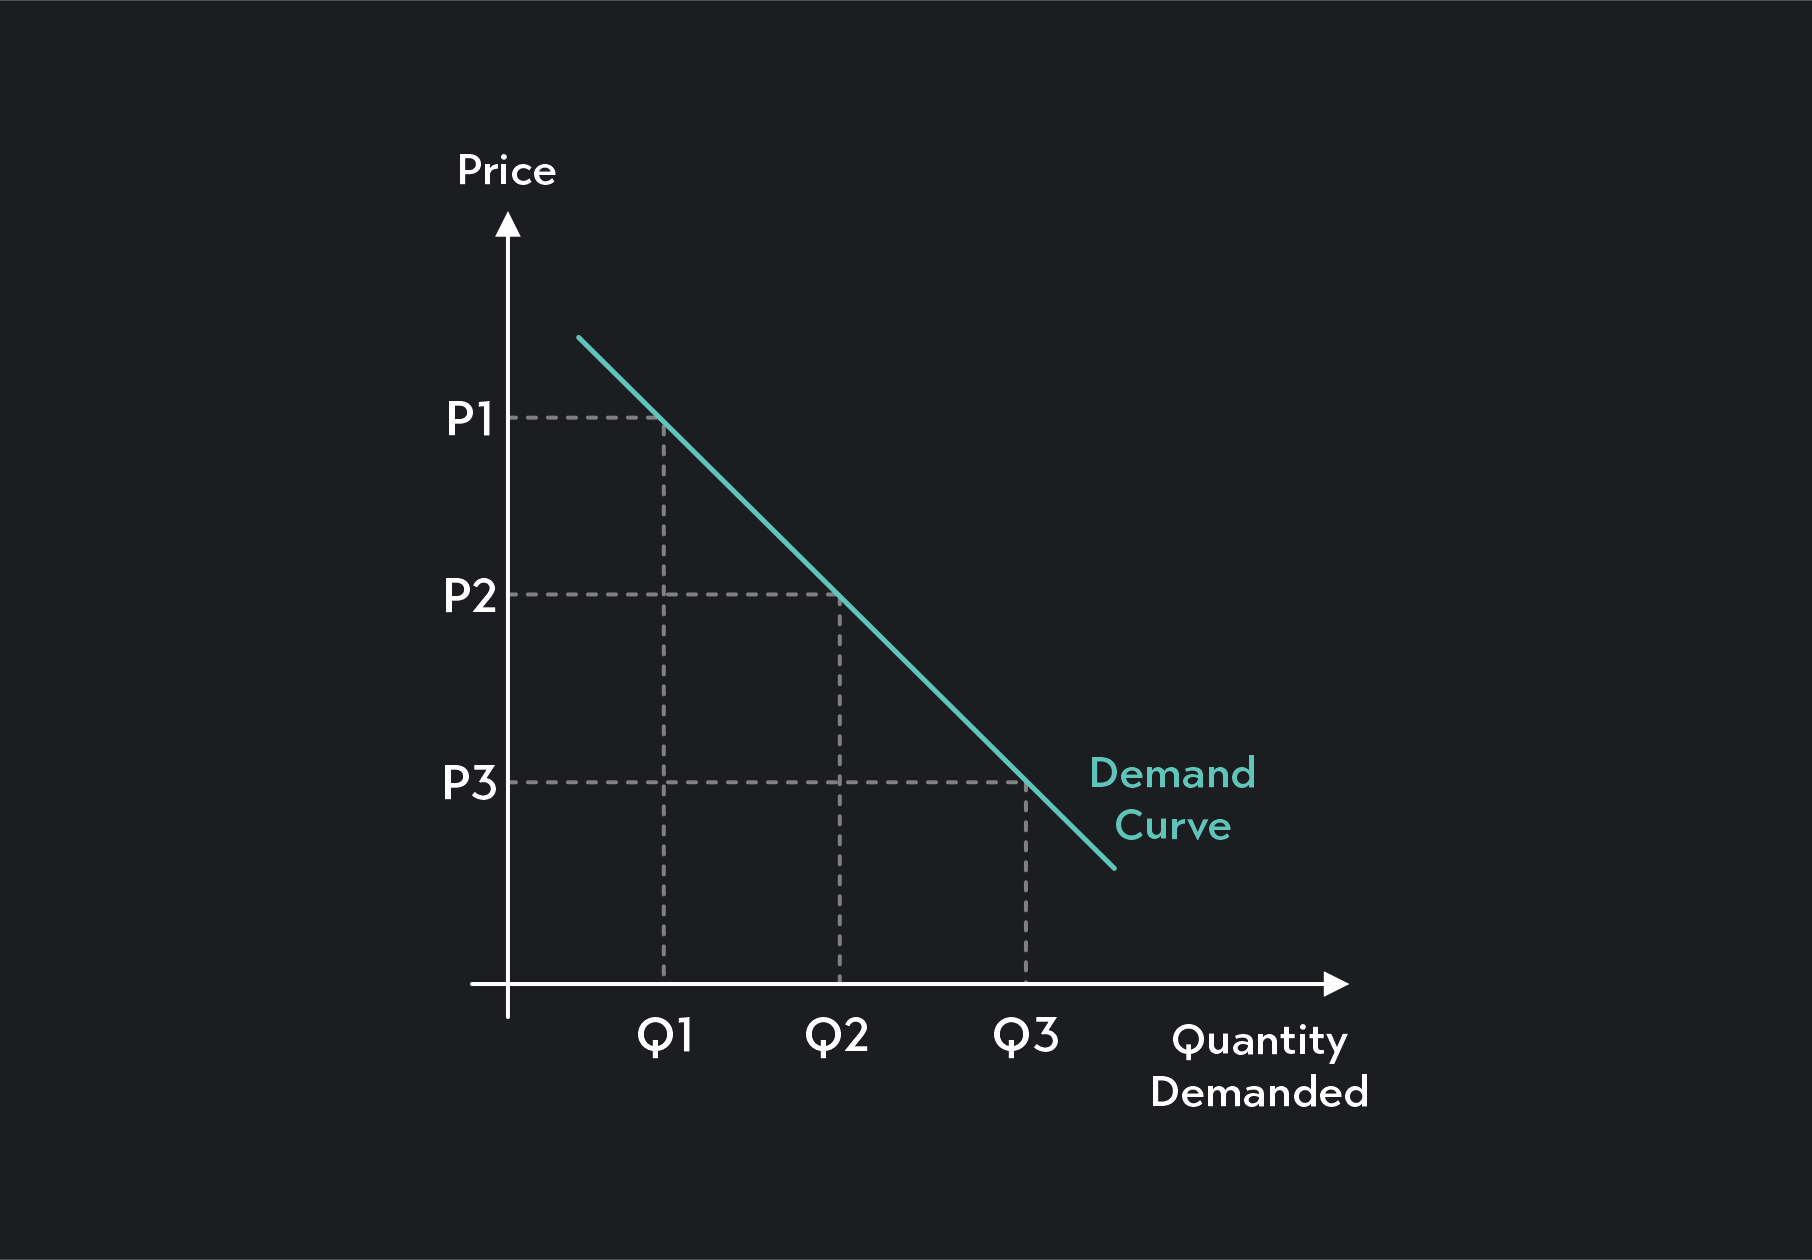
how does the demand curve slope?
downward
market demand
sum of all individual demands for a good/service (horizontal/x-axis values)
when there is an increase in demand…
demand curve shifts right
when there is a decrease in demand…
demand curve shifts left
what variables can shift the demand curve?
income, price of related goods, tastes, expectations and number of buyers
normal good
a good for which demand falls when income falls and demand increases when income increases
inferior good
a good for which demand rises when income falls, and demand falls when income rises (there’s better options)
substitutes
when a fall in the price of one good reduces the demand for another good, as consumers switch to the cheaper option (both goods satisfy similar desires)
complements
when a fall in the price of one good raises the demand for another (& vice versa); typically consumed together (cars & gasoline)
quantity supplied
amount of a good that sellers are willing or able to sell
law of supply
claim that other things equal, the quantity supplied rises when price rises
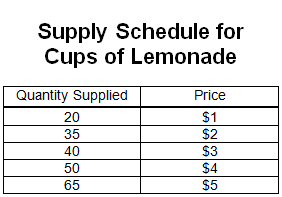
supply schedule
table showing the relationship between price of a good & quantity supplied (quantity supplied at each price)
supply curve
graph of the relationship between price of a good and quantity supplied
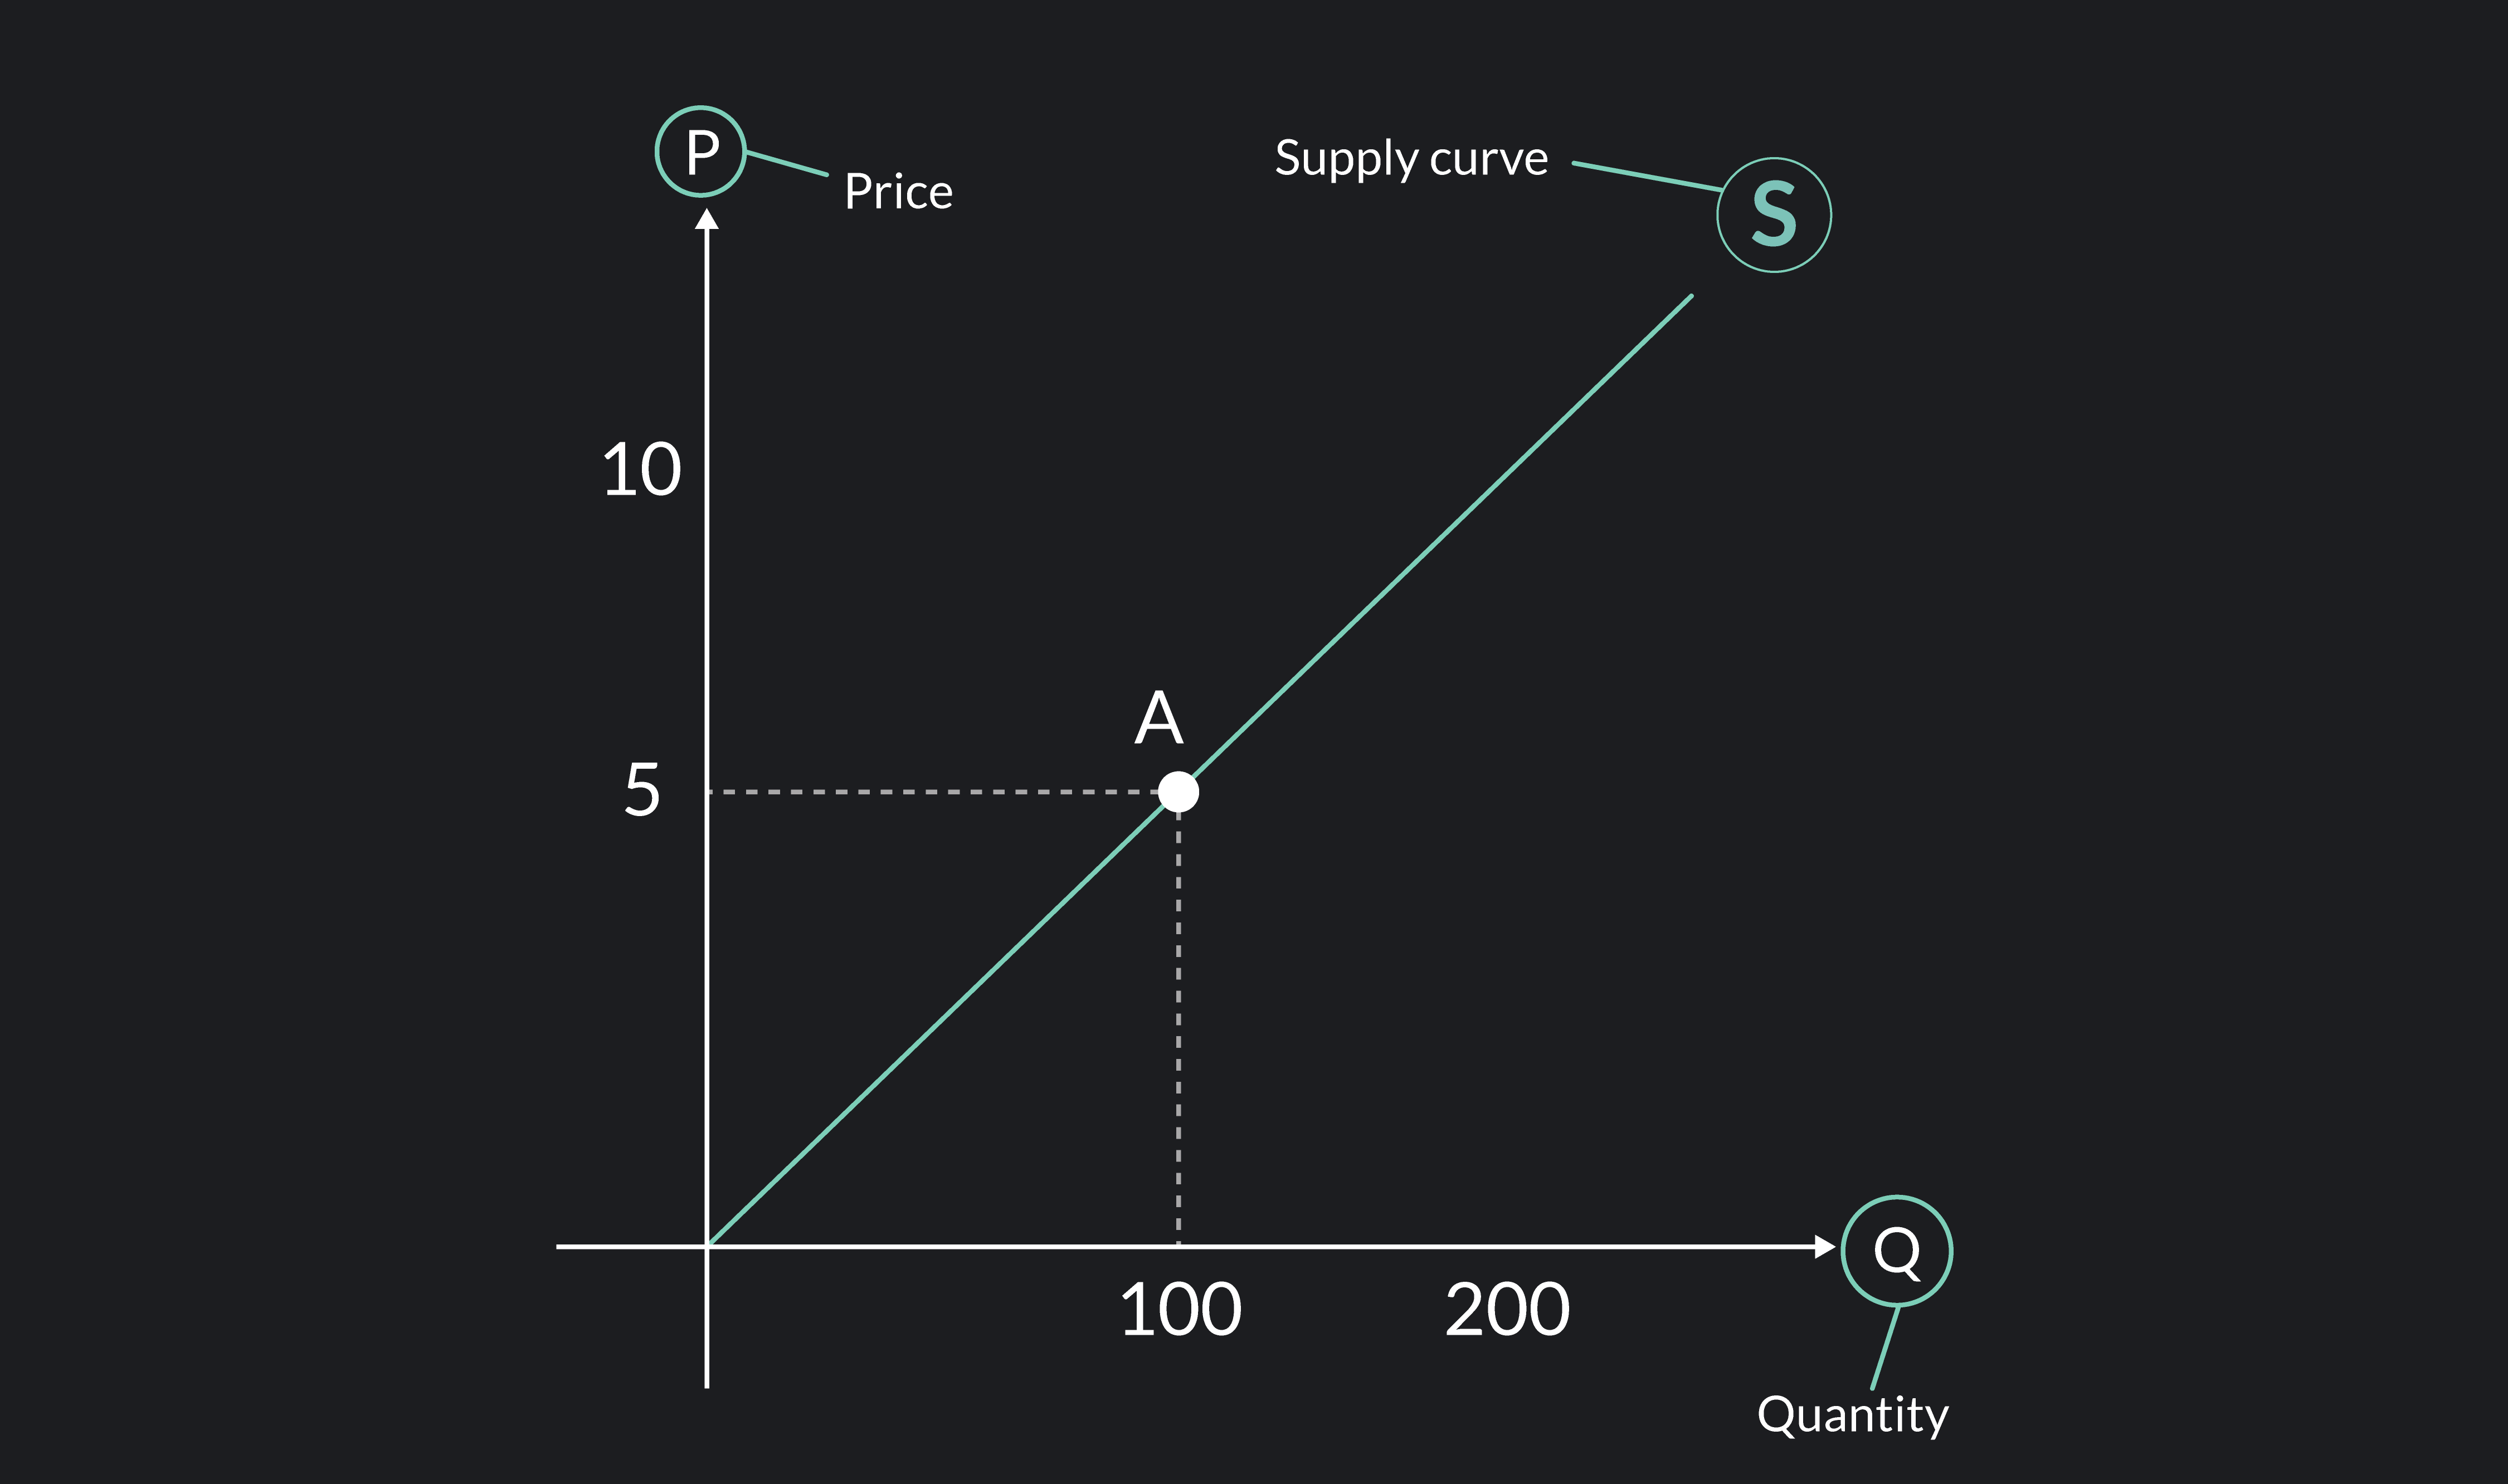
how does the supply curve slope?
upward
market supply
sum of all individual quantities supplied by sellers for a good or service
when supply curve shifts right…
increase in supply (increases quantity supplied @ every price)
when supply curve shifts left…
decrease in supply (reduces quantity supplied @ every price)
what variables can shift the supply curve?
input prices, technology, expectations, # of sellers
input prices
price of ingredients or resources required for production
cheaper input prices —> cheaper good to make —> supply curve shifts RIGHT
technology
technological advancements —> reduces labour —> reduces costs —> supply curve shifts RIGHT
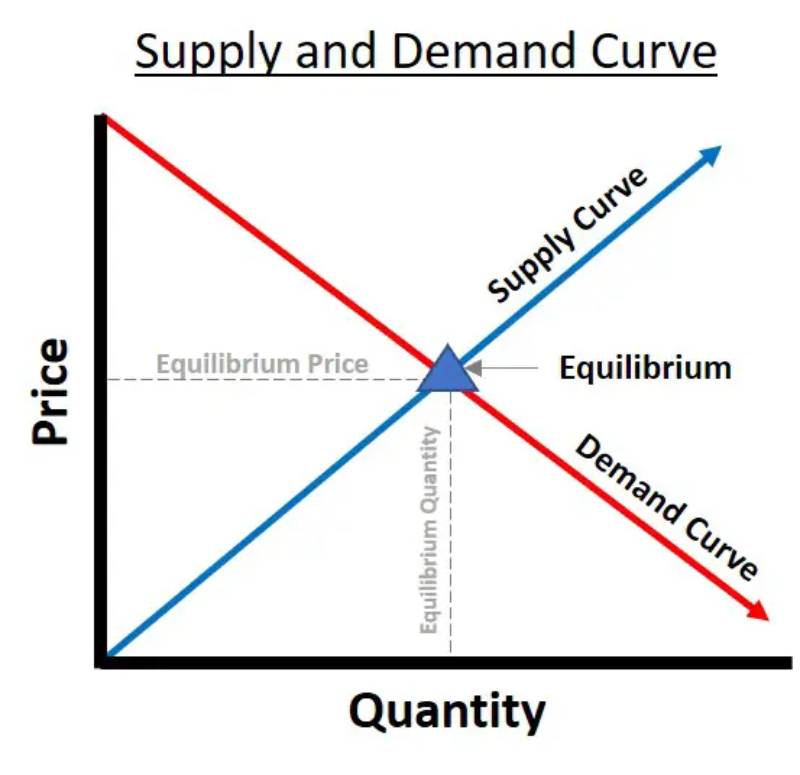
equilibrium
point where supply and demand curves intersect ; indicates market price at which quantity supplied = quantity demanded
equilibrium price
market price where quantity of a good supplied = quantity demanded
equilibrium quantity
quantity of a good demanded and supplied at equilibrium price
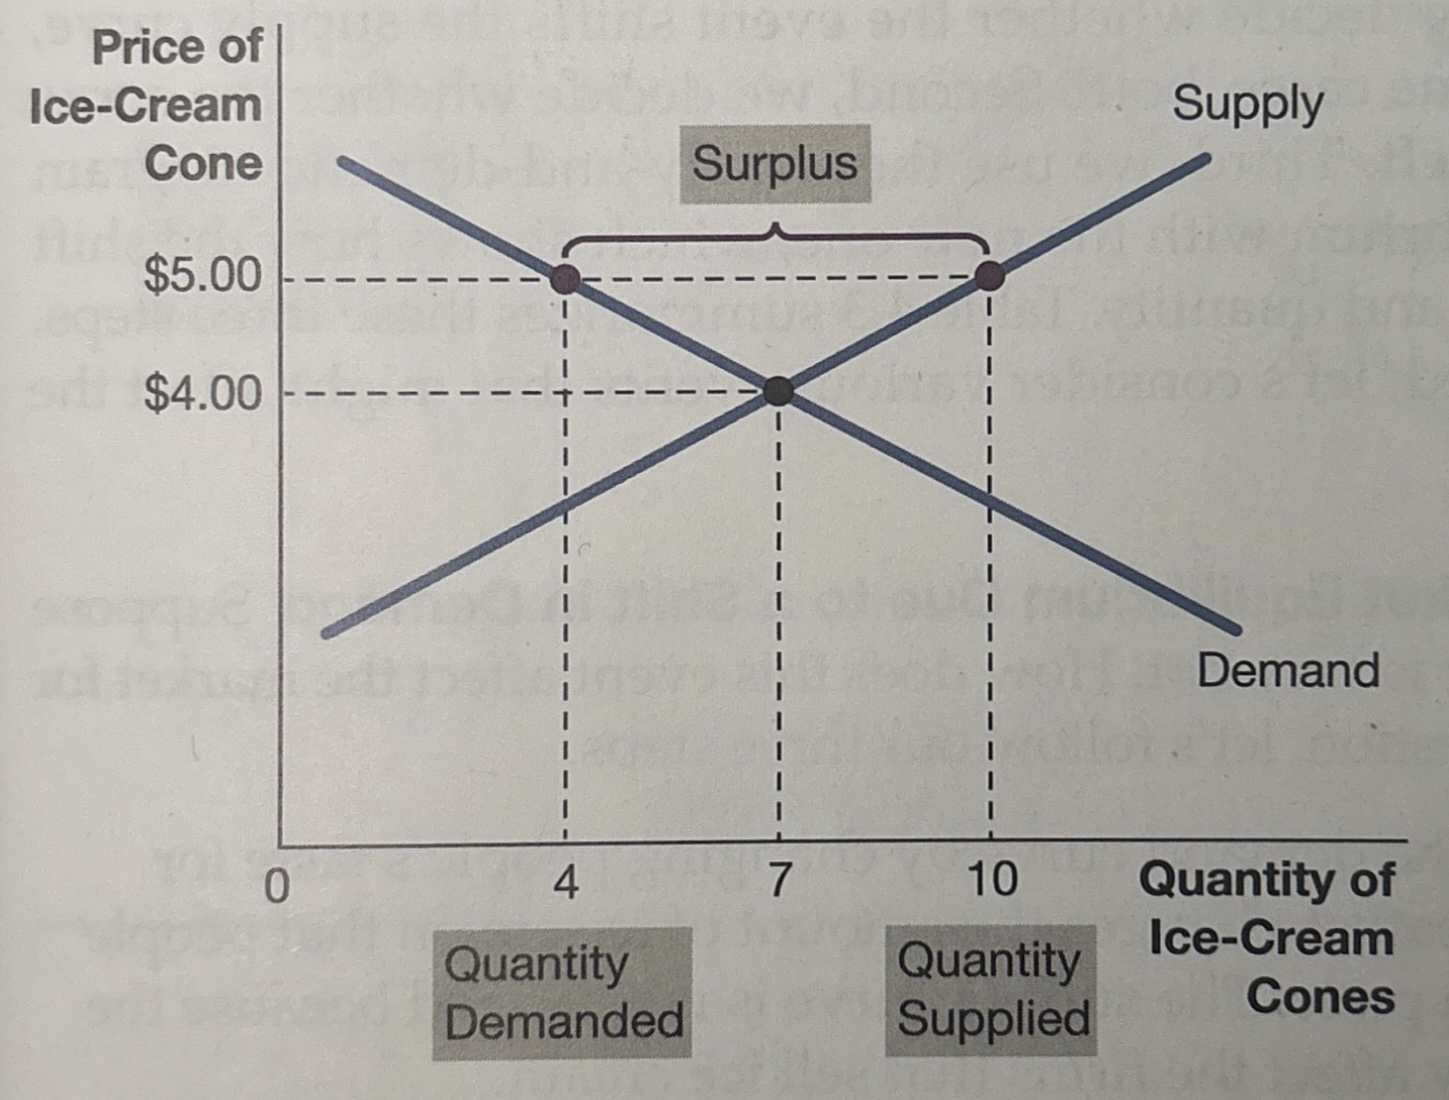
surplus
situation where quantity supplied is greater than quantity demanded
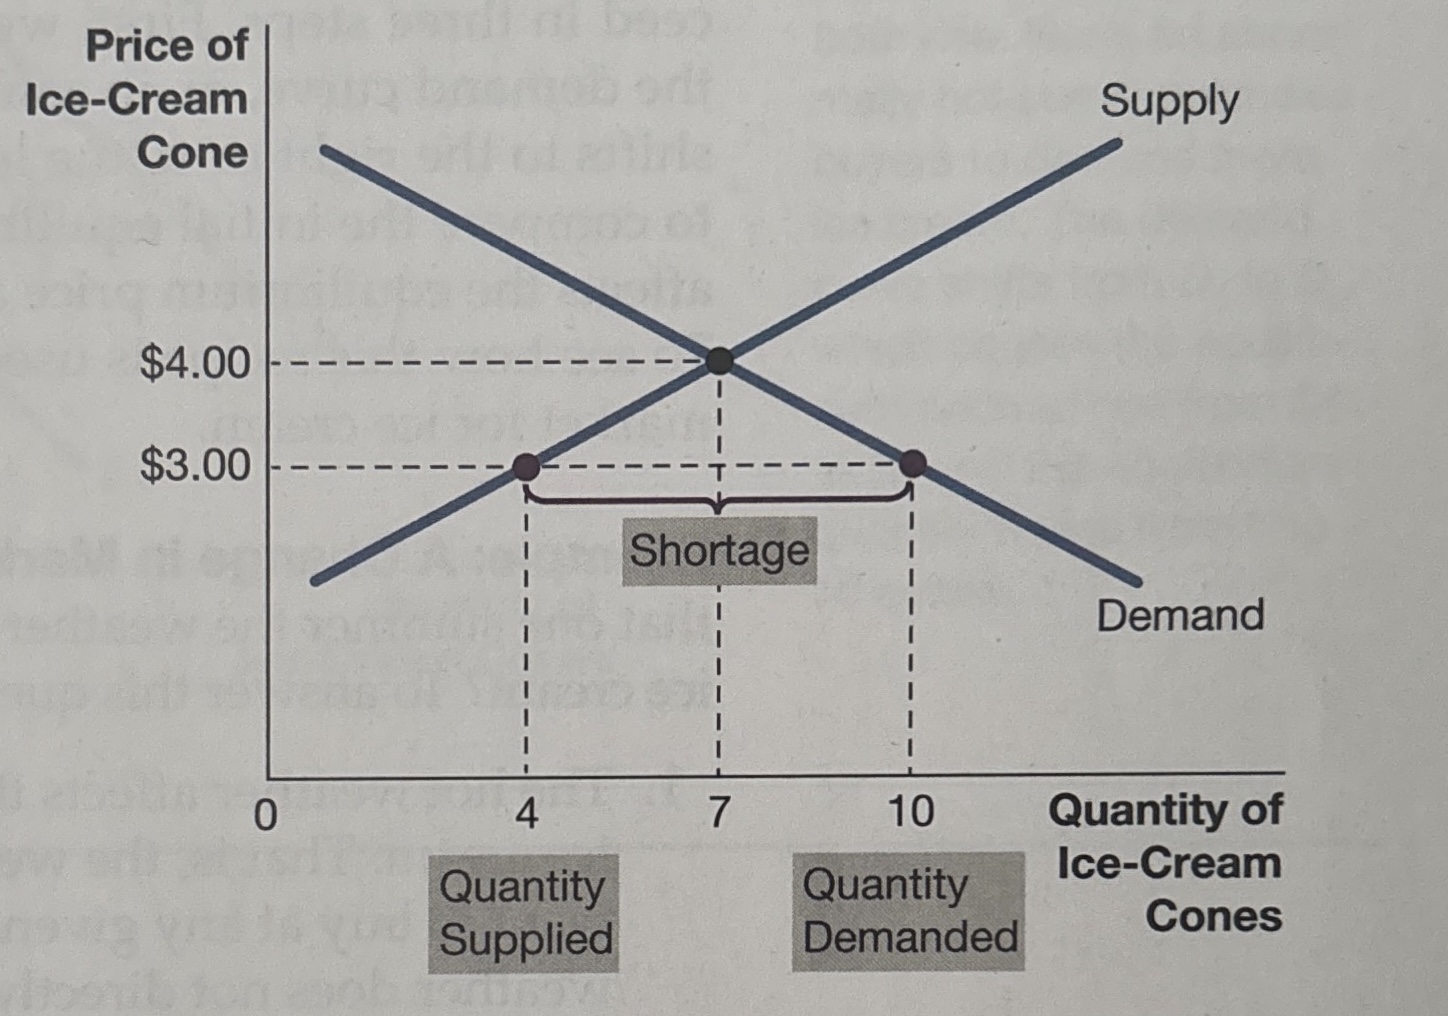
shortage
where quantity demanded is greater than quantity supplied (unmet demand for the good)
law of supply and demand
claim that price of any good adjusts to bring the quantity supplied and the quantity demanded for that good into balance
steps to analyze changes in equilibrium
determine whether event shifts demand or supply curve (or both)
decide in which direction curve shifts
use supply and demand diagram to see how shift changes equilibrium price & quantity
increase in supply means…
price falls, quantity rises
decrease in supply means…
price rises, quantity falls
increase in demand means…
price rises, quantity rises
decrease in demand means…
price falls, quantity falls
increase in demand and supply means…
price is ambiguous, quantity rises
increase in demand and decrease in supply means…
price rises, quantity is ambiguous
decrease in demand and increase in supply means…
price falls, quantity is ambiguous
decrease in demand and decrease in supply means…
price is ambiguous, quantity falls