Psych 100A Midterm 1 Study Set: Key Stats Terms & Definitions
1/82
There's no tags or description
Looks like no tags are added yet.
Name | Mastery | Learn | Test | Matching | Spaced |
|---|
No study sessions yet.
83 Terms
Which of the following is a continuous variable?
speed in miles per hour
3 multiple choice options
Which of the following is a discrete variable?
gender
3 multiple choice options
Which of the following variables is measured on an ordinal scale?
competition placing (gold, silver, bronze)
3 multiple choice options
Which of the following variables is measured on a nominal scale?
type of living accommodation (house, apartment, trailer)
3 multiple choice options
Which of the following variables is measured on a numeric scale?
price of dining hall meal
3 multiple choice options
Students indicated their perceived utility of the course using a 5-point Likert-type rating scale. Which level of measurement describes this variable?
quasi-interval
3 multiple choice options
A researcher s interested in studying the effects of sleep on college students' grades in the US. This researcher collected data from 100 UCLA students. What is the sample in this research?
100 college students at UCLA
3 multiple choice options
A researcher s interested in studying the effects of sleep on college students' grades in the US. This researcher collected data from 100 UCLA students. What is the population in this research?
college students in the US
3 multiple choice options
True or false? Nominal and ordinal variables can be discrete, but interval and ratio variables cannot be discrete.
false
1 multiple choice option
Which of the following variables is considered to be a continuous variable?
SAT scores
3 multiple choice options
A researcher asks you to report the number of minutes that you studied for your stats class yesterday. In this case, the researcher is measuring the variable of studying on a(n) ___________ scale.
ratio
3 multiple choice options
In frequency distribution, which quantity describes the number of respondents providing a particular response?
count (frequency)
2 multiple choice options
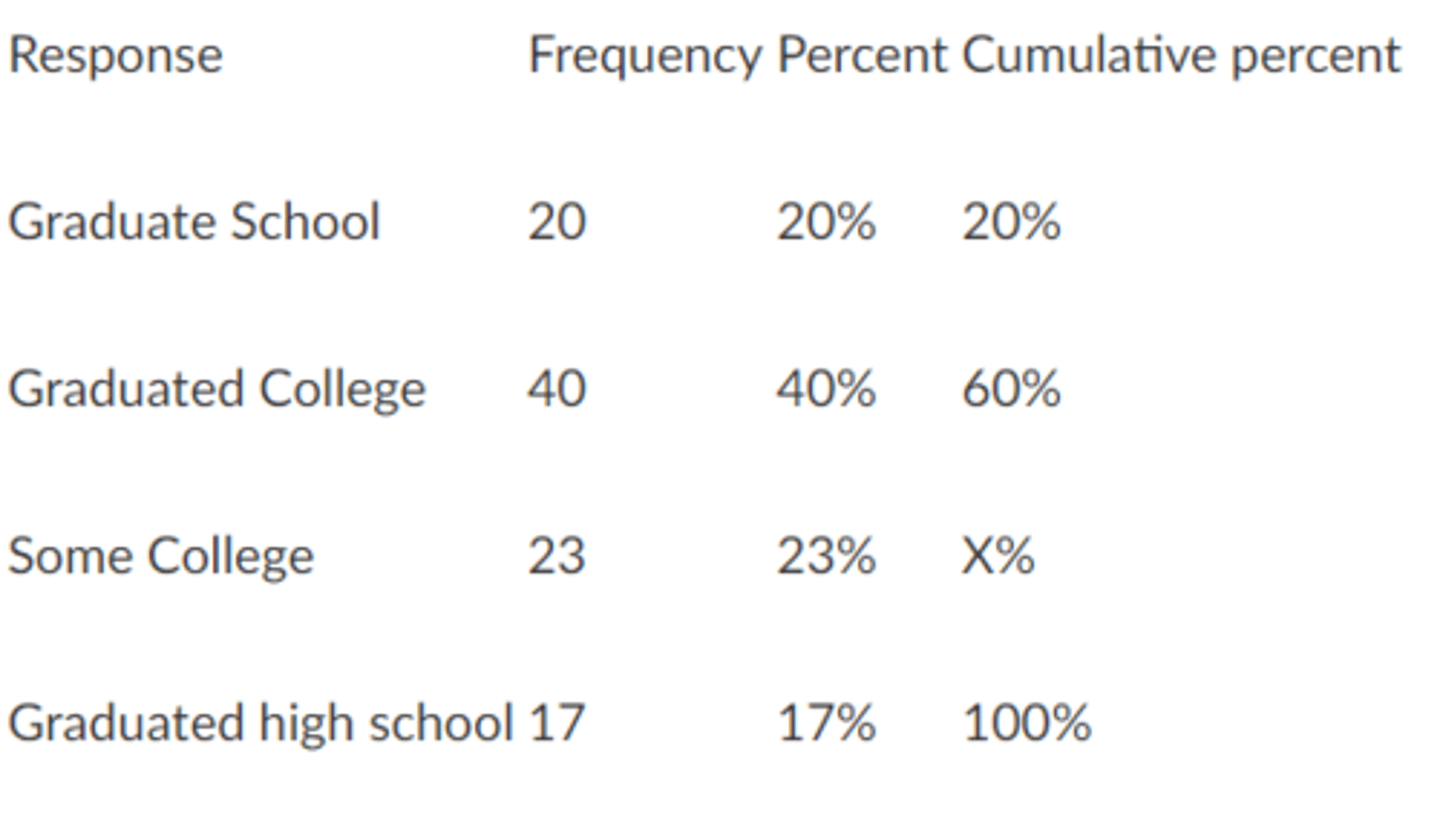
Consider the following frequency distribution for a survey question asking about the participants' highest level of education (the Frequency column is the same as the Count). What is the value for the percent in the cell labeled X?
83
A study explored the effectiveness of a new mindfulness intervention in terms of stress reduction. They found that the distribution of stress levels of all participants in the study is left skewed. What does this distribution of stress level look like?
more participants are under high levels of stress and less participants are under low levels of stress
2 multiple choice options
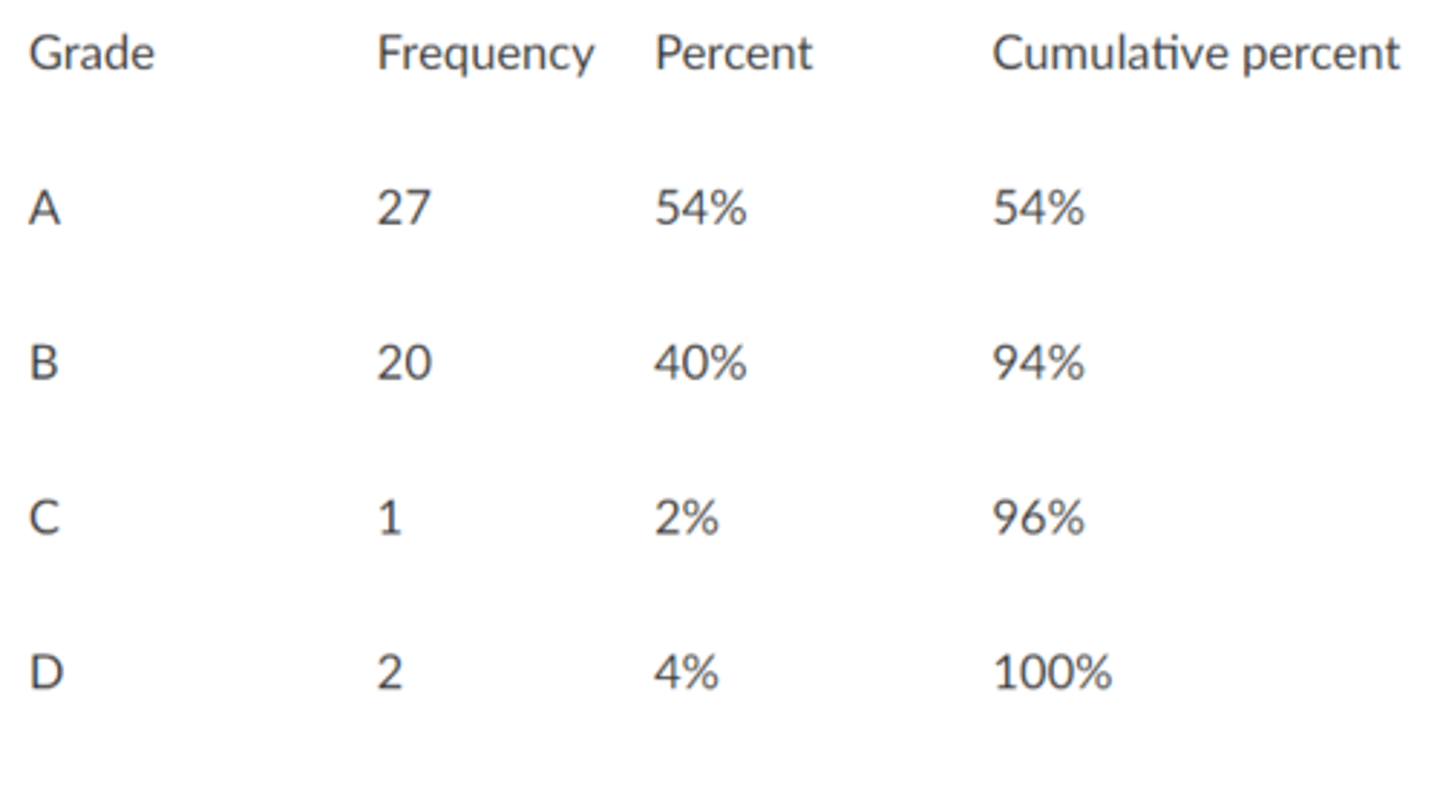
In a biology class, the distribution of students' grades is in the Table. The professor writes an exam for her class of 100 students. What is the proportion of students getting a C or higher? Answer: __% (do not include percent sign in your answer, just type the number)
96
If a distribution is flatter than a normal distribution, the kurtosis is
negative
3 multiple choice options
If a distribution is negatively skewed, the kurtosis is
we don't know
3 multiple choice options
If a distribution is negatively skewed, the skewness is
negative
3 multiple choice options
The higher the density, the:
more likely it is to observe some value
3 multiple choice options
When a distribution has skewness above 2, which of the following is true?
it is right-skewed
3 multiple choice options
A study of post-partum depression found a relatively even number of mothers with low, moderate, and high depression levels. What distribution shape best describes the depression variable?
uniform
3 multiple choice options
Considering the frequency distribution below, What response category corresponds to the mode?
disagree
3 multiple choice options
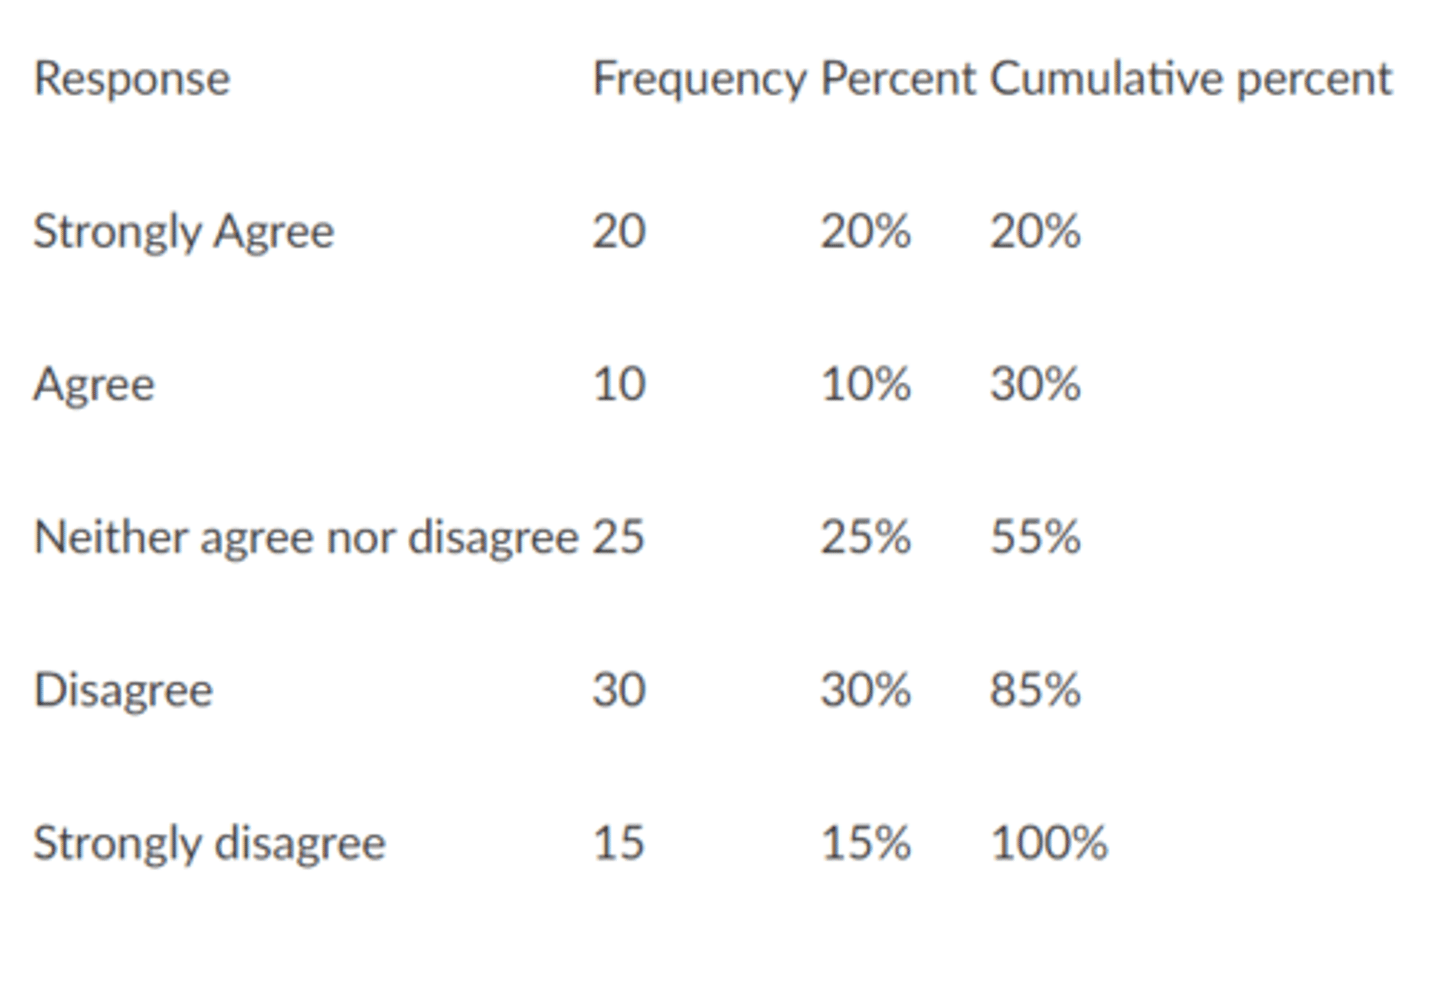
Based on the table, what response category corresponds to the median?
neither agree nor disagree
3 multiple choice options

A researcher wants to use a measure of central tendency to summarize the political party breakdown of his sample. Which measures of central tendency can be computed for this variable? Note that the question is NOT asking which one you should use, but which one you COULD use as a REASONABLE measure.
mode
3 multiple choice options
With what types of variables can the mean be used?
numeric
3 multiple choice options
With what types of variables can the mode be used?
all
3 multiple choice options
A researcher obtains the mean, median, and mode for his data. The mean, median, and mode all equal 10. Based on these descriptive statistics, how is this data likely to be distributed?
symmetric distribution
3 multiple choice options
A researcher obtains the mean, median, and mode for his data. The mean is 10, median is 12, and mode is 20. Based on these descriptive statistics, how is this data likely to be distributed?
negatively skewed
3 multiple choice options
A researcher's sample mean equals 20. If the true mean in the full population is 18, what is the sampling error?
2
Which best describes the sample mean?
The sample mean is the sum of the data divided by the number of data in the sample.
3 multiple choice options
A sample mean is a/an ______. A population mean is a/an ________.
estimate/ parameter
3 multiple choice options
For which of the following data sets is the mode equal to the median?
3, 4, 4, 4, 5, 10
3 multiple choice options
When sample size increases:
sampling error generally decreases
3 multiple choice options
In a negatively skewed distribution, we would expect...
the mean to be smaller than the median and the median to be smaller than the mode
2 multiple choice options
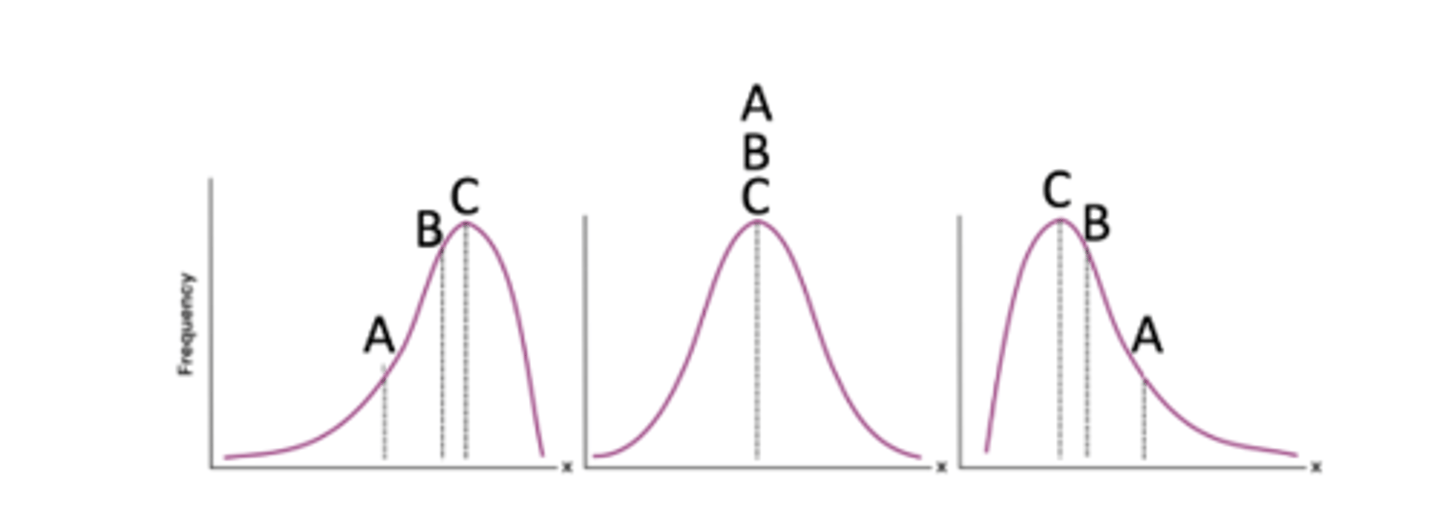
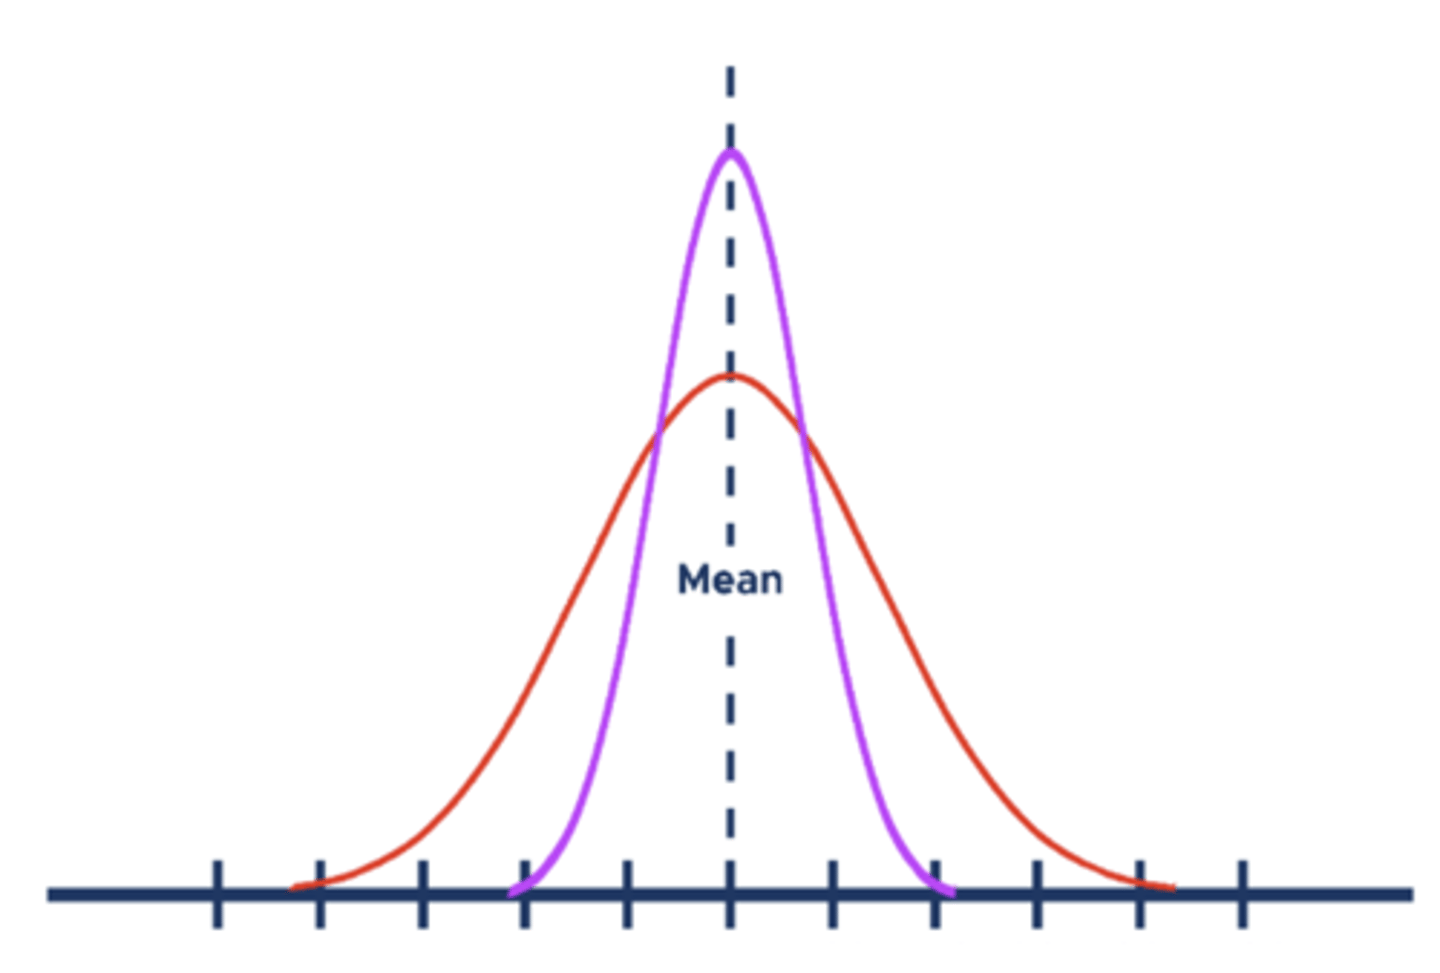
In the image, the mean of each distribution is represented by the letter ____.
A
2 multiple choice options

In the above image, the median of each distribution is represented by the letter ____.
B
2 multiple choice options

In the above image, the mode of each distribution is represented by the letter ____.
C
2 multiple choice options
True or false: sampling error can be either pos or neg
true
1 multiple choice option
A UCLA professor is interested in studying the height of college students in California. Somehow, she knows that the true population mean is 67 inches. The mean height of students in her Psych 100A class is 68 inches. She then goes to USC and finds the mean height of their 100A class. Which of the following is true about the sampling error of the USC 100A class?
it could be pos or neg
3 multiple choice options
In a normal distribution with a mean of 60 and a standard deviation of 10, which of the following interpretations is definitely true?
68% of scores are within ± 10 points from the mean
3 multiple choice options
A researcher is summarizing a sample of ages and reports that the average difference between a respondent's age and the sample mean is 8 years. Which measure of variability is she reporting?
standard deviation
3 multiple choice options
A researcher summarizes a sample of income scores and reports that the average squared difference between a respondent's income and the sample mean is 10,000. Which measure of variability are they reporting?
Variance
3 multiple choice options
The population standard deviation formula has N in the denominator, whereas the sample standard deviation formula has N-1 in the denominator. What is the rationale for using N-1 rather than N?
We don't know the population mean and hence use the sample mean as a replacement. As a consequence, the sum of squares tends to be too small. N-1 is used to counteract the effect from the small sum of squares.
2 multiple choice options
__________ describes the relation between sample mean and the population mean, as __________ describes the relation between individual score and sample mean (or population mean).
sampling error, standard deviation
3 multiple choice options
As sample size increased, sampling error generally:
decreases
3 multiple choice options
A researcher calculates the standard deviation of salaries and obtains a value of zero. Which of the following is true?
all salaries were identical
2 multiple choice options
In the above image, which distribution has the greater standard deviation?
the red distribution
3 multiple choice options

In the above image, which distribution has the higher variance?
the red distribution
3 multiple choice options
When we calculate a sample standard deviation, we divide N-1 not N. What would happen if we divided by N instead?
the estimate would be too small
3 multiple choice options
In a negatively skewed distribution, a student obtains a test score below the mean. What do we know about this student's z-score?
the z-score is negative
3 multiple choice options
Researchers are interested in studying factors related to teenage drinking frequency (higher scores = more frequent drinking). In particular, the researchers want to determine whether growing up with an alcoholic parent versus not has an influence on the frequency of drinking. A researcher found a standardized mean difference effect size of -0.9 (non-alcoholic minus alcoholic). How would you characterize the impact of growing up with an alcoholic parent in this study?
Growing up with an alcoholic parent had a large positive impact on drinking frequency
3 multiple choice options
A researcher is summarizing a sample of happiness scores (which are on a scale from 1 to 100). She reports that the sample mean is 60 and the sample standard deviation is 5. If a respondent's happiness score is 65, what is their corresponding Z score (keep no decimals)?
1
Researchers are interested in the effect of a smoking cessation intervention. Before the intervention, the number of smoked cigarettes per week was recorded for each participant. After the intervention, participants smoked less cigarettes, with a standardized mean difference of -2. Which of the following interpretations is correct?
The number of smoked cigarettes decreases by about 2 standard deviations after the intervention
2 multiple choice options
One researcher is interested in the treatment effects of two depression interventions. There are three groups: control group, Intervention A, and Intervention B. Both interventions decreased the depression level scores of participants. Intervention A provides a standardized mean difference of 0.6 (relative to the control), and Intervention B provides a standardized mean difference of 0.5 (relative to the control). Which intervention was most effective at reducing depression symptoms?
Intervention A
1 multiple choice option
A researcher transformed her variable of interest, Depression, to a z-score. She names this z-score variable, Z-Dep. She plots both the Z-Dep and the Depression variables in jamovi. What can she expect from these plots?
The shape of the distributions will be the same because z-score transformations do not alter the shape of the original distribution.
2 multiple choice options
A high school math teacher gave their class an exam. The mean grade on the exam was 90 with a standard deviation of 2. The teacher converted the students' grades to z-scores and then shared these scores with their students. One student got a z-score of -1. What can you say about this student's grade?
this student's grade was 1 standard deviation below the mean grade.
3 multiple choice options
A researcher is interested in a new teaching method on math performance. Some students are taught with this new method (Intervention group) and some are taught with an older method (Control group). The groups are the same size. Both groups then take an exam. The Intervention group has an average score of 83/100 while the Control group has an average score of 80/100. The average standard deviation across the two groups is 5. How would you describe the groups' standardized mean difference?
moderate
3 multiple choice options
In the process of selecting a tutor for your statistics class, you have narrowed down your search to four candidates: Han, Ben, Egamaria, and Jordan. Each candidate took a different statistics class and scored 100 points. The mean and standard deviation for each of these classes were different, however. Based on the table above, which candidate should you hire as your tutor? (That is, which candidate would earn the highest standardized score?)
Ben
3 multiple choice options
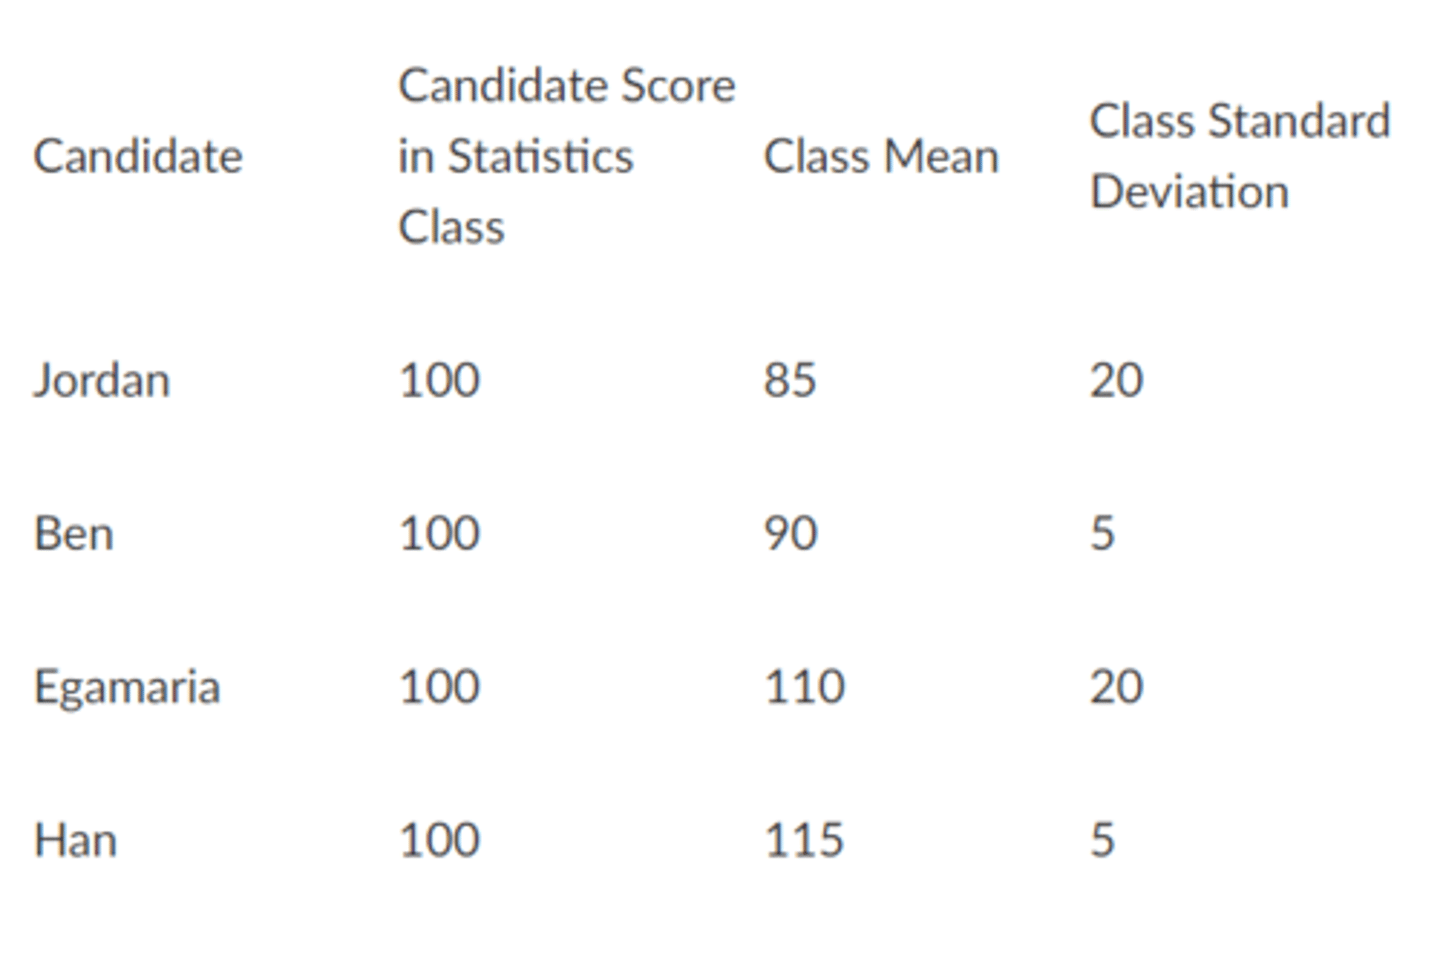
And which candidate would be your absolute last resort? (That is, which candidate would earn the lowest standardized score?)
Han
3 multiple choice options

You have 20 participants’ depression scores, this variable is called Depress. You convert all their scores into z-scores, this variable is called Z-Depress. What is the approximate mean of the Z-Depress variable?
0
You have 20 participants’ depression scores, this variable is called Depress. You convert all their scores into z-scores, this variable is called Z-Depress. What is the approximate standard deviation of the Z-Depress variable?
1
Standard error is larger with a _______ sample size and/or a _______ population variance. Select one:
smaller, larger
3 multiple choice options
A psychologist administers an anxiety questionnaire to 400 college students and obtained a mean anxiety score of 100 with a standard error of the mean equal to 0.2. What is the sample standard deviation?
4
A psychologist studying exam anxiety administers a questionnaire to 100 UCLA college students and obtains a mean anxiety score of 20. Considering the difference between this estimate and the parameter, which of the following statements is true?
The mean anxiety score in the population could be higher or lower than 20
3 multiple choice options
A psychologist studying exam anxiety administers a questionnaire to 100 UCLA college students and obtains a mean anxiety score of 20. Another psychologist administers the same exam anxiety questionnaire to 100 USC college students and obtains a mean anxiety score. Which of the following statements is true?
the new mean could be higher or lower than 20
3 multiple choice options
A group of psychologists administered an exam anxiety questionnaire to 1000 colleges in the US (200 students per school) and obtained 1000 means of anxiety scores. They created a histogram (sampling distribution) of the 1000 sample means. Which of the following best describes the likely shape of this distribution?
normal distribution
3 multiple choice options
A group of psychologists is interested in college students’ exam anxiety levels in the United States. They found a way to administer the exam anxiety questionnaire to all college students in the US, finding a mean of 25. What does the value of 25 represent?
parameter
3 multiple choice options
Why do we need to emphasize "with the same sample size" in describing a sampling distribution?
all
3 multiple choice options
Researchers are interested in the average age of all university students (same population). Researcher A collects 1000 independent samples of size 20. Researcher B collects 1000 independent samples of size 100. If both researchers plot each of their estimates, whose distribution will have a smaller variance?
researcher B
2 multiple choice options
If the mean in the population is 5 and a researcher obtained a sample mean of 4.25, what is the sampling error (keep 2 decimals)?
-0.75
A researcher collected a sample of SAT scores from 200 high school students with a sample mean of 1000. Let's say that we knew that in the population the mean SAT score is 1200. If I take the difference of the sample mean and the population mean (1000-1200=-200), what does this represent?
sampling error
3 multiple choice options
True or false: You can create a sampling distribution of means, standard deviations, or kurtosis.
true
1 multiple choice option
A researcher finds the sample mean on a happiness scale for students is 15. Which of the following will produce the smallest confidence interval (i.e., the smallest range)? Select one:
a sample size of 250
2 multiple choice options
The estimates from many random samples follow a normal distribution. This fact allows us to determine that 95% of all random samples will yield estimates within plus or minus 1.96 _______ from the _______.
standard error units, population parameter
3 multiple choice options
To construct a confidence interval, we need to calculate it as plus or minus 1.96 _______ from the _______ (using the normal distribution as the sampling distribution).
standard error units, sample estimate
3 multiple choice options
A study of exam anxiety at UCLA provides a mean of 60 with a 95% confidence interval of 50 to 70. Which of the following is a correct interpretation of the confidence interval?
We are 95% confident that the range from 50 to 70 includes the true population average exam anxiety in the entire population of students
3 multiple choice options
Holding the standard error of an estimate constant, which t-distribution would result in the largest margin of error for a 95% confidence interval:
a t distribution with 8 deg of freedom
2 multiple choice options
There are three researchers who are calculating confidence intervals for their sample mean estimate. Researcher A has 20 participants in their sample, Researcher B has 50 participants, and Researcher C has 100 participants. Which researcher will have the largest margin of error given that all of the researchers had a standard error equal to 5?
researcher A
3 multiple choice options
Which factors will influence the margin of error when the population standard deviation is unknown?
all
3 multiple choice options
A study of depression at UCLA recruits 100 participants. The result indicates a confidence interval of depression mean from 60 to 70. Which of the following is a correct interpretation of the 95% confidence interval?
We are 95% confident that the range from 60 to 70 includes the population mean of depression level
2 multiple choice options
The critical value used for constructing a confidence interval for a sample is
the t distribution
3 multiple choice options
What t-distribution is more similar to a normal distribution?
one with a high number of deg of freedom
1 multiple choice option
What do we mean when we say that we are 95% confident?
all
2 multiple choice options