REsearch methods (Surveys) 4 lectures
1/16
Earn XP
Description and Tags
R basics
Name | Mastery | Learn | Test | Matching | Spaced |
|---|
No study sessions yet.
17 Terms
What is Descriptive Research?
• Collect information on a phenomenon of interest based on a large
and representative sample
• Test a relationship between two factors
• Examples
– Does customer satisfaction increase loyalty?
– Does delivery time affect whether consumers return a product?
Survey Error
• Measured value = “True” value + Survey Error
– Ex: Kevin responded he visited McDonald’s 3 times last month, but in
reality, he visited 5 times. So the survey error is -2.
Types of Survey Error – Sampling Error
• Sampling error
– Random Sampling Error:
• Source: a random sample may not be identical to the population.
• An Example: You surveyed 100 randomly-picked individuals of Amazon customers. The
average satisfaction of the sample is 4.2 out of 5, but the true satisfaction from the population is
4.5. The sampling error is -0.3.
• How to reduce error: increase sample size
– Systematic Sampling Error:
• Source: introduced by improper use of sampling method
• An Example: you picked 100 individuals in a mall during daytime.
• How to reduce error: use a proper sampling method
Types of Survey Error – Non-Sampling Error
• Non-sampling error (due to mistakes in survey design, data collection, processing, or analysis)
– Coverage error: Some groups in the population are missing from the sampling frame (e.g. You only select
those customers who provided positive reviews)
• Ensure your sampling frame to be representative
– Measurement error: Results from flaws in the survey design or execution, such as poorly worded questions,
survey makers lead respondents to a more favorable answer
• Improve your survey design and execution
– Response error: Results from inaccurate answers from respondents
• Improve your survey design and execution
– Nonresponse error: Occurs when you have a missing data problem as certain individuals do not respond (e.g.
The estimate on the buying interest based on the respondents’ data could be upward biased, since the buying
interest from non respondents could be lower)
• Need to follow up with non respondents.
Measurement Scales
• Measurement scale is a pre-defined rule used to categorize and
quantify variables.
• It determines how data are collected, interpreted, and analyzed.
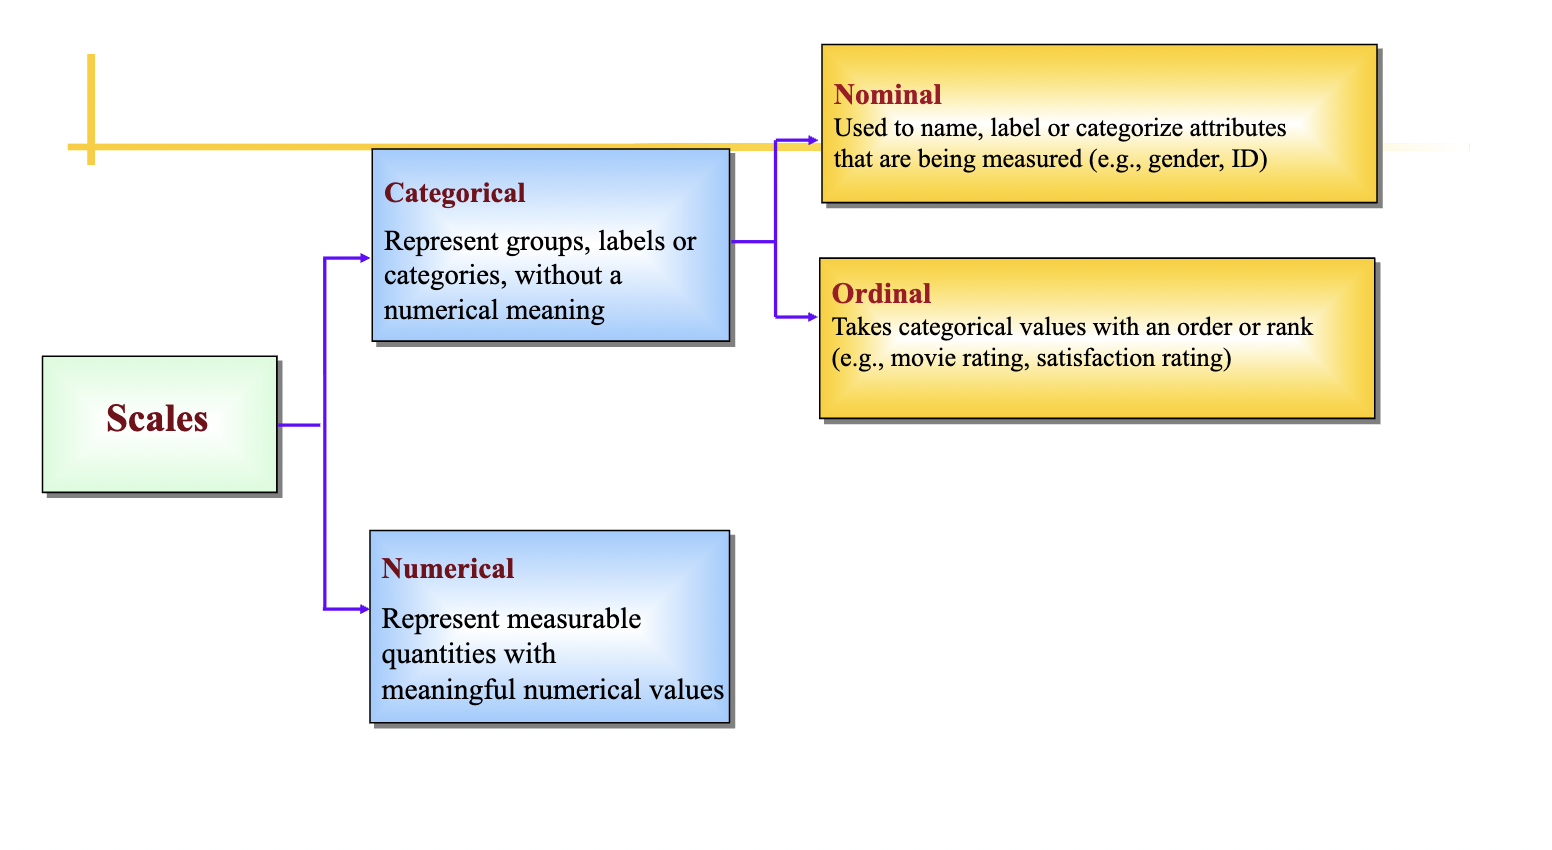
Nominal Scale
– Label categories (often with numbers) without ordering
– Which fast food restaurant did you visit most recently?
• 1. McDonalds, 2. KFC, 3. Others
– How to summarize data from five respondents (1,2,3,1,1)?
• Percentages of (1, 2, 3) are (60%, 20%, 20%)
• Mode is “1” since “1” is the most frequent category
• Ordinal Scale
– Labeling of categories with a meaningful order, but unequal differences between
two adjacent values
– How many movies did you see last month?
• 1. None, 2. One or two, 3. Three or more
– How to summarize the data from 10 respondents (1, 2, 1, 2, 1, 2, 3, 3, 3, 3)
• Percentages of (1, 2, 3) are (30%, 30%, 40%)
• Mode is 3
• Median is 2 because (1,1,1,2,2,2,3,3,3,3)
Interval Scale
– Numbers indicate ordering, equal differences between two adjacent values, and there is
no true 0 (0 does not mean absence of some quantity).
– How likely are you to buy a VW Passat this year?
1-----2-----3-----4-----5
1. Very unlikely, 2. Unlikely, 3. Neither likely or unlikely, 4. Likely. 5. Very likely
– How to summarize the data (1, 2, 5, 2, 4, 2, 4, 2, 3, 1)?
• Percentages of “1”, “2” and “3”, “4” and “5” are 20%, 40%, 10%, 20% and 10%
• Mode is 2
• Median is 2 because (1,1,2,2,2,2,3,4,4,5)
• Mean = sum of the 10 data values / 10 = 2.6
Ratio Scale
– Ranking, equal intervals, meaningful zero point (i.e. absence of the quantity)
– Examples:
• How many units of products did you sell last year?
– You can more precisely compare differences between respondents
• Willingness to buy measured in interval scale: 1, 2, 3, 4, 5
• Willingness to buy measured in ratio scale: 0% - 100%
– You can apply mathematical operations flexibly
Measurement Format
• Open-Response Questions
– e.g. “Please describe how you like about the new product”
– Richer information but more difficult to code
• Close-Response Questions
– Respondents choose from a list of answers
o Help respondents recall information that they might not have remembered on their own
o Coding and data entry greatly simplified
– More restrictive
Questionnaire Design
• Question wording:
– Be sure questions are clear
o Avoid complicated wording
– “What is the annual per capita expenditure on groceries in your household?”
o Avoid vague words
– “Do you eat at McDonald’s frequently?”
o Avoid double negatives
– “I definitely will not refuse to attend.”
Questionnaire Design
• Question wording:
– Be sure questions are clear
– Avoid double-barreled questions
– Avoid leading questions that suggest there is a “right” answer.
– Anticipate if a sensitive question has a socially desirable response (SDR)
o Have you ever defaulted on a credit account?
o Do you use your wife’s hair spray?
o Have you eaten Kellogg’s “Frosted Flakes”?
o The reactions to a sensitive question
– No response
– Termination
– Distortion
Sampling
• It is often infeasible to send your survey to everyone in the target market
• Two types of sampling depending on whether you have a sampling
frame (i.e. a list of items or people forming the target population from
which a sample is taken)
– Probability sampling
o Usually adopted when you have a sampling frame (e.g. MS students in Marshall)
– Non-probability sampling
o Usually adopted when you don’t have a sampling frame (e.g. Beer drinkers in LA county)
Probability Sampling
• Every element has a known and non-zero probability of inclusion in the
sample
– Needs a sampling frame
– Results can be more safely generalized
– More costly and time consuming
• Methods
– Simple random sampling
– Stratified sampling
– Clustered sampling
1. Simple Random Sampling
• Each element of the population has the same non-zero probability of inclusion.
• An example: draw a simple random sample of 10 students from this class
(class size is N = 48) to estimate class performance.
– For each student in the class, generate a random number x, x ~ Uniform (0, 1)
– Sort the x’s
– Pick 10 using any given rule (say, the smallest 10, largest 10, etc.)
• When to use simple random sampling?
– The population is relatively homogeneous.
– There are no clear subgroup distinctions.
2. Stratified Sampling
• A manufacturer wants to sample 100 stores from a population of 1,000 hardware stores
(100 large stores and 900 small stores), to gather opinions about a new type of lawn
mower.
• Random sampling may not be ideal, since large stores generate 50% of total sales
• Use stratified sampling when the population consists of distinct subgroups
– Step 1: Divide the population into two strata: large stores vs. small stores. Units in each strata are
highly similar, whereas units in different strata are highly different.
– Step 2: Sample 50 from the 100 large stores, and 50 from the 900 small stores, using simple random
sampling
3. Cluster Sampling
• A manufacturer wants to sample 100 stores from a population of 1,000 (100 large stores and
900 small stores), to run in-store interviews regarding a new type of lawn mower. We also
know that stores in each state share a similar structure.
• Random or stratified sampling may not be ideal, why?
• Use clustered sampling when the population consists of representative clusters
– Step 1: Divide the 1000 stores into 50 clusters (states in this case). Units in each cluster well represent the
general population
– Step 2: Randomly pick 3 states (e.g. California, Ohio, and Florida), and the total number of hardware
stores in those 3 states are 100. Include all hardware stores in those 3 states as your sample. You only
need to send teams to 3 states to save cost.
Non-Probability Sampling
• Elements are selected in a non-probabilistic manner
– Often used when it is difficult to generate a sampling frame (e.g. beer drinkers in
LA)
– Difficult to generate findings from these samples to the population
• Methods
– Convenience sampling
o Pick sampling units that are convenient to contact.
o Example: Include your close friends
– Snowball sampling
o Useful when need to reach a small and specialized population
o Example: Include your friends who are vegetarian and their vegetarian friends.