unit 3 stats
1/34
Earn XP
Name | Mastery | Learn | Test | Matching | Spaced | Call with Kai | Chat |
|---|
No analytics yet
Send a link to your students to track their progress
35 Terms
univariate data
one variable data set
bivariate data
relationship between two variables
explanatory variable
predict or explain changes in response varaible
response varaible
measures an outcome of a study
scatterplots
- shows relationship/association between two quantitative variables measured on the same individuals
- explanatory variable: x-axis
- response variable: y-axis
- no explanatory variable: either variable can go on x-axis
describing scatterplots
- direction: positive, negative, no association
- form: linear or nonlinear
- strength: weak, moderate, strong
- unusual features: points that fall outside of overall pattern and distinct clusters of points
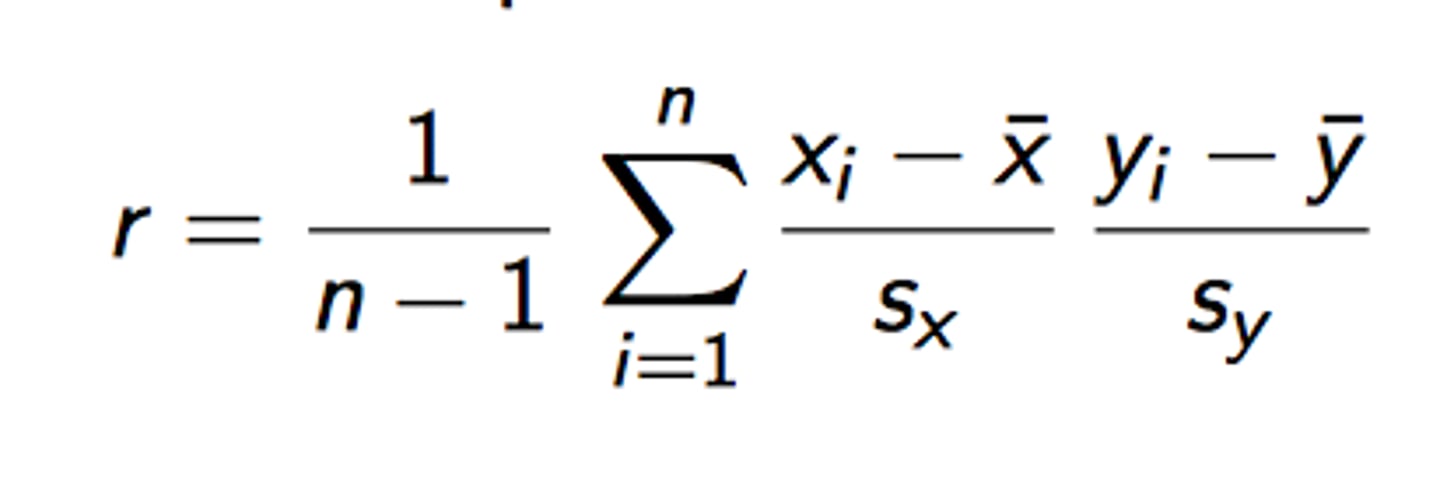
correlation r
- measures the direction and strength of association for a linear relationship only
- between -1 and 1
- does not equal causation
- does not measure form
- not a resistant measure of strength
- both quantitative variables
- no distinction between explanatory and response variables
- does not change when units change
- no unit of measurement (just a number)
correlation r interpretation
"the linear relationship between X and Y is STRENGTH and DIRECTION"
coefficient of determination r² interpretation
"the percent of the variation in Y explained by the linear relationship with X"
used to make predictions
ŷ = a + bx
residual
actual - predicted
(difference between the actual value of y and the value of y predicted by the regression line)
residual interpretation
"the actual CONTEXT was RESIDUAL above/below the predicted value for X = #"
ŷ = a + bx interpretations
- "when X = 0 CONTEXT the predicted Y-CONTEXT is Y-INTERCEPT"
- "for each additional X-CONTEXT the predicted Y-CONTEXT increases/decreases by SLOPE"
regression line
summarizes relationship between two variables but only when one variable helps explain the other
extrapolation
- using a regression line to make a prediction for x-values outside (larger/smaller) the x-values used to obtain the data
- don't do it; not accurate
least-squares regression line
the line that makes the sum of the squared residuals as small as possible
residual plot
- scatterplot that displays the residuals on the vertical axis and the explanatory variable on the horizontal axis
- appropriate model: no leftover curved pattern
- not appropriate model: leftover curved pattern
correlation r strength
- strong negative: -1
- moderate negative: -0.5
- weak (no association): 0
- moderate positive: 0.5
- strong positive: 1
properties of correlation r
- unusual value in pattern = strengthens r
- unusual value not in pattern = weakens r
standard deviation of the residuals s
- measures the size of a typical residual
- s measures the typical distance between the actual y values and the predicted y values
coefficient of determination r²
- measures the percent of variability in the response variable that is accounted for by the LSRL
- tells us how much better the LSRL does at predicting values of y than simply guessing the mean y for each value in the data
regression to the mean
for an increase of 1 standard deviation in the value of the explanatory variable x, the LSRL predicts an increase of r standard deviations in the response variable y
high leverage in regression
much larger or smaller x-values than the other points in the data set
outlier in regression
- does not follow the pattern of the data
- large residual
influential point in regression
if removed, big changes to slope, y-intercept, and r values
association does not imply causation
a strong association is not enough to draw conclusions about cause and effect
horizontal outliers
tilt line
vertical outliers
shift line up/down
linear
graph x vs. y
exponential
graph x vs. log y
power (y=axᵖ)
graph log x vs. log y
achieve linearity with power model
- raise value of explanatory variable x to the p power (xᵖ, y)
- take pᵗʰ root of the values of the response variable y (x, ᵖ√y)
linear pattern
scatterplot of logarithms of both variables
roughly linear assoication
scatterplot of logarithm of y against x
choosing the best regression
1. check scatterplot for linear pattern
2. check residual plot for no distinct pattern
3. check for the r² that is closest to 1