Principles of Economics C.1 - The Basic Core of Economics
1/15
There's no tags or description
Looks like no tags are added yet.
Name | Mastery | Learn | Test | Matching | Spaced |
|---|
No study sessions yet.
16 Terms
Microeconomics definition
Focus on individuals and households: examines the behavior and decisions of individual firms and households, & the way they interact in specific industries and markets
Usage: to analyze decisions made by individual firms, or to look at how certain factors can affect the market for a specific good
Macroeconomics definition
Focus on the whole: concentration on the whole national economy / world economy; examines the workings and problems of the whole economy, looking at features such as GDP growth and unemployment
Usage: to examine the factors contributing to a country / region’s overall economic growth, or to determine the cause of economic fluctuations (e.g. recessions)
What is the main mantra of economics?
Choices, scarcity, and interaction: people make choices with scarce resources, and they interact with others when they make these choices.
Opportunity cost definition and example
The cost of a decision: the value of the next-best forgone alternative to making a choice
Example: if a baseball player decides to attend college on a scholarship instead of entering the MLB draft, then even if he is going to school for free, the opportunity cost of that decision is the salary he could be making as a professional.
Explain the concept of gains from trade.
Benefits: individuals and firms benefit by trading goods and services.
Real-world example: Google and Cisco specialize in software and hardware, respectively, and benefit from trade;
Cisco could buy Google services, and Google could indeed buy Cisco services
Explain three things that gains from trade can lead to.
Specialization: a concentration of production effort on a single specific task.
Division of labor: the division of production into various parts in which different groups of workers specialize.
Comparative advantage: a situation in which a person or group can produce one good at a lower opportunity cost than another person or group.
What can specialization, division of labor, and comparative advantage lead to in the long run?
Greater production due to greater efficiency which can make all actors better off.
The important role of government is to ensure that trade can happen. This includes five main components, such as:
Predictable policy framework: the government needs to be predictable in its decision-making process.
Rule of law (e.g. property rights): property rights need to be clearly defined and enforced.
Reliance on market economy: the government needs to allow the market to determine prices and quantities produced.
Good incentives (like patents): the government needs to provide good incentives for economic activity, such as patents to encourage innovation.
Intervention during market failure: the government needs to be able to intervene in the case of market failure, when the market would fail to reach the efficient outcome.
Explain the production possibilities curve.
Function — showing tradeoffs in production: a graph illustrating the tradeoffs that an economy faces when deciding what to produce.
The more production, the more opportunity costs: it has a bowed-out shape, implying that opportunity costs increase as production increases
On the curve: efficient levels of production.
Below the curve: inefficient.
Outside the curve: impossible.
PPC = possibility, not optimality: the production possibilities curve does not indicate which good we prefer, or the optimal point on the curve; it merely indicates what amounts of production it is possible to achieve.
What three main things does the work of an economist include?
Observation: describing economic events
Explanation: identifying potential causes of the events
Policy recommendations: prescribing courses of action for government or business to follow
Normative vs. positive economics
Normative economics = recommendations
Positive economics = analysis: the economic analysis of the event
Explain income distribution trends from the 1940s to the 2010s.
1940s–mid-1960s (similar growth, stable inequality): Income growth was similar for both the top 10% and bottom 90%, so inequality remained stable.
Mid-1960s–1970s (slowing growth, unchanging inequality): Growth slowed for both groups due to economic policy, but income inequality did not change.
1980s–1990s (fast and uneven growth, greater inequality): Income grew faster for the top 10%, increasing inequality.
2000s–2012 (slow growth for both groups, greater inequality): Both groups saw slower growth, but the bottom 90% struggled more.
What is one possible explanation for the growth of income inequality that he mentions?
The rising returns to education (1970s-90s).
College and graduate degrees led to much higher wages than just a high school education
People in the top 10% of earners were more likely to have college or advanced degrees.
Fewer lower-income individuals had access to higher education
Shift towards services and finance: as the economy shifted to reward skills in technology, finance, and services, educated workers saw much faster income growth.
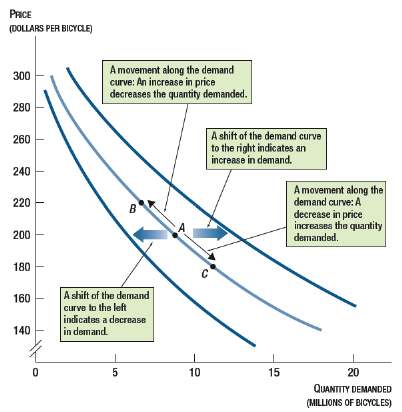
What is demand? What results in a movement along the demand curve, and what results in a shift of the demand curve?
Demand: the quantity of a good that consumers are willing and able to purchase at various prices during a given time; the negative relationship between the price of a good and the quantity demanded by consumers.
Movement along the demand curve: occurs when a higher price reduces the quantity demanded or a lower price increases the quantity demanded.
Shift of the demand curve: occurs when something besides a change in price changes the quantity of a good that people are willing to buy.
Increase in demand: shift to the right of the demand curve
Decrease in demand: shift to the left of the demand curve
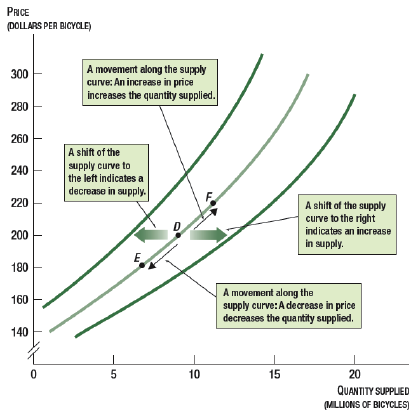
What is supply? What results in a movement along the supply curve, and what results in a shift of the supply curve?
Supply: the amount of a resource that economic agents are willing/able to provide. A positive relationship between the price of a good and the quantity supplied by firms
Movement along the supply curve: happens when a higher price increases the quantity supplied or a lower price decreases the quantity supplied.
Shift of the supply curve: occurs when something besides a change in price changes the quantity of a good that firms are willing to sell.
Increase in supply = shift to the right of the supply curve
Decrease in supply = shift to the left of the supply curve
The equilibrium price and equilibrium quantity are determined by the intersection of the supply curve and the demand curve. What happens at that intersection point?
The quantity supplied equals the quantity demanded — there are no shortages or surpluses.