Bio Modual 3
1/41
There's no tags or description
Looks like no tags are added yet.
Name | Mastery | Learn | Test | Matching | Spaced | Call with Kai |
|---|
No analytics yet
Send a link to your students to track their progress
42 Terms
What Determines Where Species Live?
Where they can ________ and _________
Ecological niche (“Nitch”)
Range of abiotic conditions they can (tolerate/persist)
Range of biotic conditions they can (tolerate/persist) in
The abiotic and biotic factors can interact
What Determines Where Species Live?
Where they can survive and reproduce
Ecological niche (“Nitch”)
Range of abiotic conditions they can tolerate
Range of biotic conditions they can persist in
The abiotic and biotic factors can interact
Biotic Factors
Examples: ____________________________________
Working in combination with abiotic factors
______ Niche: Actual range (where they occur in real life)
______ Niche: Potential range (where they could exist based on abiotic factors)
Biotic factors create ________
Realized niche can be the same as the fundamental niche
Biotic Factors
Examples: Competition, predation, parasitism, mutualism, dispersal ability
Working in combination with abiotic factors
Realized Niche: Actual range (where they occur in real life)
Fundamental Niche: Potential range (where they could exist based on abiotic factors)
Biotic factors create limitations
Realized niche can be the same as the fundamental niche
Biogeography: How and why species are _________ the way they are due to history
Considers where the _________ used to be, which land masses were _________, who was separated, how long __________ lasted
As land separates, gene flow is ________ and speciation/divergence begins to _________
Biogeography: How and why species are distributed the way they are due to history
Considers where the continents used to be, which land masses were connected, who was separated, how long isolation lasted
As land separates, gene flow is eliminated and speciation/divergence begins to occur
Biogeographic Regions
Earth’s land mass can be divided into (#) biogeographic regions that differ in species composition and richness
Correspond to the major _____ _____
These regions differ in: Species composition, evolutionary history, and endemism
When the plates separate: Population becomes isolated and ________ occurs
When the plates collide: __________ becomes possible and interchange occurs
Biogeographic Regions
Earth’s land mass can be divided into six biogeographic regions that differ in species composition and richness
Correspond to the major tectonic plates
These regions differ in: Species composition, evolutionary history, and endemism
When the plates separate: Population becomes isolated and speciation occurs
When the plates collide: dispersal becomes possible and interchange occurs
The geographical distribution of a given clade will be determined by: (1-3)
_____________
_____________
_____________
_____________
_____________
Niche Starting Limitations Located Temporally
The geographical distribution of a given clade will be determined by: (1-3)
The ancestral ecological niche of the clade
(What did they occupy historically? They’re not going to suddenly develop all new features and move to new niches.)
The geographical starting point for dispersal
(They can’t just disperse anywhere)
Limitations to dispersal imposed by abiotic conditions and other species (biotic conditions)
(Maybe a species can’t move into a space because of the temperature or an established predator)
Opportunities for niche evolution that are afforded to individual species by their geographical location
(You can only move into a niche space that exists in the space you’re in)
The amount of time since the origin of the clade, during which niche evolution and dispersal could occur
(How much time they’ve had to evolve)
Tectonic history of Earth: Pangaea
Ancient supercontinent (~250 mya)
No oceanic barriers separating species
Lead to broad terrestrial dispersal and shared lineages
TIMELINE
1.Break up of _______ (initiated 180 mya)
Caused major _______ events (when gene flow stops, divergence begins)
2.Most of _______ separated into lots of different continents (100 mya)
Ocean barriers formed, isolation increased, and independent evolutionary trajectories emerged
3._______ ~75 mya
Important temporary land bridge that allowed people to get to North America
4.Land bridges existed between _______ and North America (65 mya)
5.All _______ separated (50 MYA)
_______ is about to collide with Eurasia (20 cm per year!)
6.Central American land bridge ~3 mya
The Great American _______ Interchange
This bridge still exists (_______)
Caused many marsupials to go extinct bc _______ animals outcompeted them
TIMELINE
1.Break up of Pangaea (initiated 180 mya)
Caused major vicariance events (when gene flow stops, divergence begins)
2.Most of Gondwanaland separated into lots of different continents (100 mya)
Ocean barriers formed, isolation increased, and independent evolutionary trajectories emerged
3.Beringia ~75 mya
Important temporary land bridge that allowed people to get to North America
4.Land bridges existed between Europe and North America (65 mya)
5.All continents separated (50 MYA)
India is about to collide with Eurasia (20 cm per year!)
6.Central American land bridge ~3 mya
The Great American Biotic Interchange
This bridge still exists (Panama)
Caused many marsupials to go extinct bc placental animals outcompeted them
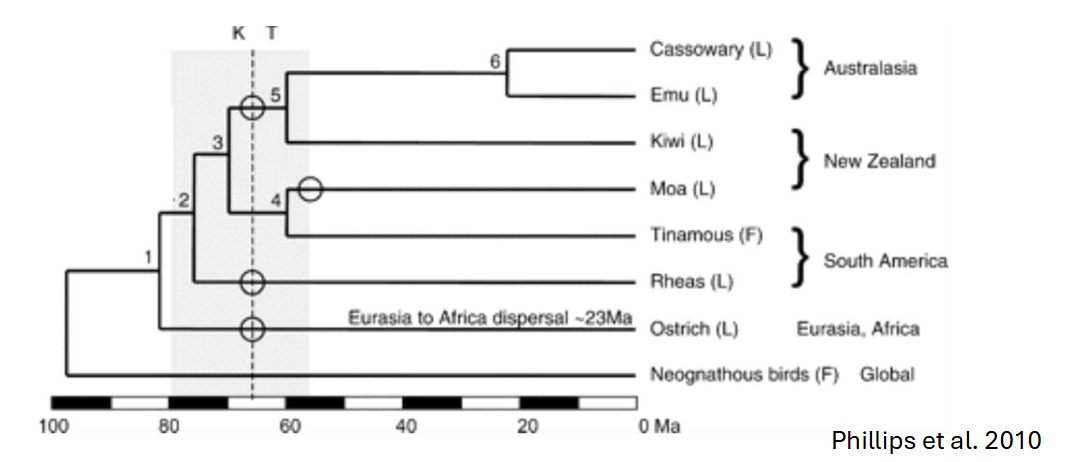
Example from __________: Modern species of flightless Ratites
Key:
Dotted line: Cretaceous-Tertiary boundary
Circle: Loss of flight
Grey shaded area: fragmentation of South Gondwana
Shows there were _____________________________
Example from Gondwanaland: Modern species of flightless Ratites
Key:
Dotted line: Cretaceous-Tertiary boundary
Circle: Loss of flight
Grey shaded area: fragmentation of South Gondwana
Shows there were multiple independent origins of flightlessness
The Great American Biotic Interchange
Modern Marsupial distribution reflects
Ancient plate _____________
Later _____________ collisions
_____________ introductions
Niche + dispersal + tectonics + time
The Great American Biotic Interchange
Modern Marsupial distribution reflects
Ancient plate connections
Later continental collisions
Competitive introductions
Niche + dispersal + tectonics + time
What is Population Ecology: How population _____ changes, why those changes occur, and how populations are _____ in space
Why is it important?
Links _____ and _____
Essential for: conservation biology, fisheries management, and understanding human population growth
Fundamental questions: Where does a species _____ and _____ _____ individuals are there
What is Population Ecology: How population size changes, why those changes occur, and how populations are distributed in space
Why is it important?
Links ecology and evolution
Essential for: conservation biology, fisheries management, and understanding human population growth
Fundamental questions: Where does a species live and how many individuals are there
________: Number of individuals per unit area
Varies across a species’ range (________ niche)
Three main spatial distribution patterns
Random distribution
Ex. ________
________ distribution
Associating in social groups
(Most/least) common pattern
Causes patchy resources
_________ distribution
Evenly spaced
Caused by negative interaction like _________
Density: Number of individuals per unit area
Varies across a species’ range (realized niche)
Three main spatial distribution patterns
Random distribution
Ex. dandelion seeds
Clumped distribution
Associating in social groups
Most common pattern
Causes patchy resources
Uniform distribution
Evenly spaced
Caused by negative interaction like competition
Metapopulation: A population of __________
Ex. fragmented prairie with lots of different butterfly populations. If you look at the __________, that’s a metapopulation
Smaller populations that make up a metapopulation can be connected by __________ and therefore share __________, but they do function as __________ populations
__________ __________ increases metapopulation structure (creates isolated populations)
Local __________ can be offset (if one butterfly population dies, individuals from surrounding populations may re-colonize the area)
Metapopulation: A population of populations
Ex. fragmented prairie with lots of different butterfly populations. If you look at the whole field, that’s a metapopulation
Smaller populations that make up a metapopulation can be connected by dispersal and therefore share alleles, but they do function as independent populations
Habitat fragmentation increases metapopulation structure (creates isolated populations)
Local extinctions can be offset (if one butterfly population dies, individuals from surrounding populations may re-colonize the area)
Measuring Population Size & Distribution for (fast/slow) moving organisms:
Quadrat Counting Method: How many individuals are in a ______________________
Population = _____________
Area: ______
Measuring Population Size & Distribution for slow moving organisms:
Quadrat Counting Method: How many individuals are in a predetermined square area (extrapolate out)
Population = Density x Area
Area: lw
Measuring Population Size & Distribution for (fast/slow) moving organisms:
Line Transects: Have a pre-determined ________ that you follow and count the organisms found there (extrapolate out)
Population = ___________
Area: ___________
“Within 2m of a 100m line” = ___________
Density: ___________
40 individuals
___________
Measuring Population Size & Distribution for slow moving organisms:
Line Transects: Have a pre-determined line that you follow and count the organisms found there (extrapolate out)
Population = Density x Area
Area: 2wl (both sides of the line)
“Within 2m of a 100m line” = 2 x 2 x 100 = 400
Density: n/(2wl)
40 individuals
40/400 = 0.1 per m^2
Measuring Population Size & Distribution for (fast/slow) moving organisms:
Mark-Recapture:
Steps: Capture and mark individuals → Release and allow mixing → Recapture and count _____________ individuals
Assumptions: _____________, _______________, ______________
Measuring Population Size & Distribution for fast moving organisms:
Mark-Recapture:
Steps: Capture and mark individuals → Release and allow mixing → Recapture and count marked vs unmarked individuals
Assumptions: No immigration/emigration, no trap avoidance or attraction, and marking does not affect survival
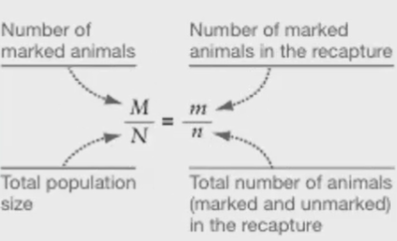
Mark-Recapture Math:
Mark-Recapture Math:
(Trying to find N)
Cross multiply, isolate N (divide), then plug numbers in
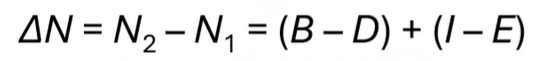
Demography: What determines Population Size
____ principals determine population size
Increased by: _________ & _________
Decreased by: _________ & _________
Equation is: ____________________
Demography: What determines Population Size
BIDE principals determine population size
Increased by: Birth & Immigration
Decreased by: Emigration & Mortality
Equation is:
Age Structure, Generation Time, & Life Tables
Age Structure: Number of individuals ________________
Generation time: Average time between _________ and __________
Females are the _______ factor and control population growth more than males
Age Structure, Generation Time, & Life Tables
Age Structure: Number of individuals in each age class
Generation time: Average time between a female’s birth and the birth of her offspring
Females are the limiting factor and control population growth more than males
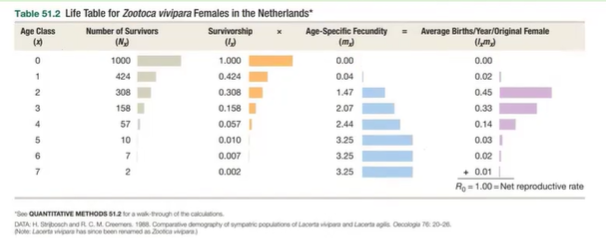
Life Table
Shows ____________ and ____________
Can either take a snapshot of a (longer/shorter) lived species, or measure across the lifetime of a (longer/shorter) lived species
Limitations
________ is inherently difficult to get
Need a _________ population
Life Table
Shows survivorship and reproduction
Can either take a snapshot of a longer lived species, or measure across the lifetime of a shorter lived species
Limitations
Data is inherently difficult to get
Need a marked population
Survivorship (__) = Proportion of a cohort that survive to an age class
Age-specific fecundity (__) = Average number of __________ offspring produced by a female in each age class
(equation) = Average number of female offspring produced per original female in the population at that age class
Net reproductive rate (__) = Average female births per year per female
R₀ < 1 : __________
R₀ = 1 : __________
R₀ > 1 : __________
Survivorship (Lₓ) = Proportion of a cohort that survive to an age class
Age-specific fecundity (mₓ) = Average number of female offspring produced by a female in each age class
Lₓ * mₓ = Average number of female offspring produced per original female in the population at that age class
Net reproductive rate (R₀) = Average female births per year per female
R₀ < 1 : Decreasing Population
R₀ = 1 : Stable Population
R₀ > 1 : Increasing Population
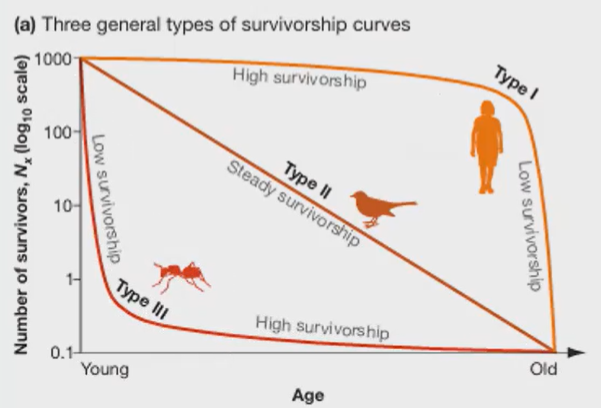
Survivorship Curve (___)
Type 1: ____________________
Type 2: ____________________
Type 3: ____________________
Survivorship Curve (Lₓ)
Type 1: High initial survivorship with steep decline later (humans)
Type 2: Steady survivorship (birds)
Type 3: Low initial survivorship that then levels out (turtles/ants)
Fecundity (__) and Reproductive Rate (__)
Age specific fecundity often (decreases/decreases) with age
Fecundity (mₓ) and Reproductive Rate (R₀)
Age specific fecundity often increases with age
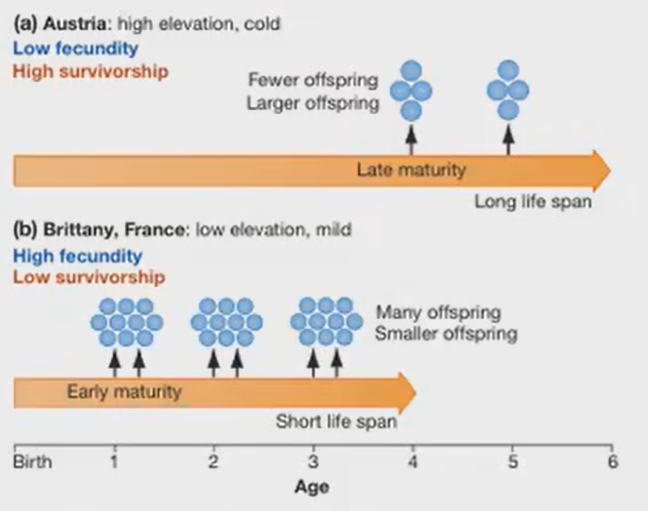
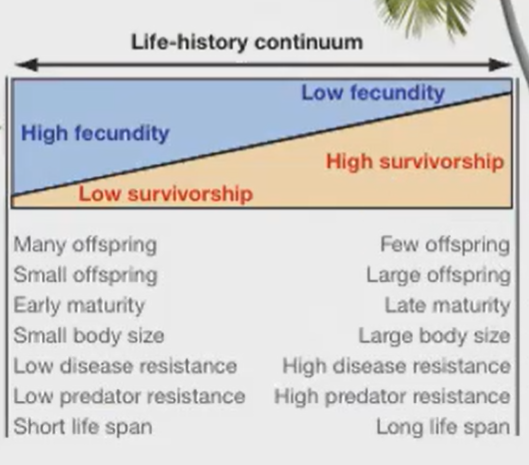
Life History & Fitness Trade-Offs
Trade offs between ________ and __________
How many offspring are _________ vs how many __________
Same species living in different _________ can have different fecundity vs survival rates
Successful invasive species show ________ life history patterns and adaptation
Life History & Fitness Trade-Offs
Trade offs between survivorship and fecundity
How many offspring are produced vs how many make it to adulthood
Same species living in different areas can have different fecundity vs survival rates
Successful invasive species show diverse life history patterns and adaptation
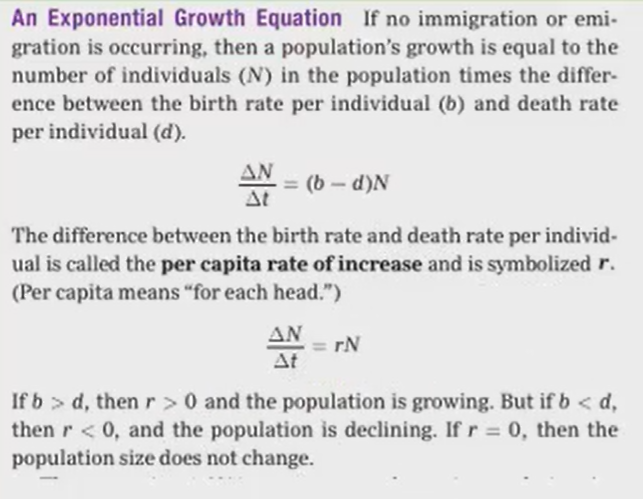
Population Growth: Exponential Growth
Change in population size over time
Isolated Population: Can be measured by just (equation) (no immigration or emigration)
Conditions: ________________ & ________________
Exponential Growth = (equation)
Population Growth: Exponential Growth
Change in population size over time
Isolated Population: Can be measured by just birth - death (no immigration or emigration)
Conditions: Unlimited resources & Constant per-capita growth rate
Exponential Growth = (births - deaths) * population size
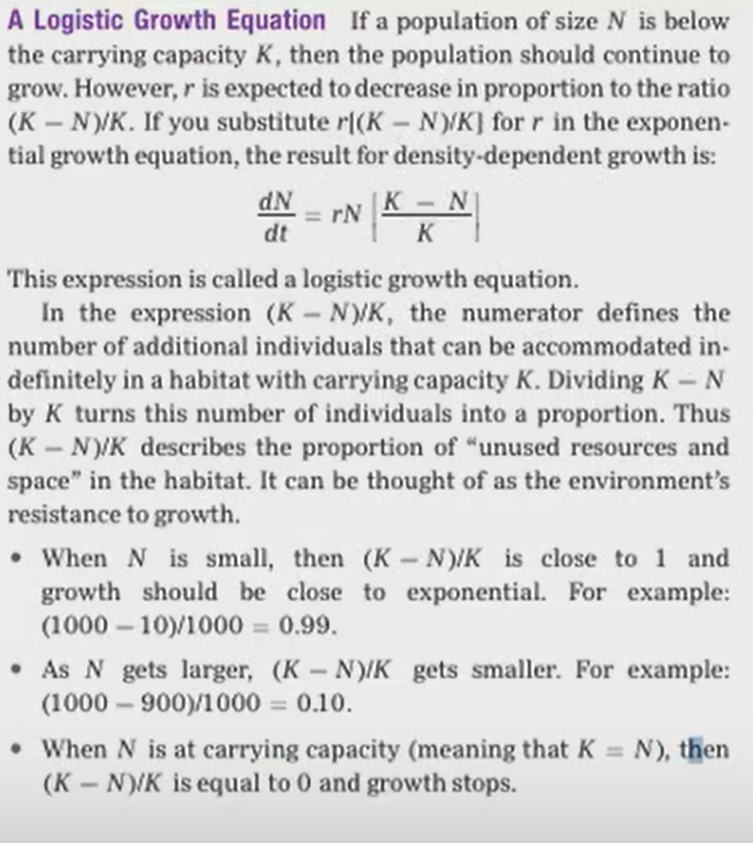
Population Growth: Logistic Growth
Resources are _________
Growth becomes ________ dependent
Carrying capacity = (Letter)
Populations either fluctuate around carrying capacity once reaching it or crash
Equation: ________________
Population Growth: Logistic Growth
Resources are finite
Growth becomes density dependent
Carrying capacity = K
Populations either fluctuate around carrying capacity once reaching it or crash
Equation: ________________
Density-Dependent vs Density-Independent Factors
Density-Independent:
Affect populations regardless of size
Ex. ________, __________
Density-Dependent
Effects that (increase/decrease) with population density
Ex. ________, __________, ________, __________
Density-Dependent vs Density-Independent Factors
Density-Independent:
Affect populations regardless of size
Ex. Weather, disasters
Density-Dependent
Effects that increase with population density
Ex. Competition, disease, predation, waste buildup
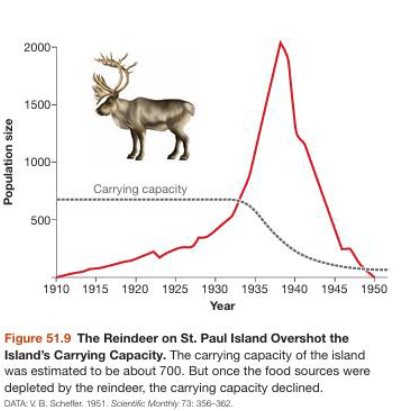
Why Do Some Populations Crash?
Crash: Population declining to _______ or near ________
This happens when populations overshoot _______ _________
Overexploitation: __________________________________
Ex. Animals overshooting the carrying capacity, overeating the plant life, and lowering the carrying capacity of the environment
Why Do Some Populations Crash?
Crash: Population declining to extinction or near extinction
This happens when populations overshoot carrying capacity
Overexploitation: Environment has degraded due to populations overshooting capacity, and the carrying capacity lowers
Ex. Animals overshooting the carrying capacity, overeating the plant life, and lowering the carrying capacity of the environment
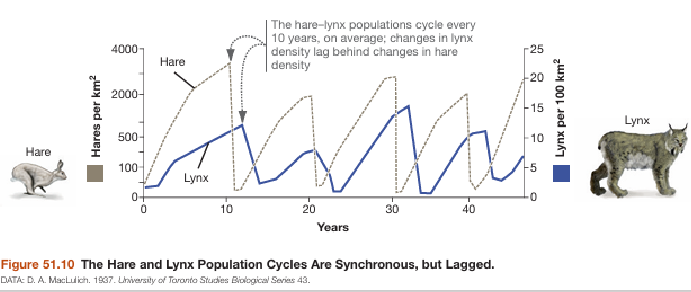
Populations Cycles are somewhat ___________
Populations Cycles are somewhat predictable
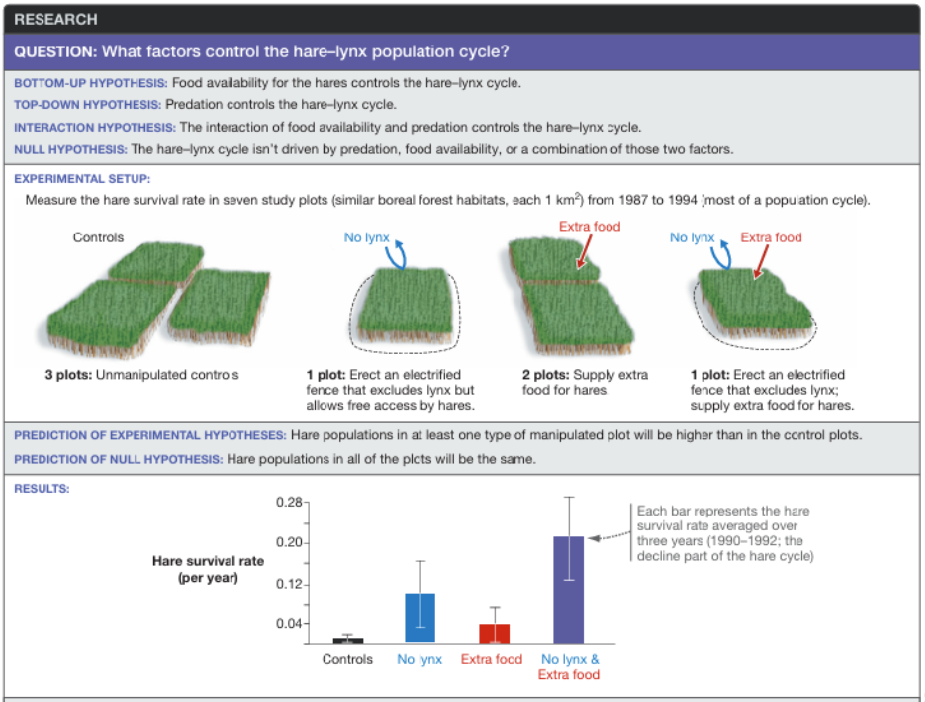
Competing Hypotheses for Population Cycles
Bottom Up Hypothesis: _________________________
Top Down Hypothesis: _________________________
Interaction hypothesis: _________________________
Competing Hypotheses for Population Cycles
Bottom Up Hypothesis: Hare populations are limited by food, and the lynx will decline when the hares starve (Limited by resources at the bottom of the food web)
Top Down Hypothesis: Lynx predation controls the hare population size. High predator density causes hare crashes.
Interaction hypothesis: Food limits & predation act together and the combined effect is stronger than one alone
Lotka-Volterra Model Assumptions:
______________
______________
______________
______________
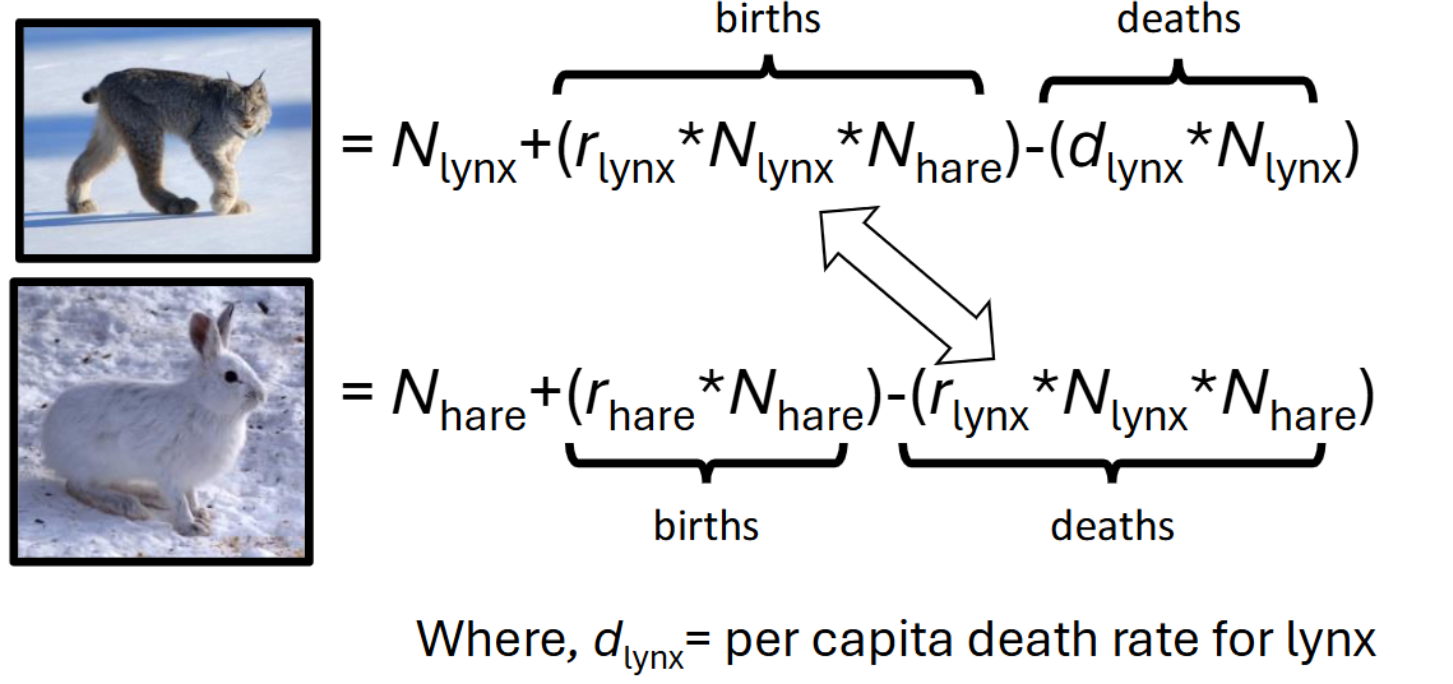
Formula: ______________
Lotka-Volterra Model Assumptions: (cels)
Environment does not change
Prey grow exponentially without predators
No resource limitations for prey
Predators rely on single prey species
Formula:
Metapopulations & Conservation Biology
Habitat fragmentation creates _______ populations
Even protected pops. may be too small to _______
Factors increasing persistence:
___________
___________
___________
___________
Metapopulations & Conservation Biology
Habitat fragmentation creates isolated populations
Even protected pops. may be too small to persist
Factors increasing persistence: (Habitat Diversity Proximity Size)
Larger habitat patches
Higher genetic diversity
Proximity to other populations
Larger pop. size
Population Momentum:
Continued growth after ________ declines
Caused by a large number individuals reaching ______ ______
Growth over time
We have experienced recent ________ growth
Population Momentum:
Continued growth after fertility declines
Caused by a large number individuals reaching reproductive age
Growth over time
We have experienced recent exponential growth
What is a community
Community: Consists of _________________
Not just which species are present but how they ________
Biological communities are more than the __________
What is a community
Community: Consists of all populations of different species interacting in a particular area
Not just which species are present but how they interact
Biological communities are more than the sum of their parts
Species Interactions
________-based framework
Can be positive (+), negative (-), or neutral (0) fitness effects
Four major interaction types within the framework
Commensalism (_____)
Competition (_____)
Consumption (_____)
Mutualism (_____)
Species Interactions
Fitness-based framework
Can be positive (+), negative (-), or neutral (0) fitness effects
Four major interaction types within the framework
Commensalism (+ / 0)
Competition (- / -)
Consumption (+ / -)
Mutualism (+ / +)
Commensalism (+ / 0)
Difficult to study because “________” is hard to quantify
Can change depending on factors like _________
Orchids get sun by growing on trees and it doesn’t affect the trees. However, if the orchid population grows a lot, it can weigh down branches or block sun.
Commensalism (+ / 0)
Difficult to study because “no effect” is hard to quantify
Can change depending on factors like density
Orchids get sun by growing on trees and it doesn’t affect the trees. However, if the orchid population grows a lot, it can weigh down branches or block sun.
Competition (- / -)
Lowers fitness
Growth, survival, reproduction
Intraspecific competition
(Within/between) species
Interspecific competition
(Within/between) specific
There’s direct and indirect competition
Direct- _________________
Indirect- _________________
Competition (- / -)
Lowers fitness
Growth, survival, reproduction
Intraspecific competition
Within species
Interspecific competition
Between specific
There’s direct and indirect competition
Direct- physical interference
Indirect- depletion of shared resources
Competitive Exclusion
Competition affects the (realized/fundamental) niche, not necessarily (realized/fundamental)
Competitive exclusion occurs due to complete ________ overlap
(Driving one species to ________)
Niche Differentiation and Character Displacement
________ response to competition
Favors individuals that compete (less/more) (use different niche spaces)
Trait divergence is often driven by ________
Ex. Galapagos Finches
Competitive Exclusion
Competition affects the realized niche, not necessarily fundamental
Competitive exclusion occurs due to complete niche overlap
(Driving one species to extinction)
Niche Differentiation and Character Displacement
Evolutionary response to competition
Favors individuals that compete less (use different niche spaces)
Trait divergence is often driven by competition
Ex. Galapagos Finches
Consumption Interaction
Consumer benefits, victim loses _______
Three main types
_______
_______
_______
Consumption Interaction
Consumer benefits, victim loses fitness
Three main types
Predation (Cheetah & Gazelle)
Herbivory (Kowala & Eucalyptus)
Parasitism (Lice & Humans)
Coevolutionary Arms Race: __________________________
Ex. Cheetahs and Gazelles are both getting faster
Types of Defenses prey species can evolve
______________: Always present
Ex. Thorns on a rose
______________: Induced w/ response to threat
Ex. Plants producing toxic chemicals when being eaten
Coevolutionary Arms Race: As a species evolves something that benefits their fitness, the other species will also be evolving to counter them
Ex. Cheetahs and Gazelles are both getting faster
Types of Defenses prey species can evolve
Constitutive defenses: Always present
Ex. Thorns on a rose
Inducible defenses: Induced w/ response to threat
Ex. Plants producing toxic chemicals when being eaten
Parasite - Host Interaction
Some parasites manipulate host _________
Ex. Parasite infects an ant, changing their behavior and making them get eaten by birds who then transmit the parasite to a new location
Goal is increasing the _____________ of the parasite
Parasite - Host Interaction
Some parasites manipulate host behavior
Ex. Parasite infects an ant, changing their behavior and making them get eaten by birds who then transmit the parasite to a new location
Goal is increasing the transmission rate of the parasite
Mutualism (+ / +)
Both species are experiencing _______ benefits
Flowers & Pollinators (Nectar is produced solely as a reward for pollinators)
Clown fish eating sea anemone predators and sea anemone protecting the clown fish
Mutualists are not ________
Actions are designed to maximize fitness
Context dependent: Some of these interactions can turn into (___) interactions under stressful conditions
Ex. Coral bleaching
Mutualism (+ / +)
Both species are experiencing fitness benefits
Flowers & Pollinators (Nectar is produced solely as a reward for pollinators)
Clown fish eating sea anemone predators and sea anemone protecting the clown fish
Mutualists are not altruistic
Actions are designed to maximize fitness
Context dependent: Some of these interactions can turn into (+/-) interactions under stressful conditions
Ex. Coral bleaching
Community Structure
Four key attributes
Number of species
Relative abundance
Network of interactions
Physical structure of the environment
How to measure community diversity
Species richness: Counting the number of species present
Species evenness: Relative abundance to each other
Higher evenness → higher diversity (no species dominating)
Species diversity: Richness + Eveness