AP Biology: Standard Error and Standard Deviation Concepts and Calculations
1/16
There's no tags or description
Looks like no tags are added yet.
Name | Mastery | Learn | Test | Matching | Spaced | Call with Kai |
|---|
No study sessions yet.
17 Terms
Standard Error of the Mean
Statistical measure of how far the sample average of the data is likely to be from the true population mean.
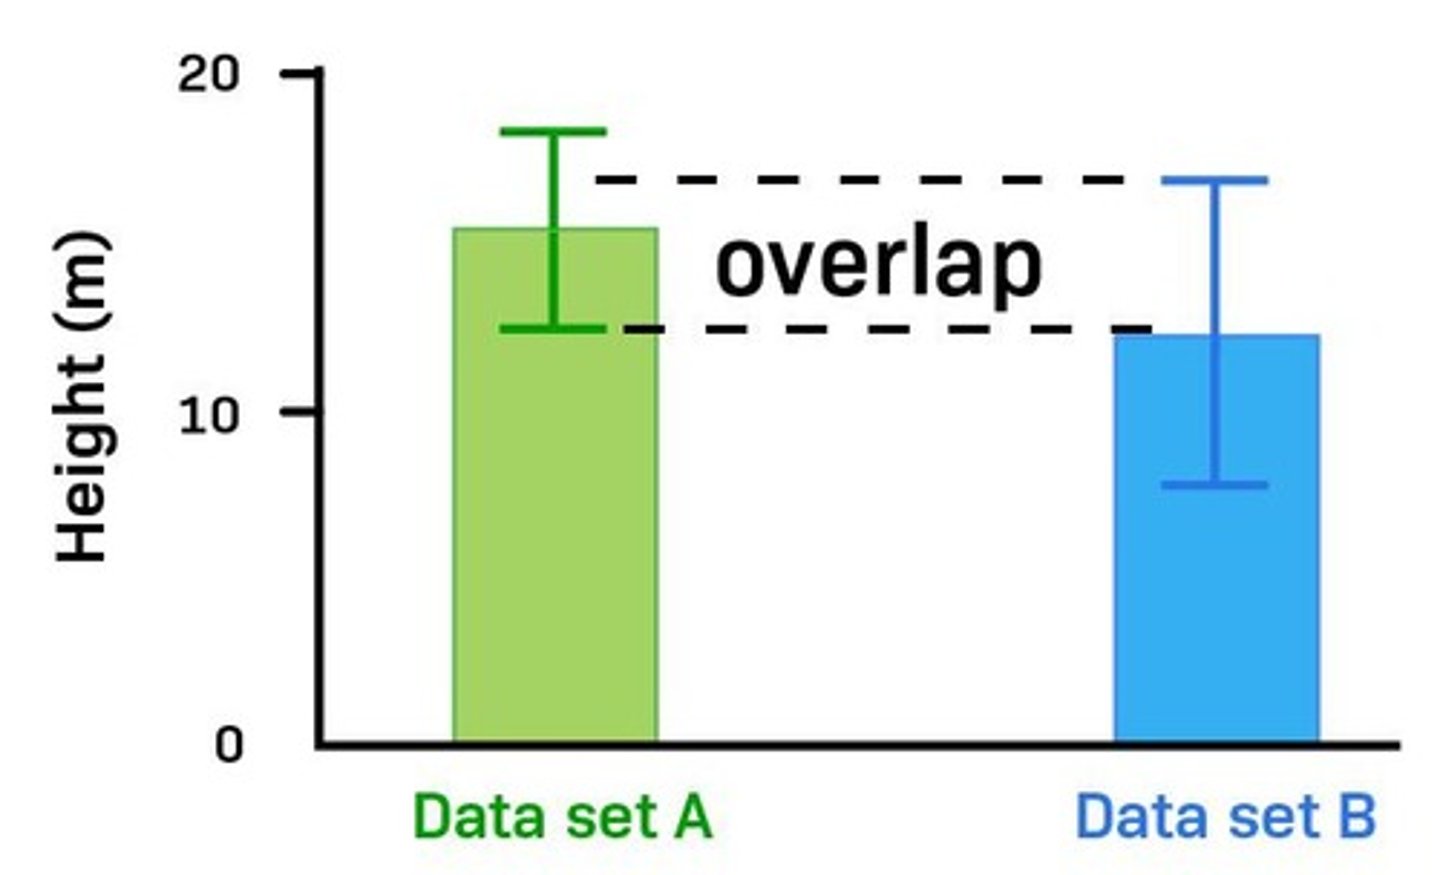
Error bars
Bar-headed lines that represent the variability of data.
Standard Error Bars
When error bars overlap, the data is not significant.
Graphing Standard Error of the Mean
Data A: Mean = 10, SEM = +/- 1; Data B: Mean = 8, SEM = +/- 3.
Smaller error bars
Indicate more significant data, associated with large data sample sizes and small variation in data.
Larger error bars
Indicate less significant data, associated with small data sample sizes and large variation in data.
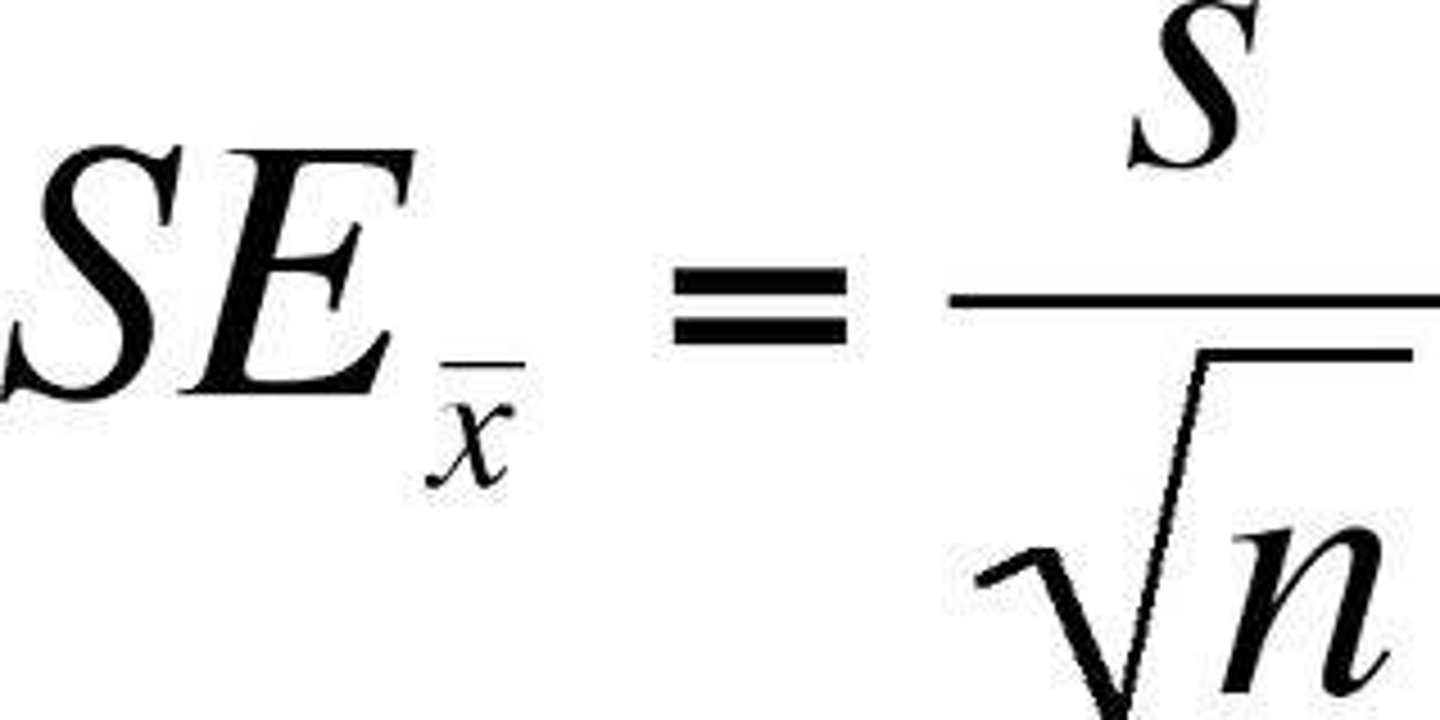
Standard Error of the Mean formula
SEx = standard error of the mean; S = standard deviation; n = number of data points.
Google Sheets SEM Calculation
Input data into individual boxes, enter equation: =STDEV(data) / SQRT(COUNT(data)).
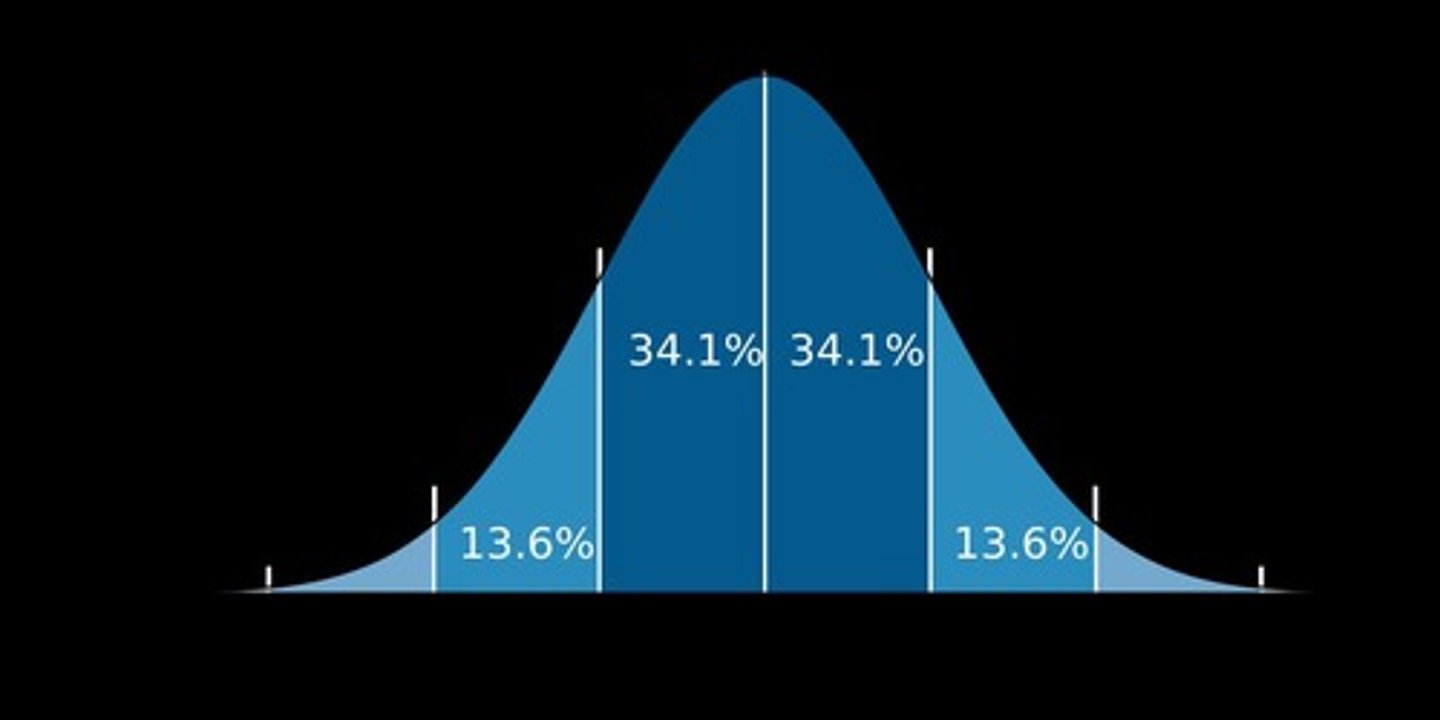
Standard Deviation
Normal Distribution: probability distribution where the values of a random variable are distributed symmetrically.
Within Group Variation
Variations within variables; not all the values within each group are the same.
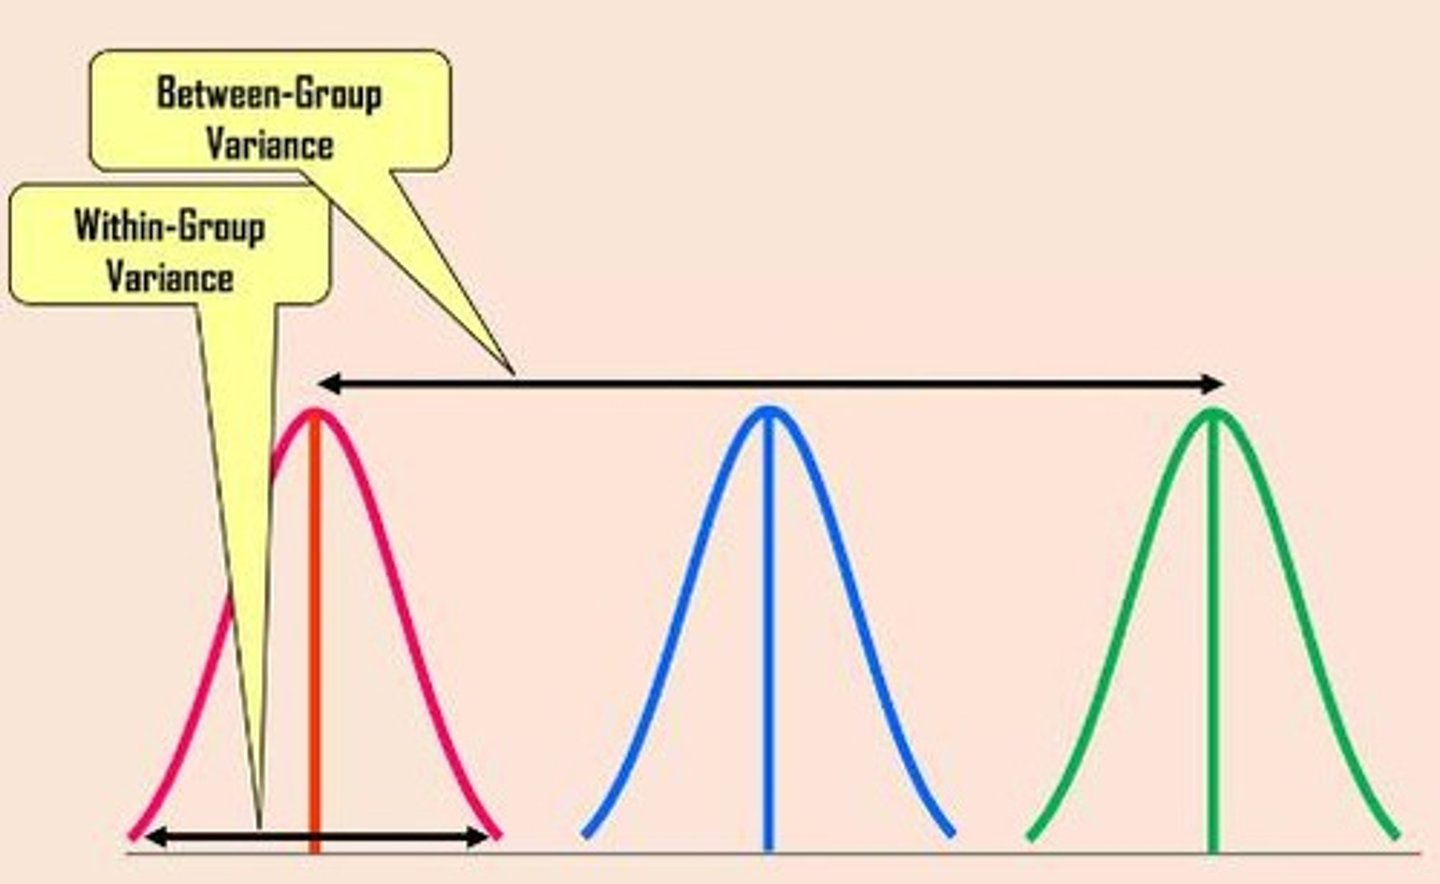
Between Group Variation
Variations among all variables.
Standard deviation definition
Standard deviation is a measure of how each value in a data set varies or deviates from the mean.
Standard deviation percentages
68% of data will be within 1 standard deviation; 95% of data will be within 2 standard deviations; 99% of data will be within 3 standard deviations.
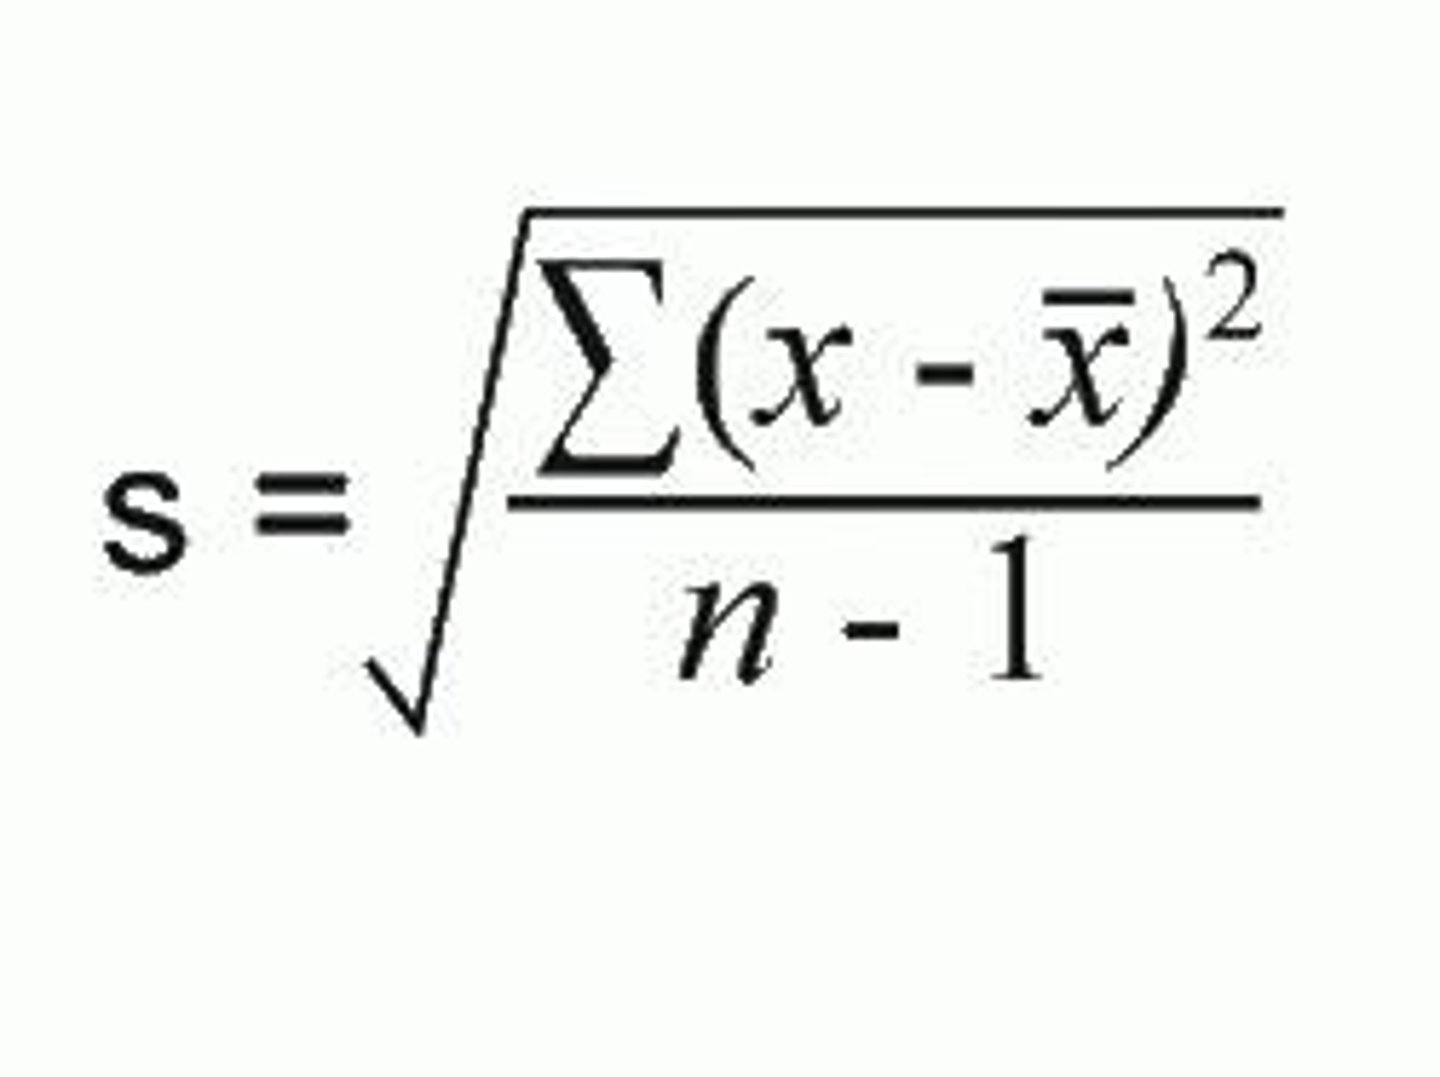
Standard Deviation formula components
x̅ = Mean; x = data point; n = Number of points of data; ∑ = Summation sign; √ = Square root.
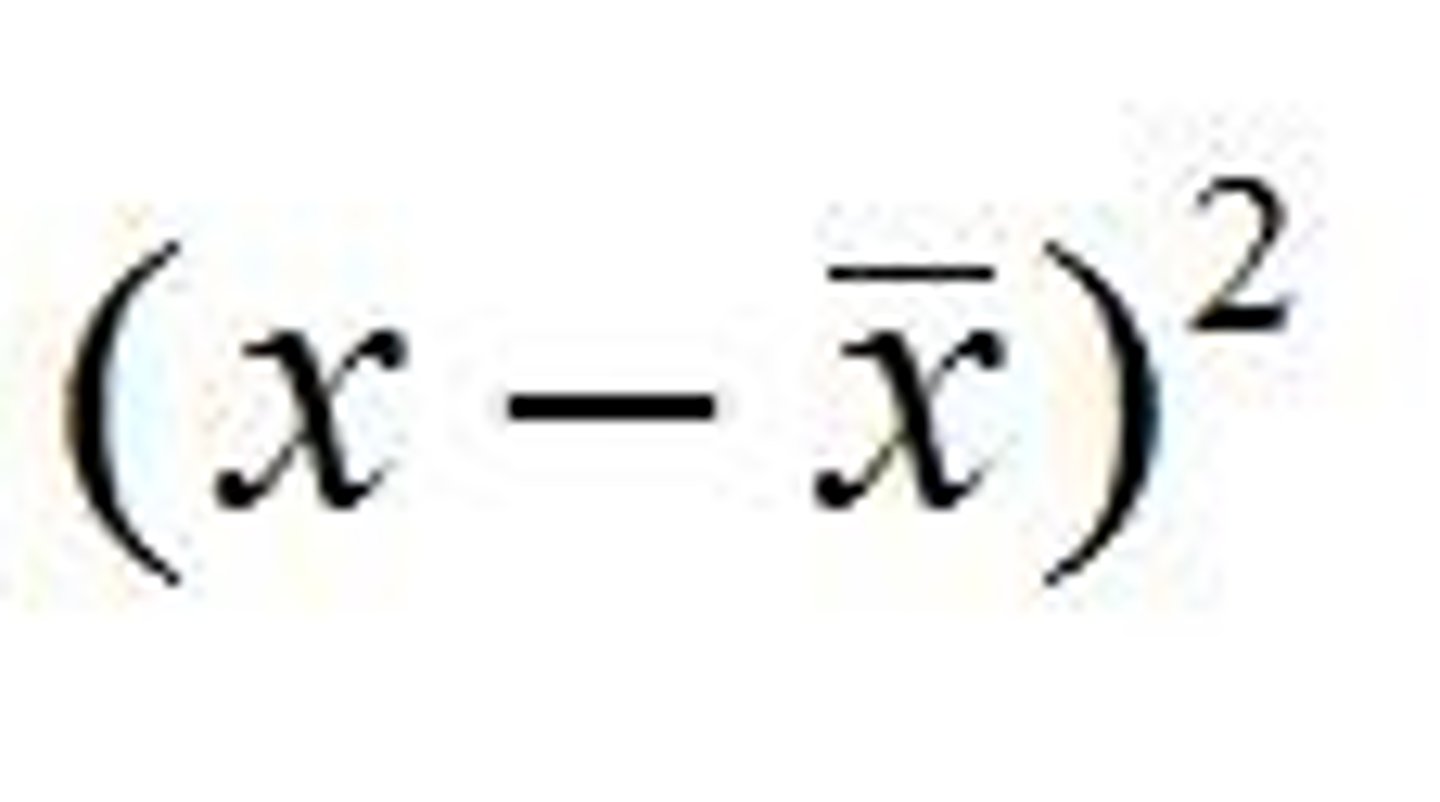
Steps to Calculating Standard Deviation
1. Find the mean of the set of data. 2. Find the difference between each value and the mean. 3. Square the difference. 4. Find the sum of these squares. 5. Divide the sum by the number of data points - one. 6. Take the square root to find the standard deviation.
Standard Deviation Example Problem
Data: 1, 2, 3, 4, 5; n = 5, Total = 15; X = 3; Sum = 10; Sd = √(10/(n-1)); Sd = √(10/4); Sd = √(2.5); Sd = 1.58.
Standard Deviation and Bell Curve
Once you've calculated standard deviation: Place average in middle of bell curve. Add and subtract TWO Standard Deviations.