Must Know Values & Formulas - Exam 1
1/45
There's no tags or description
Looks like no tags are added yet.
Name | Mastery | Learn | Test | Matching | Spaced |
|---|
No study sessions yet.
46 Terms
Chemistry Reference Ranges: pt 1
Sodium: 136-145 mmol/L
Potassium: 3.5-5.0 mmol/L
Chloride: 98-107 mmol/L
Total CO2: 22-33 mmol/L
Creatinine: 0.8-1.2 mg/dL
Blood Urea Nitrogen (BUN): 6-20 mg/dL
Glucose (fasting): 74-100 mg/dL
Hemoglobin: < 5.7%
Haptoglobin: 30-200 mg/dL
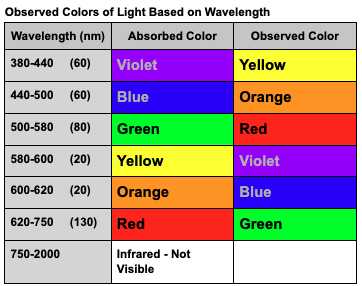
Wavelength Values
Wavelength + Color
< 380 = UV, not visible
380-440 = Violet
440-500 = Blue
500-580 = Green
580-600 = Yellow
600-620 = Orange
620-750 = Red
750-2000 = IR, not visible
Visible Region Color Wheel
Chromagen absorbs wavelengths and transmits the remaining wavelengths.
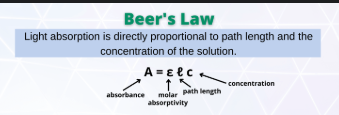
Beer’s Law: concentration → absorbance.
absorbed wavelength used to measure concentration is complementary to the transmitted wavelength.
Relationships:
red ⇌ green
blue ⇌ orange
yellow ⇌ purple.
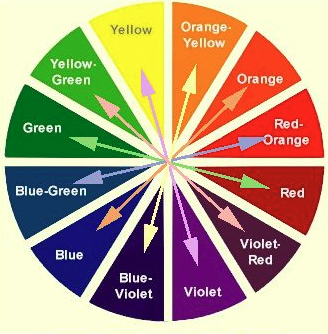
Complementary Colors
red ⇌ green
blue ⇌ orange
yellow ⇌ purple
Bichromatic Analysis Calculations
Corrected Absorbance=Aλ1−Aλ2
Where:
Aλ1 is the absorbance at the primary wavelength (where the analyte has maximum absorption).
Aλ2 is the absorbance at the secondary wavelength (where the analyte has minimal absorption but interfering substances absorb significantly)
Beers Law
A = εbc
Beers Law Application: Standard Curve
Conc(u)/Conc(s) = Abs (u)/Abs (s)
Conc(u)= [Abs (u) * Conc(s) ] / Abs (s)
![<p><span style="color: #ffffff"><strong>Conc(u)/</strong></span><span><strong>Conc(s) </strong></span><span style="color: #ffffff"><strong>= Abs (u)/Abs (s)</strong></span><span style="color: #ffffff"><br></span><span style="color: #ffffff">Conc(u)= [Abs (u) * Conc(s) ] / Abs (s)</span></p>](https://knowt-user-attachments.s3.amazonaws.com/5f119d8d-48d8-4f64-8199-9798c65219cb.png)
Diagnostic Criteria of Diabetes
Fasting Plasma Glucose (FPG) ≥ 126 mg/dL
2-hour Plasma Glucose (OGTT) ≥ 200 mg/dL
HbA1c ≥ 6.5%
Random Plasma Glucose (RPG) ≥ 200 mg/dL with symptoms
FPG + HbA1: FPG ≥126 mg/dL & HbA1c ≥6.5% on the same occasion
Fasting Plasma Glucose (FPG)
Diagnostic Threshold + Confirmation Needed?
≥126 mg/dL
No if symptomatic
Yes if asymptomatic (repeat test or another diagnostic test required
2-Hour OGTT (2h-PG)
Diagnostic Threshold + Confirmation Needed?
≥200 mg/dL
No if symptomatic
Yes if asymptomatic (repeat test or another diagnostic test required
HbA1c
Diagnostic Threshold + Confirmation Needed?
≥6.5 mg/dL
No if symptomatic
Yes if asymptomatic (repeat test or another diagnostic test required
Random Plasma Glucose (RPG)
Diagnostic Threshold + Confirmation Needed?
≥200 mg/dL
No if symptomatic
Yes if asymptomatic (repeat test or another diagnostic test required
FPG + HbA1c
Diagnostic Threshold + Confirmation Needed?
FPG ≥126 mg/dL & HbA1c ≥6.5% on the same occasion
No (diabetes confirmed even in asymptomatic patients).
If discordant, repeat abnormal test.
Diagnostic Criteria of Diabetes Explanation
Symptoms indicate diabetes if hyperglycemia is present
one test meeting the threshold is sufficient. Asymptomatic patients require a confirmatory test.
RPG ≥200 mg/dL is diagnostic only with symptoms.
If FPG ≥126 mg/dL and HbA1c ≥6.5% are both abnormal on the same occasion = diabetes confirmed
Diagnostic Criteria of Diabetes: Symptoms Matter
If a patient has symptoms of hyperglycemia (e.g., excessive thirst, frequent urination, weight loss), a single diagnostic test meeting the threshold confirms diabetes—no repeat test needed.
Diagnostic Criteria of Diabetes - Asymptomatic Patients Need Confirmation:
If a patient has no symptoms, a second confirmatory test (either the same test repeated on a different day or a different test) is needed.
Diagnostic Criteria of Diabetes - RPG Exception:
RPG ≥200 mg/dL is diagnostic only if symptoms are present. If asymptomatic, a second test (FPG, HbA1c, or OGTT) is required.
Diagnostic Criteria of Diabetes - Combining Tests:
If FPG ≥126 mg/dL and HbA1c ≥6.5% are both abnormal on the same occasion, diabetes is confirmed even in asymptomatic patients. If discordant, repeat the abnormal test.
Diabetes Critical Values:
Hypoglycemia: Panic value is <50 mg/dL
Hyperglycemia: Panic value is >500 mg/dL
Diagnostic Criteria for GDM
Diagnosis is based on glucose levels during pregnancy, including FPG ≥92 mg/dL, 1-hour OGTT ≥180 mg/dL, or 2-hour OGTT ≥153 mg/dL.
Diagnostic Criteria for DM
Diagnosis is based on glucose levels, including FPG ≥126 mg/dL, 2-hour OGTT ≥200 mg/dL, or HbA1c ≥6.5%. Urine Glucose: 180-200 mg/dL
Glucose Hexokinase Method: Important Enzymes and Substrates
1.D-glucose + ATP(Mg++) + hexokinase → glucose-6- phosphate + ADP
EDTA anticoagulant binds Mg++ = increased false negatives
2.glucose-6-P + NAD+ (or NADP+) + G6PD → 6-phosphogluconic acid + NADH (or NADPH) + H+
Glycated Hemoglobin (HbA1c)
Reflects average glucose over 2-3 months
Target < 7.0% for most adults
GOD POD method: Important Enzymes and Substrates
Beta-D glucose + O2 + glucose oxidase → gluconic acid + H2O2
H2O2 + reduced dye + peroxidase → color, oxidized dye + H2O2
Renal Threshold and Glucose
the plasma glucose concentration at which glucose begins to appear in the urine, typically around 180-200 mg/dL.
Analytical Methods for Glycosylated Hemoglobin
Glycosylated Hgb = Total Hgb - Non-glycosylated Hgb
Comparison for SIADH, Diabetes Insipidus, and End-Stage Renal Disease
SIADH → Water retention → Hyponatremia → Concentrated urine.
DI → Water loss → Hypernatremia → Dilute urine.
ESRD → Impaired sodium/water handling → Often dilutional hyponatremia → Urine osmolality depends on kidney function.
Thiazide diuretics ( block sodium reabsorption) → Can cause hyponatremia that mimics SIADH → Increased urine sodium excretion → Treat hypertension
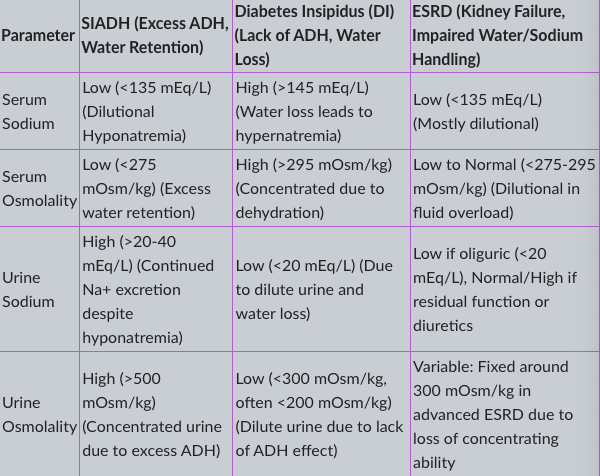
Serum Sodium
Parameter | SIADH (Excess ADH, Water Retention) | Diabetes Insipidus (DI) (Lack of ADH, Water Loss) | ESRD (Kidney Failure, Impaired Water/Sodium Handling) |
|---|---|---|---|
Serum Sodium | Low (<135 mEq/L) (Dilutional Hyponatremia) | High (>145 mEq/L) (Water loss leads to hypernatremia) | Low (<135 mEq/L) (Mostly dilutiona |
Serum Osmolality
Parameter | SIADH (Excess ADH, Water Retention) | Diabetes Insipidus (DI) (Lack of ADH, Water Loss) | ESRD (Kidney Failure, Impaired Water/Sodium Handling) |
|---|---|---|---|
Serum Osmolality | Low (<275 mOsm/kg) (Excess water retention) | High (>295 mOsm/kg) (Concentrated due to dehydration) | Low to Normal (<275-295 mOsm/kg) (Dilutional in fluid overload |
Urine Sodium
Parameter | SIADH (Excess ADH, Water Retention) | Diabetes Insipidus (DI) (Lack of ADH, Water Loss) | ESRD (Kidney Failure, Impaired Water/Sodium Handling) |
|---|---|---|---|
Urine Sodium | High (>20-40 mEq/L) (Continued Na+ excretion despite hyponatremia) | Low (<20 mEq/L) (Due to dilute urine and water loss) | Low if oliguric (<20 mEq/L), Normal/High if residual function or diuretics |
Urine Osmolality
Parameter | SIADH (Excess ADH, Water Retention) | Diabetes Insipidus (DI) (Lack of ADH, Water Loss) | ESRD (Kidney Failure, Impaired Water/Sodium Handling) |
|---|---|---|---|
Urine Osmolality | High (>500 mOsm/kg) (Concentrated urine due to excess ADH) | Low (<300 mOsm/kg, often <200 mOsm/kg) (Dilute urine due to lack of ADH effect) | Variable: Fixed around 300 mOsm/kg in advanced ESRD due to loss of concentrating ability |
Principal Plasma Electrolytes References Ranges
Sodium: 136-145 mmol/L
Potassium: 3.5-5.0 mmol/L
Chloride: 98-107 mmol/L
Total CO2: 22-33 mmol/L
Anion Gap
Alternative Formula: AG = [Na+] - [Cl- + HCO3-]
Reference Range: 7-14 mmol/L
Osmolality Measurements
• Normal plasma osmolality: 275-300 mOsm/Kg
• Urine osmolality: 300-900 mOsm/Kg
Calculated Osmolality (simplified)
2[Na+] + [glucose]/20 + [BUN]/3
Osmolal Gap Calculation
Osmolal Gap = Measured Osmolality - Calculated Osmolality
Normal value included in calculated osmolality = 9 mOsm/K
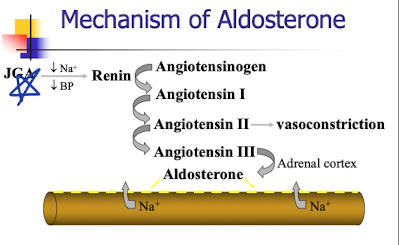
ADH release factors
Protein Analysis Reference Range
6.5-8.3 g/dL
Acute Phase Proteins
APP’s play a role in host defense, balance occurs due to compensation
Ex: Fibrinogen, CRP, AAT, C3, AAG, a2-Macroglobulin, haptoglobin and ceruloplasmin
APP proteins increase, levels of negative APR proteins decrease
Ex: albumin, prealbumin and transferrin) decrease.
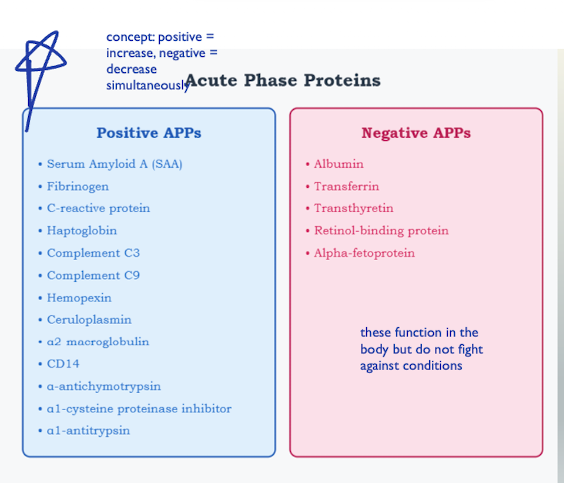
Positive APPs Types
SAA
Fibrinogen
C-reactive protein
Haptoglobin
C3
C9
Ceruloplasmin
a2 macroglobulin
a1-antitrypsin
Negative APPs Types
albumin
transferrin
transthyretin
retinol-binding protein
alpha-fetoprotein
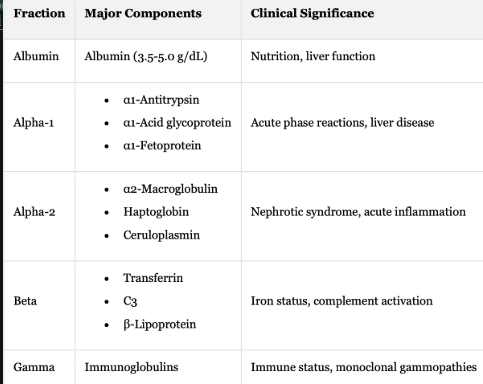
Protein Electrophoresis: Fraction + Major Components + Clinical Significance
Albumin + Albumin (3.5-5.0 g/dL) + Nutrition, liver function
Alpha-1 + Acute phase reactions, liver disease
α1-Antitrypsin
α1-Acid glycoprotein
α1-Fetoprotein
Alpha-2 + Nephrotic syndrome, acute inflammation
α2-Macroglobulin
Haptoglobin
Ceruloplasmin
Beta + Iron status, complement activation
Transferrin
C3
β-Lipoprotein
Gamma Immunoglobulins + Immune status + monoclonal gammopathies
LDL Cholesterol Calculation
Calculated using the Friedewald equation:
LDL = Total Cholesterol - HDL - (Triglycerides/5),
applicable when triglycerides are <400 mg/dL.
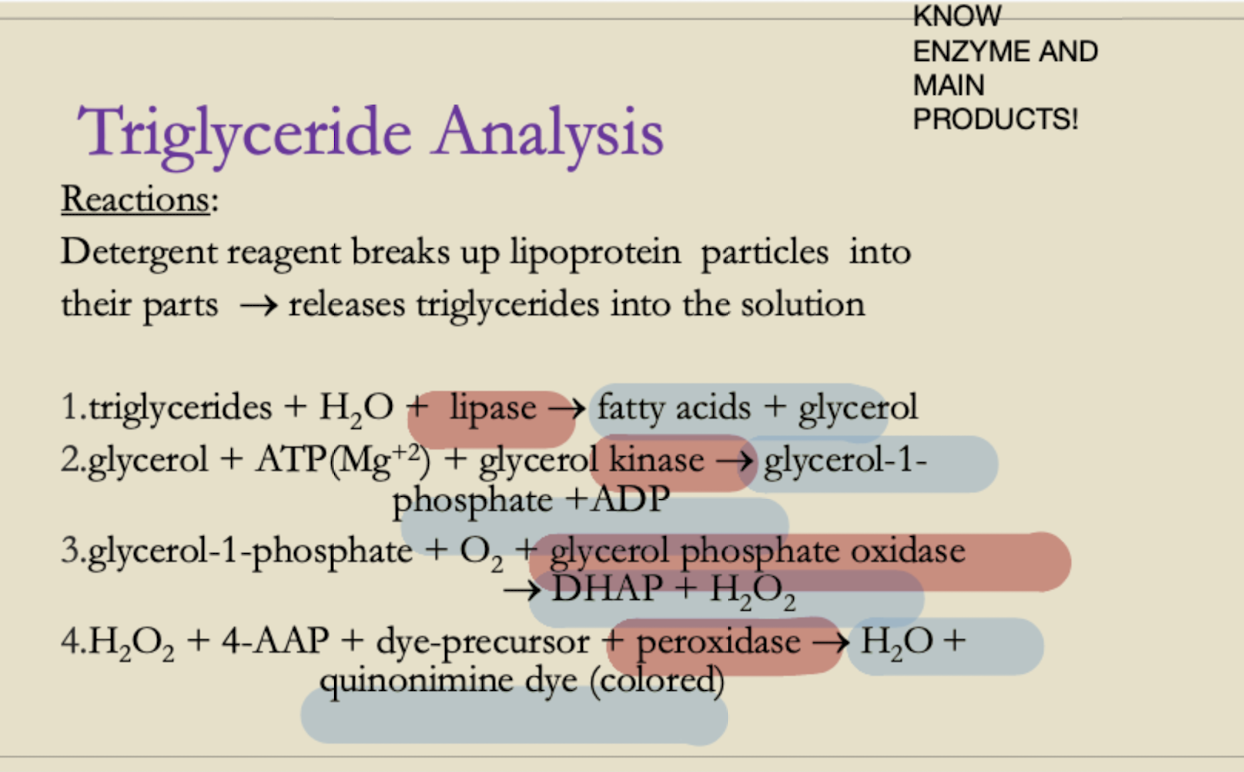
Triglyceride Analysis
Enzymatic cascade reaction:
1. Triglycerides → Glycerol + Fatty acids (Lipase)
2. Glycerol + ATP → Glycerol-1-phosphate (Glycerol kinase)
3. Glycerol-1-phosphate → DHAP + H₂O₂ (GPO)
4. H₂O₂ + Chromogen → Colored product (Peroxidase)
NCEP Guidelines for Lipid Levels: Cholesterol, Triglycerides, Lipoprotein(s)
Parameter + Desirable Level + Reference Range
Total Cholesterol + ≤200 mg/dL + 140-200 mg/dL
LDL Cholesterol + ≤100 mg/dL + Varies by risk
HDL Cholesterol + ≥60 mg/dL + >40 mg/dL
Triglycerides + <150 mg/dL + 70-150 mg/dL
Lipoprotein(a) + <30 mg/dL + Varies
Major Risk Factors: Atherosclerosis & Lipids - Ranges
• Age (>45 men, >55 women)
• Hypertension (>140/90 mmHg)
• Low HDL (<40 mg/dL)
• High LDL (>100 mg/dL)