Evidence Based Practice Final
1/92
There's no tags or description
Looks like no tags are added yet.
Name | Mastery | Learn | Test | Matching | Spaced | Call with Kai |
|---|
No analytics yet
Send a link to your students to track their progress
93 Terms
What tests would you use to answer the question “is variable D associated with variable E”?
Pearson correlation: each participant has a value for two continuous variables
Spearman correlation: the non-parametric version where each participant has a value for two variable, one or mroe of which may be ordinal
what is a correlation?
a measure that expresses the extend to which two variables are related or “change together”
can range from -1 to +1
what tests would you use to answer the question “can the values of variable D (and E, etc) predict the value of Variable F?
Linear regression: each participant has a continuous value for variables D, E, and F. Beta values then quantify the strength of the relationship. R2 quantifies the proportion of the variability in variable F that is predictec by variables D and E
Logistic regression: Each participant has a continuous value for variables D and E. Each participant has a categoraical value for F (yes or no) . Beta values quanitify the strength of the relationship.
what is a regression?
a method to estimate the relationship between a dependent (response) variable and one or more independent variables (predictors)
what tests could you use to answer the question “is population G different from population H in terms of some characterstic or outcome measure?”
unpaired t-test: if comparing two populations
one way ANOVA (not repeated measures): if comparing more than two populations
fisher exact test: if omparing only two populations with only two possible outcomes (yes or no)
Chi square test: if comparing more than two populations or outcomes with only two possible outcomes (yes or no)
what are the parametric vs non-parametric tests?

what are categorical statistical tests?
organize the available data by categories— basically puts the data in piles
ex of categories: control group vs experimental group (group) ; before the intervention vs after the intervention (time)
ex of tests: t-test, ANOVA, chi square
what are ordinal statistical tests?
you measure at least two variables that can be represented numerically
asking of the variables scale together: are larger values of a variable consistently accompanied by larger or smaller values of the other variable?
ex of continuous measures: age, height, weight, baseline levels
ex of tests: correlation, regression
in general, when your data is brouped in terms of 1 categorical variable and has 2 levels (your comparing 2 groups OR pre vs post) then use what tests?
t test (unpaired or paired), fisher exact test
in general, when your data is grouped in terms of 1 categorical variable and has more than 2 levels (your comparing 3 groups, or pre vs post vs follow up) then use what tests?
1 way ANOVA, chi squared
in general, when your data is grouped in terms of more than one categorical variable (your comparing 2 groups AND pre vs post) then use what tests?
2 way ANOVA, 3 way ANOVA, etc
in general, when you are comparing values of mutliple variables to each other then use what tests?
correlation, regression
what is an ANCOVA tests?
it takes a t-test/ANOVA and correlation and does them at the same time to get results of both.
what is an effect size?
a quantitative measure of the magnitude of the experimental effect. helps us to compare across different studies or measures
effect size accounts for the ______ of the effect and the ________ of the effect.
mean, variability
a big effect size is achieved with a _______, ______ change in the outcome measure of interest.
large, consistent
so we would want a small standard deviation because it means there is less variability
what is cohens d?
a common effect size reported for categorical statistical tests
larger values indicate a larger change caused by an intervention
what is pearson’s correlation coefficient?
an effect size reported for correlations (between -1 adn +1)
larger calues indicate a stronger relationships between two variablesho
how do we interpret pearson’s correlation coefficient?
large effect > 0.5
medium effect >0.3
small effect >0.1
if you have a _____ effect size, you can identifiy a statistically significant effect with a small sample size.
large
if you have a ______ effect size, you would need a larger sample size to identifiy a statistically significant effect
small
if a 95% CI for each group does not overlap with the mean value for the other group, what does this mean?
there is a most likely a statistically significant difference between groups
if a 95% CI does not overlap with zero, what does that mean?
the effect of that intervention alone is probably significant
what is logistic regression?
predicts what category an individual belongs ins
what is a linear regression?
predicts the value of a continueous measure
what happens when you reach test threshold?
performing tests to rule in/out conditions
what happens when you reach treatment threshold?
no further testing is performed because you have the information you need and know how to move forward with treatment
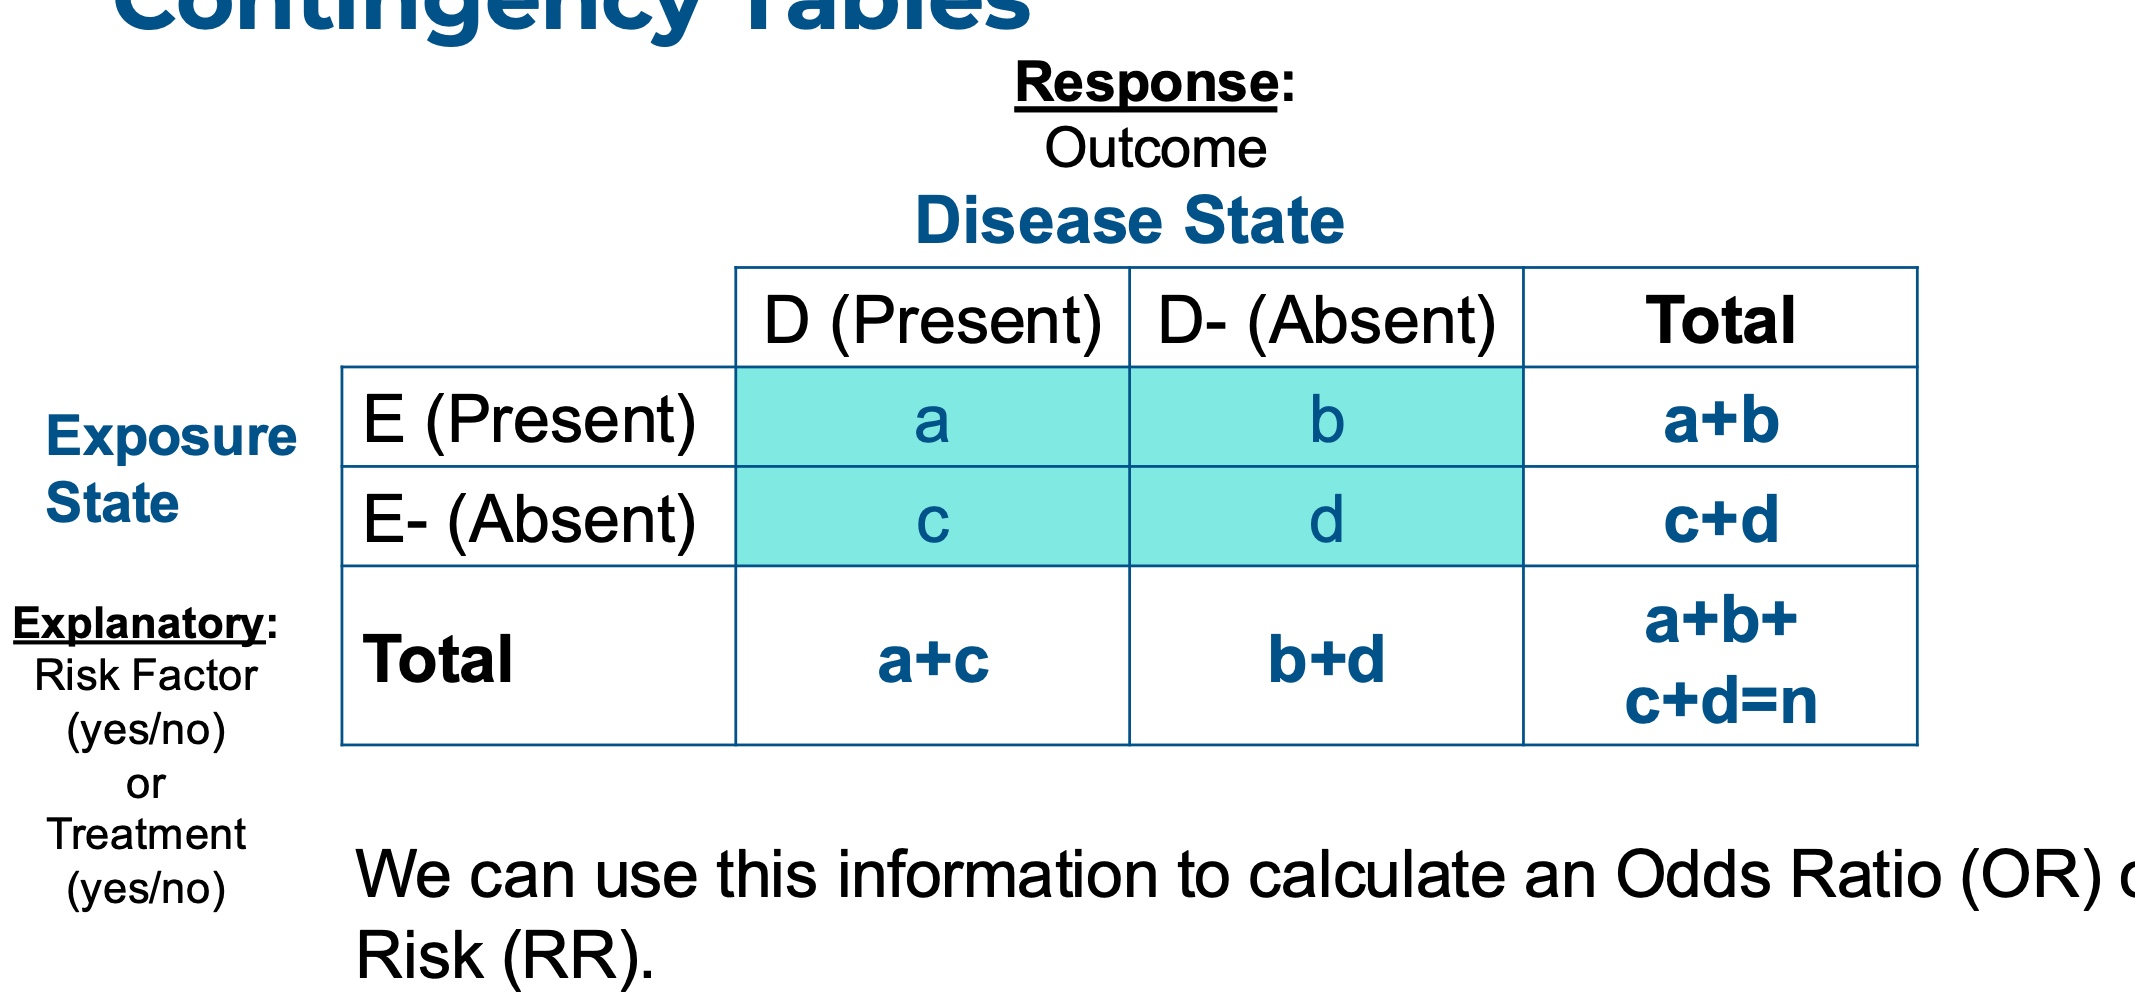
how do you read a 2×2 table?

what is sensitivity?
“true positive” test results— correctly identifying patients with a conditions
what is specificity?
“true negative” test results— correctly identifying patients who do not have a condition
how do we use specificity and sensitivity to make diagnostic decisions?
SnOut: when a test with high sensitivity is negative, the condition is ruled out
SpIn: when a test with high specificity is positive, the condition is ruled in
what is the goal when quantifying diagnostic accuracy?
to minimize false negatives and false positives
sensitive tests rarely have false negatives
specific tests rarely have false positives
what is the ideal threshold for sensitivity and specificity?
close to 1 or 100%
>80 is acceptable for many PT orthapaedic tests
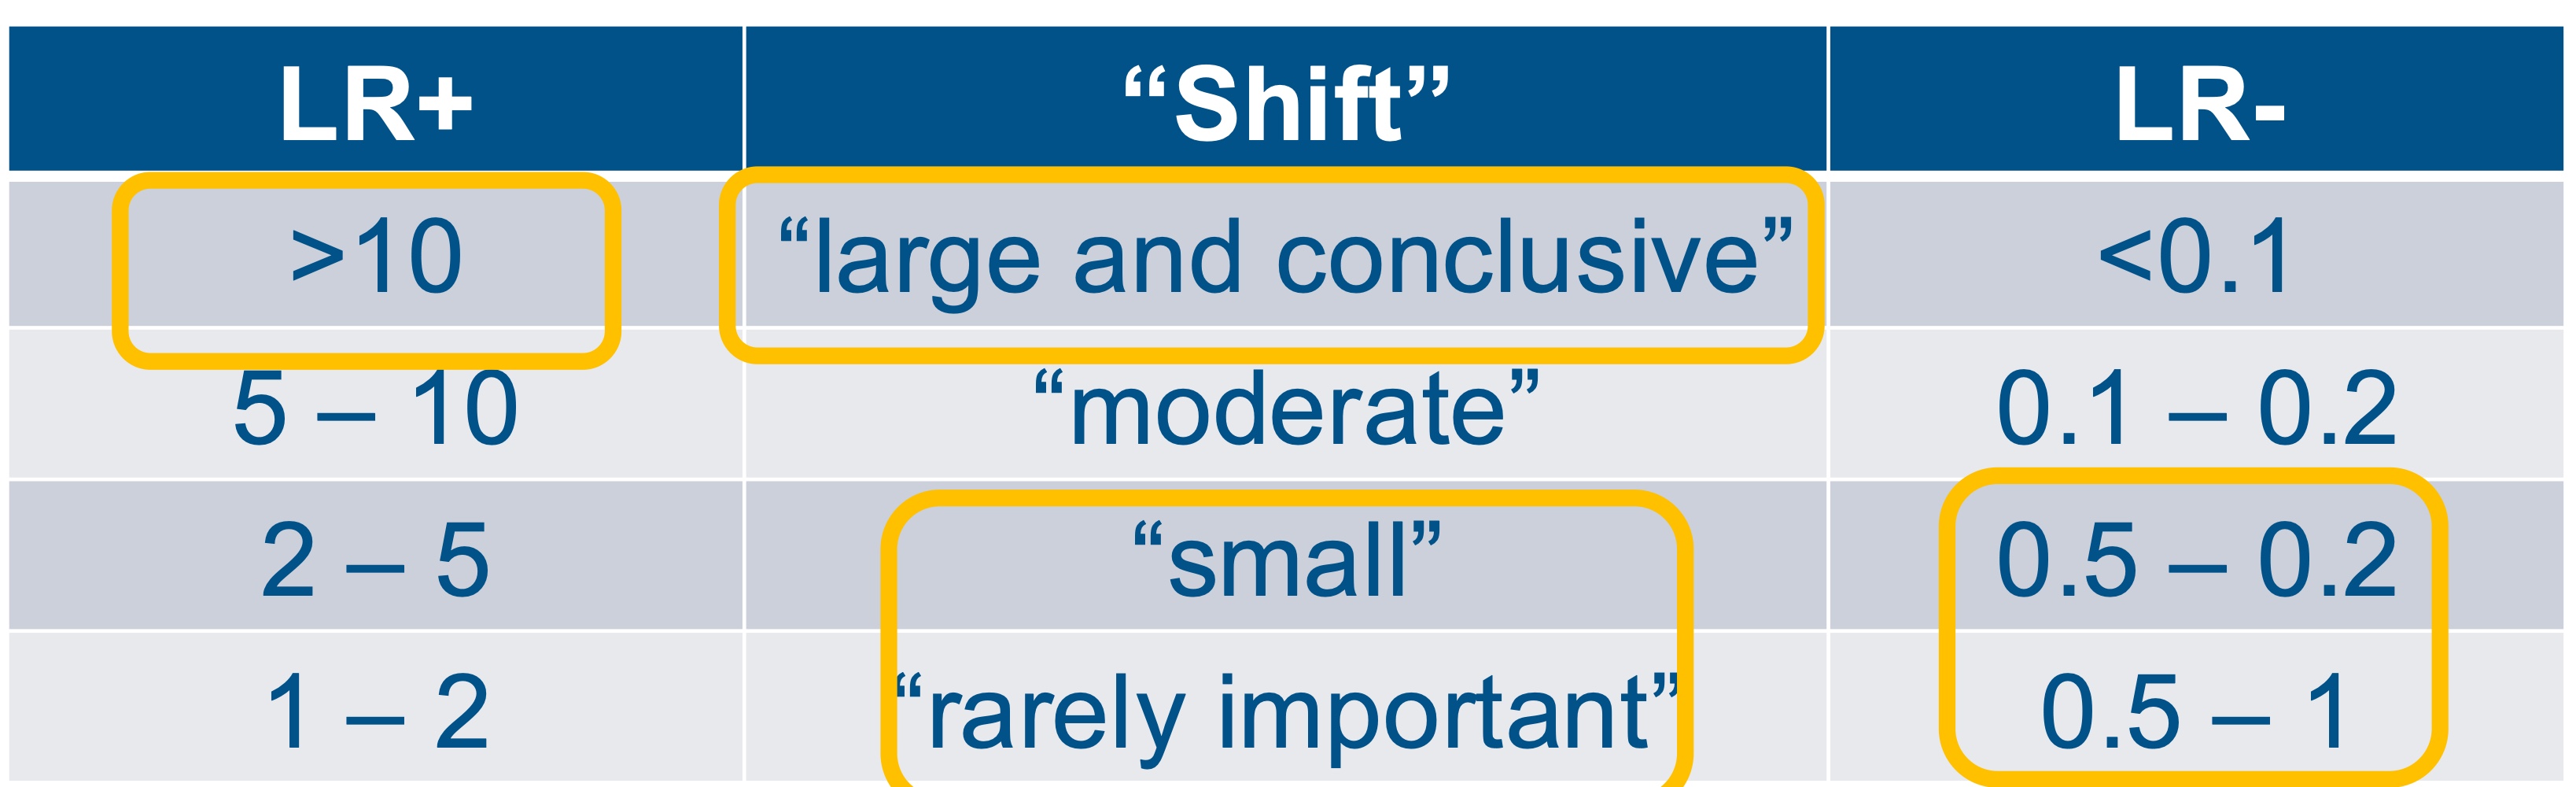
what is a positive likelihood ratio?
probability that a positive test result will be obtained in an individual with the condition compared to an individual without the competition
how do you interpret a positive likelihood ratio?
range from 0 to infinity, the larger the better
LR+ = 1, test produces result that is no better than chance
what is a negative likelihood ratio?
probability that a negative test result will be obtained in an individual with the condition compared to an individuals without the condition
how do you interpret a negative likelihood ratio?
range from 0 to 1, smaller is better
LR- = 1, test produces results that are no better than chance
what is pre-test probability?
probability that an individual has a condition based on their clinical presentation. a diagnostic test has not yet been administered
what is a post-test probability?
probability that an individual has a condition based on the findings from a diagnostic test
what is a nomogram?

how do we know an indivduals pre test probability?
known prevelance in population
prevalence in your clinic/setting
gut instict about probability individual has a condition
what is a positive predictive value?
proportion of patients who have the condition and test “positive” out of all the patients who test positive
how do we interpret a PPV?
if its 90%, then 90% of the people who test positive truly have the condition and 10% are false positives
what are negative predictive values?
proportion of patients who do not have the condition and test “negative” out of all patients who test “negative”
how do we interpret negative predictive values?
if NPV is 95%, then 95% of people who test negative truly don’t have the condition, and 5% are false negatives
what are the limitation of PPV and NPV?
they are based on teh overall prevelance of a condition which is defined by the number of people in the study
prevelance of conditions changes overtime
generalizable only when prevelance in your scenario is same as the prevelance in the study
what are reciever operating curves?
they plot the true positive rate vs the false positive rate
the area under the curve quantifies diagnostic accuracy
AUC=1 is perfect
AUC- .05 is like flipping a coin

what is the limitation of a reciever operator curve?
often the values are calculated using a “cut point” on the diagnostic test
how do we interpret likelihood ratios?
what is an association?
the relationship between two variables
ex: a risk factor and outcome
what is a correlation?
a mathematical way of quantifying a relationship between continuous variables that is linear.
reported from -1 to 1
what is a contingency table and when do we use it?
it’s used for dichotomous outcomes that you can quantify associations with probability.
includes an explanatory variable: exposure— risk factor or treatment
includes a response variable: outcome
what are odds?
the likelihood of an event occuring divided by the likelihood of the event not occuring
what is an odds ratio?
the ratio of the odds of an event occuring in one group to the odds of it occuring in another group
what is relative risk?
ratio of the risk (probability) of an outcome among “exposed” individuals to the risk among unexposed individuals
what is odds ratio compared to relative risk?
relative risk is easier to interpret as it is more intuitive
odds ratios are used for smaller sample sizes and when the outcome known is fixed
how do we interpret odds ratios?
OR>1 odds of the outcome is higher among the exposed than the unexposed
OR<1 odds of the outcome is lower among exposed than unexposed
OR=1 odds of the outcome is the same for both groups. no association between exposure to risk factor and outcome
how do we interpret 95% confidence intervals for ORs that cross 1?
it wont be statistically significant bc not confident that odds for the sample translate to the population
how do we interpret relative risk?
RR>1 implies exposed group has a higher probability of the event occuring than the unexposed group
RR<1 implies exposed group has a lower probability of the event occuring than the unexposed group
RR=1 implies the probability of the event is the same for both exposure group. no association between exposure state and disease state
what are clinical prediction rules?
a combination of clinical findings that provides meaningful information about an outcome… diagnosis, prognosis, treatment response
what is the goal of clinical prediction rules?
improve efficiency and accuracy of clinical decision making by organizing data in a meaningful way so we can diagnose and treat
what makes clinical preciction rules externally valid?
when the model performs accurately in new settings, populations, or time periods different from the one where it was developed
what is the number needed to treat (NNT)?
the number of individuals that needs to be treated with an intervention in order to get one “good” outcome
what is the number needed to harm?
the number of individuals that need to be treated with an intervention to have one adverse even
is a smaller or larger number needed to treat better?
smaller bc youd have to treat less people to get a good outcome
is a smaller or larger number needed to harm better?
larger bc you want to treat more people and not have an adverse event
what is selection bias threat to internal validity?
individuals in one interventino group differ systematically from individuals in a comparison group
what is unknown confounders threat to internal validity?
an unknown variable affects both the intervention recieved and the outcome
what is the solution to selection bias and unkown confounders?
random assignment of participants to groups.
stratified randomization can be used if you know theres a confounder and you can explicitly account for it
what is the placebo effect and white coat effect threats to internal validity?
placebo effect: a beneficial effect that is not due to the treatment itself
white coat effect: the act of meaasuring an outcome measure can change it
what are the solutions to placebo effect and white coat effect
include a control group— allows measurement of the placebo effect just from being in a study
blind participants to treatment group— allows measurement of placebo effect of participants thinking they recieved the treatment
what is testing bias threat to internal validity?
subjects become familiar with the test, causing changes in their outcomes
what is diffusion or imitation of treatment threat to internal validity?
subjects in one study group learn about activities in the other group and change their behavior
what is compensatory rivalry/resentful demoralization threat to internal validity?
subjects level of motivation changes overtime
what are the solutions to testing bias, diffusion or imitation of treatment, and compensatory rivalry/resentful demoralization?
include a control broup
blind subjects
what is assessor bias threat to internal validity?
outcome measures can be affected by assessor conscious or unconscioius predisposition
what is the solution to assessor bias?
blind assessor to the treatment group
what is insufficient sample size threat to internal validity?
if there are too few participants in a study, you wont detect a statistically signifianct difference, even if an important effect is present
what is the solution to insufficient sample size?
perform a power analysis to make sure you have a large enough sample size to detect an important effect
what is participant dropout threat to internal validity?
a subset of participants likely won’t finish the study. this may bias the restuls, particularly if the dropout occurs for an unknown reason
what are the solutions to participant dropout?
report dropout rate and why participants dropped out
intention to treat analysis: if a participant drops out, assume that their outcome measure would have stayed the same as their final value
what is conflict of interest threat to internal validity?
scientists or their funders would be expected to benefit financially from a specific result
what are the solutions to conflict of interest bias?
report all potential conflicts of itnerest
avoid funding from a company with a clear financial interest
what is multiple comparisons threat to internal validity?
every additional statistical test you perform increases the risk of false positives
what is the solution to multiple comparisons?
correct for the number of comparisons using the Bonferroni correction
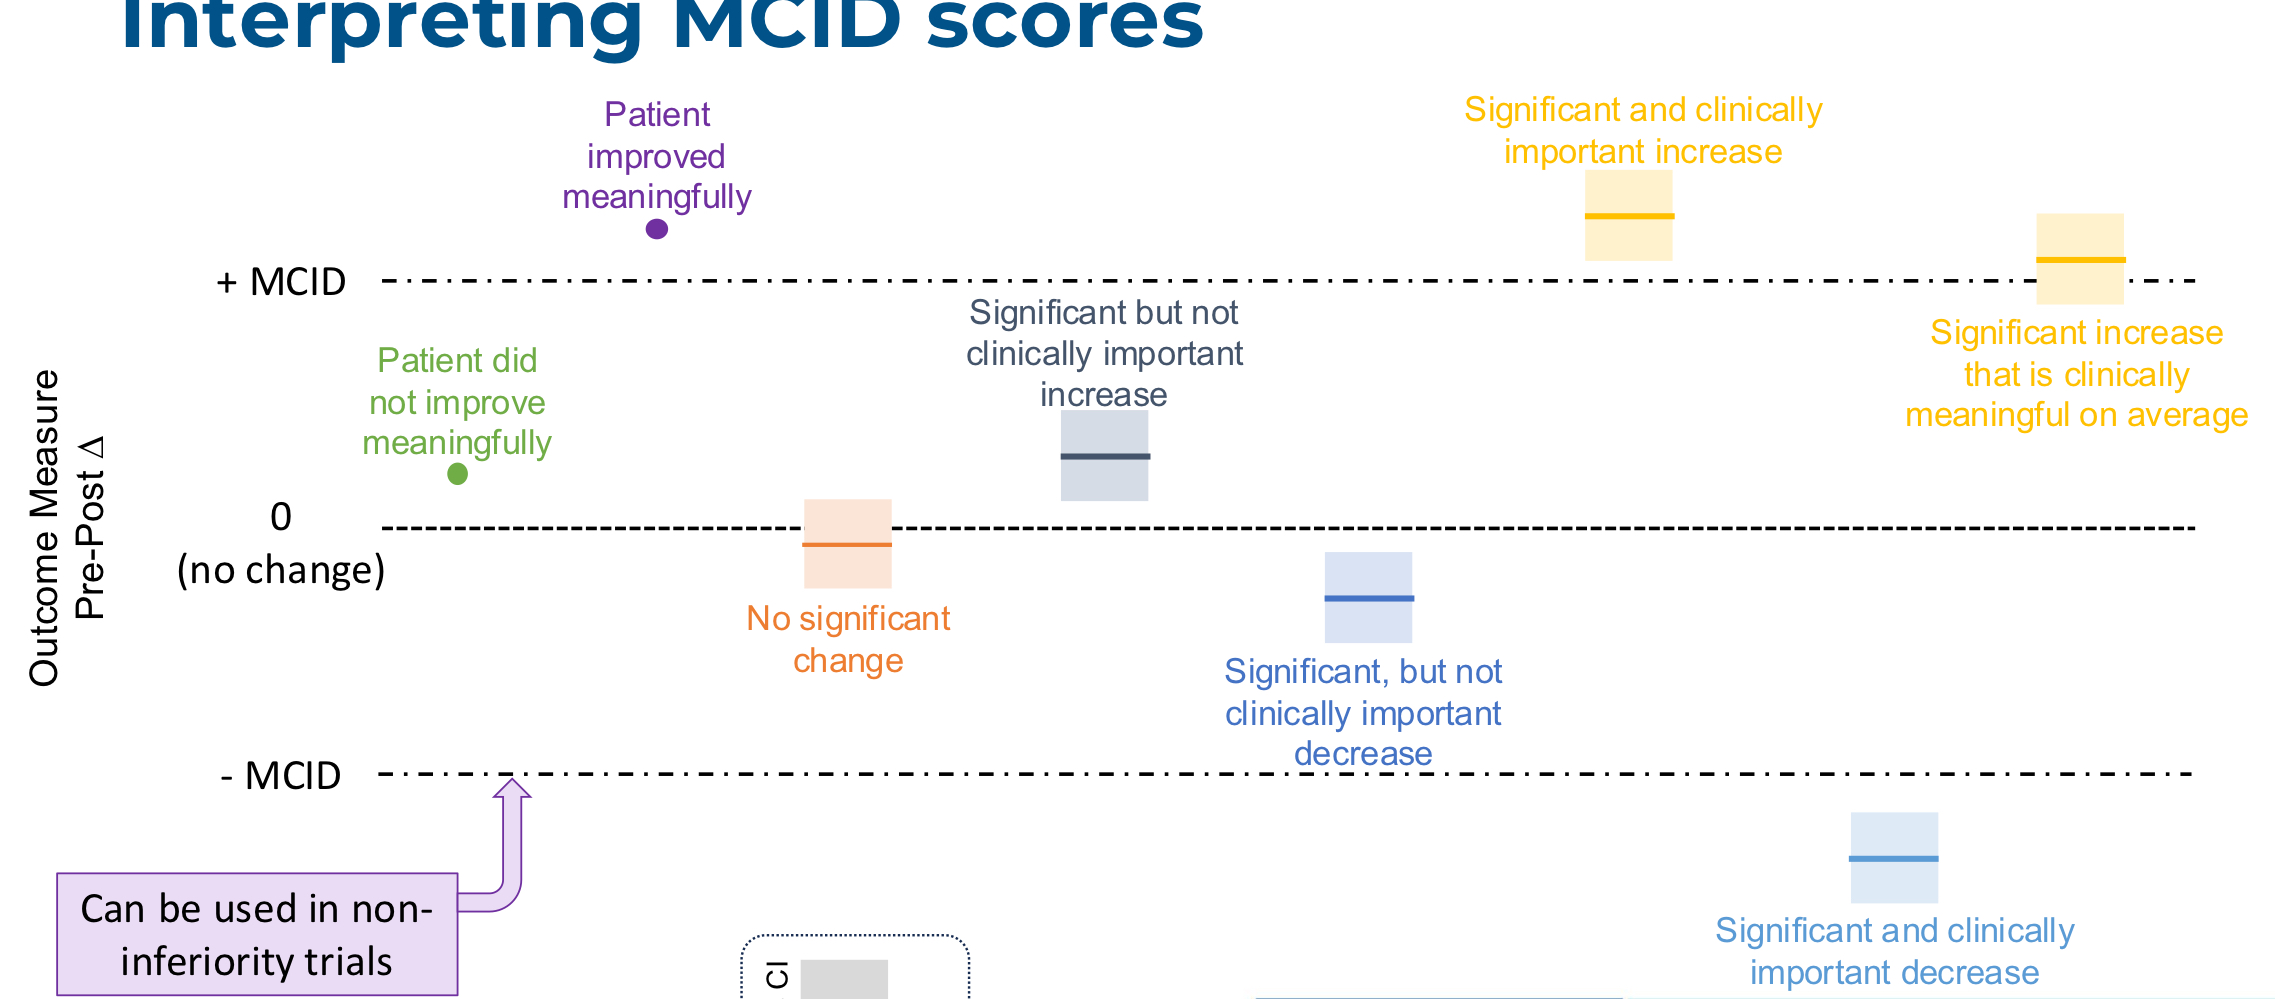
what does it mean for something to be clinically meaningful?
a change in an outcome that might be considered important by a patient or clinician
what is minimal clinically important difference (MCID)?
the smallest amount of change that can be considered important
what are anchor based calculations?
changes in the outcome measure are directly compared to changes in quality of life or other external measures
what are distribution based calculations?
based on statistics, not direct comparisons to what patient or clnicians say is most important
what is minimal detectable change (MDC)?
the smallest amount of change that can be detected by an outcome measure.
this is NOT a direct measures of clinical meaningfulness
what are cut off scores?
limits at which patients are more or less likely to experience a negative outcomes
what is normative data?
outcome measure values for people without the health condition
how do you interpret MCID scores?