Unit 3 - Sampling
 Call Kai
 Learn
Learn Practice Test
 Spaced Repetition
 Match
Match Flashcards
 Knowt Play
 Podcast
1/27

There's no tags or description
Looks like no tags are added yet.
Name | Mastery | Learn | Test | Matching | Spaced | Call with Kai | Chat |
|---|
No analytics yet
Send a link to your students to track their progress
28 Terms
Population
The entire group of people, objects, or items that a researcher wants to study. It includes everyone or everything that fits the criteria of the study, not just a small portion of it.
For example, if a school principal wants to know the average number of hours students at the school spend on homework each week, the population would be all students in the school.
Because it may be difficult to collect information from every student, the principal might survey only a smaller group of students, called a sample, and use the results to make conclusions about the entire population.
Sample
A smaller group that is selected from a larger population and is used to represent that population. Researchers often study a sample because it is usually faster, easier, and less expensive than collecting data from every member of the population.
For example, if a school has 1,000 students and the principal wants to know the average amount of time students spend on homework each week, surveying all 1,000 students would mean studying the population. Instead, the principal might survey 100 students chosen from the school. Those 100 students are the sample, and their responses can be used to estimate the homework habits of all 1,000 students.
Simple comparison:
Population: All 1,000 students in the school.
Sample: The 100 students selected to participate in the survey
Design of a Sample
Refers to the method used to choose the sample from the population. In other words, it is the plan for deciding who or what will be included in the sample.
For example, suppose a school has 1,000 students (the population), and the principal wants to survey 100 students (the sample). The sample design is how those 100 students are selected:
Simple random sample: Randomly choose 100 students so everyone has an equal chance of being selected.
Stratified sample: Select students from each grade level (Grade 9, 10, 11, and 12) to make sure all grades are represented.
Systematic sample: Choose every 10th student from a list of all students.
The sample design is important because a good sample design helps ensure that the sample accurately represents the population, making the study's results more reliable.
Sampling Methods
The techniques or procedures used to select a sample from a population. The goal of sampling is to choose a group that accurately represents the population so researchers can make conclusions about the entire population without studying every member. There are various different types that can be used. This includes different types of:
Probability Sampling: Simple random sampling, systematic sampling, stratified sampling, cluster sampling.
Non-Probability Sampling: Convenience sampling, voluntary response sampling, purposive (judgmental) sampling, snowball sampling.
Sample by Chance
Refers to selecting a sample using a random process so that every member of the population has an equal or known opportunity to be chosen. This helps reduce bias and makes the sample more representative of the population.
For example, if a school has 1,000 students and a researcher needs a sample of 100 students, they might assign a number to each student and use a random number generator to select the 100 participants.
Because selection is based on chance rather than personal choice, the results are generally more reliable and can be used to make inferences about the entire population.
Simple Random Sampling (SRS)
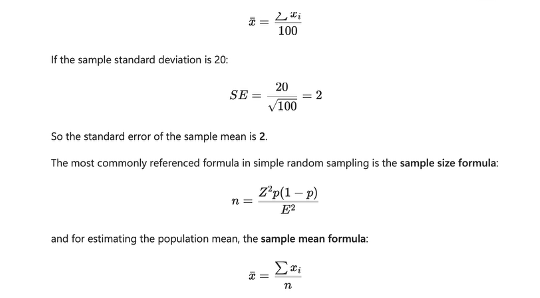
A simple random sample of size n is a group of n individuals selected from a population so that every possible group of n individuals has an equal chance of being chosen. This means the selection process is completely random and fair. As a result, every individual in the population has an equal opportunity to be included in the sample.
For example, if a school has 1,000 students and a researcher wants a simple random sample of n=100 students, the 100 students are chosen randomly so that every possible group of 100 students has the same chance of being selected. This helps produce a representative sample and reduces the risk of bias in the study.
Stratified Random Sampling
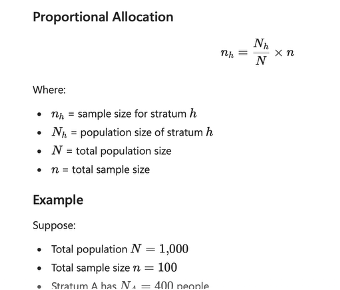
A stratified random sample of size n is created by first dividing the population into smaller groups, called strata, based on a shared characteristic (such as age, grade level, or gender). Then, a random sample is selected from each group so that the total number of individuals chosen equals n. This method helps ensure that all important groups within the population are represented in the sample.
For example, if a school has students in Grades 9, 10, 11, and 12, and a researcher wants a stratified random sample of n=100 students, they might randomly select 25 students from each grade level. This helps the sample better reflect the makeup of the entire school population.
Strata
Groups or categories within a population that share something in common. Strata helps make sure that all important groups are represented.
Simple Example
Imagine a school with 1,000 students:
250 are in Grade 9
250 are in Grade 10
250 are in Grade 11
250 are in Grade 12
The grades are the strata (singular: stratum). Instead of randomly selecting 100 students from the entire school, you might:
Select 25 from Grade 9
25 from Grade 10
25 from Grade 11
25 from Grade 12
This is called stratified sampling because you divide the population into strata first and then sample from each one.
Limitations on the Stratified Random Sampling
The total sample obtained by a stratified random sampling is not an SRS. Not every possible group of n individuals in the population has the same chance of being chosen.
Not even every individual has the same chance of being chosen (unless the sample size in each province is proportional to its population size).
Notation
A set of symbols or letters that statisticians use as a shorthand way to represent numbers, values, or ideas. Instead of writing out "the average of the sample" every time, they use a symbol like x. Notation makes formulas shorter, easier to read, and easier to work with.
For example, n usually means the sample size (the number of people or observations in your sample), N means the population size, xˉmeans the sample mean (average), and p often represents a population proportion.
Think of statistical notation like mathematical abbreviations: once you learn what the symbols mean, you can read and understand statistical formulas much more quickly.
Multistage Sampling
This is used if you need to collect smaller and smaller groups from each population and we can employ different sampling techniques at each stage.
Multistage Sampling Limitations
This type of sample is often used as a cost effective measure. This type of sample is not as good, because all units have the same chance of being included and not every combination of units has a chance of being selected.
We are not required to select a sample from each group (e.g. each province and territory).
Units
The individual things being studied or counted. The objects, people, animals, or items from which the data is collected.
Simple examples:
If you're surveying 100 students, the units are the 100 students.
If you're measuring the heights of 50 trees, the units are the 50 trees.
If you're recording the prices of 200 houses, the units are the 200 houses.
Biased Forms of Sampling
These methods are biased because some people have a much better chance of being chosen than others, and we don't know everyone's chance of being selected.
Voluntary response: People choose for themselves whether to participate. People with strong opinions are more likely to respond than people who don't care much.
Convenience sampling: The researcher chooses people who are easiest to reach. This means that certain people may have never had a chance to be selected.
Unbiased Forms
The chance of being selected is known beforehand, and selection is based on a planned process rather than who volunteers or who is easiest to reach.
Simplified Random Sampling: Every individual in the population has an equal chance of being selected. Names and people are randomly drawn.
Stratified Sampling: Divide the population into groups (called strata) that share a characteristic, then randomly sample from each group. Every group is represented, as divided into groups first and then randomly choose from each group.
Multistage Sampling: Sampling is done in several stages. Random selection occurs at each stage. Randomly choose big groups, then smaller groups, then individuals.
Census: Collection of data from every individual in the entire population. No sampling done, since everyone is included there is no sampling bias.
Limitations on Unbiased Forms of Sampling
Even for unbiased forms of sampling, there can still be other biases introduced. This can include:
Undercoverage: List from where the sample is drawn is incomplete. For example, unlisted phone numbers.
Non-response: People may refuse to answer, or mail in surveys have a lower rate of return.
There are 5000 homes in a certain area of St. Vital. The city of Winnipeg sent out a mailer to 2312 randomly selected homes asking whether or not they would like another school built in the area. Only 412 people responded, what is the non response rate?
Non Response Rate Solution
If the sample size was 2312, our response rate was 412/2312 making our non response rate 1− (412/2312) = 0.822. Therefore approx. 82% of the households sampled did not respond.
Response Bias
People may lie, they may not remember things, or the question maybe poorly worded. This is referred to as a leading question.
Leading questions can take the form of something like “What do you think about Dr. Cindy? Many people are opposed of her opinion by the way.” You are leading someone ins a specific way to benefit your opinion.
Questions to Ask to Guide Conclusions
In order to guide proper conclusions you should insist on knowing:
The exact questions asked
The rate of non response
The data and method of the poll
Systematic Sampling
Probability Sampling
Members are selected at regular intervals from a list.
Example: Choosing every 10th student on a class roster.
Stratified Sampling
Probability Sampling
The population is divided into smaller groups (strata) based on a characteristic, and random samples are taken from each group.
Example: Selecting students from each grade level to ensure all grades are represented.
Cluster Sampling
Probability Sampling
The population is divided into clusters, and entire clusters are randomly selected.
Example: Randomly choosing several classrooms and surveying every student in those classrooms.
Convenience Sampling
Non-Probability Sampling
Participants are selected because they are easy to access.
Example: Surveying students who happen to be in the library.
Voluntary Response Sampling
Non-probability Sampling
Individuals choose for themselves whether to participate.
Example: An online survey that anyone can complete.
Purposive (Judgmental) Sampling
Non-probability Sampling
The researcher selects participants based on specific characteristics or expertise.
Example: Interviewing experienced nurses about healthcare practices.
Snowball Sampling
Non-probability Sampling
Current participants help recruit additional participants.
Example: Studying a rare population by asking participants to recommend others who meet the study criteria.
Non-probability Sampling
In non-probability sampling, some members of the population have a higher chance of being selected than others, and selection is not random.
Types include:
Convenience sampling
Voluntary response sampling
Purposive (Judgmental) Sampling
Snowball Sampling
Probability Sampling
In probability sampling, every member of the population has a known chance of being selected. Different types include:
Simple random sampling
Systematic sampling
Stratified sampling
Cluster sampling