01.2H BIO How Scientists Work - Analyzing Data (PART H)
1/6
There's no tags or description
Looks like no tags are added yet.
Name | Mastery | Learn | Test | Matching | Spaced | Call with Kai |
|---|
No study sessions yet.
7 Terms
Analyze Data (Scientific Method)
Analyze the evidence gathered during an experiment that will help you decide if your hypothesis is supported or not. The fifth step of the scientific method.
Quantitative data
Data that is measured and expressed in numbers that include records or time, temperature, mass, distance, and volume

Qualitative data
Data that is collected using your senses.

Sample size
The number of times data is collected in an experiment.
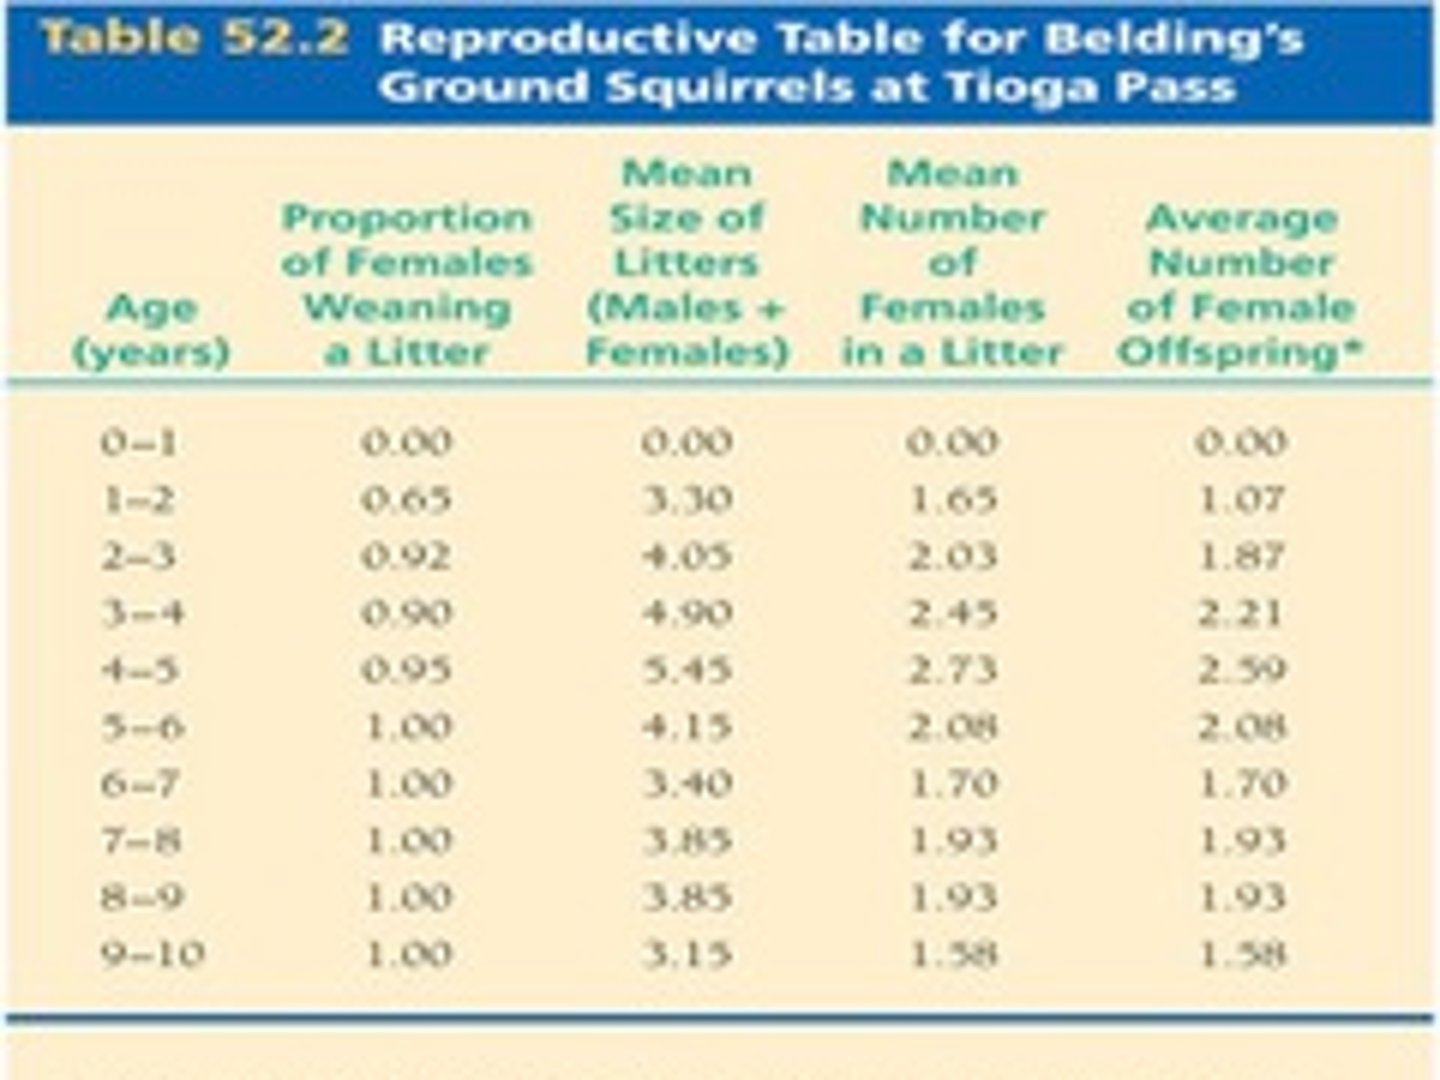
Table
A chart to organize and record measurements that you make

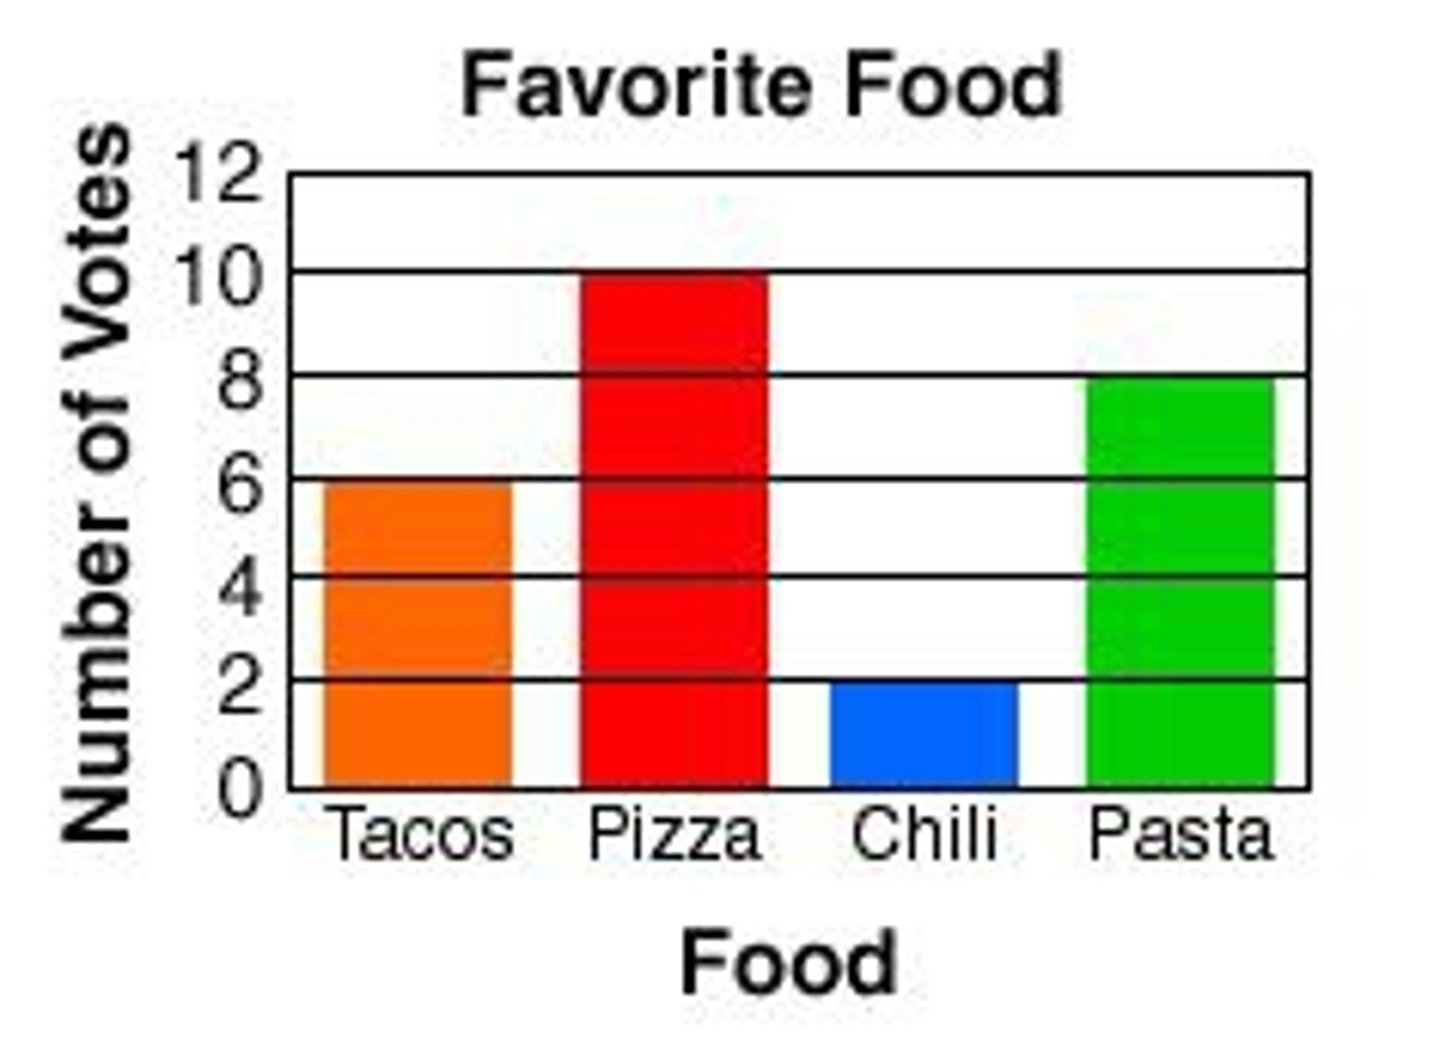
Bar graph
A graph that uses thick bars to compare the frequency of data (how often something occurs) or to show comparisons among data that does NOT continuously change.

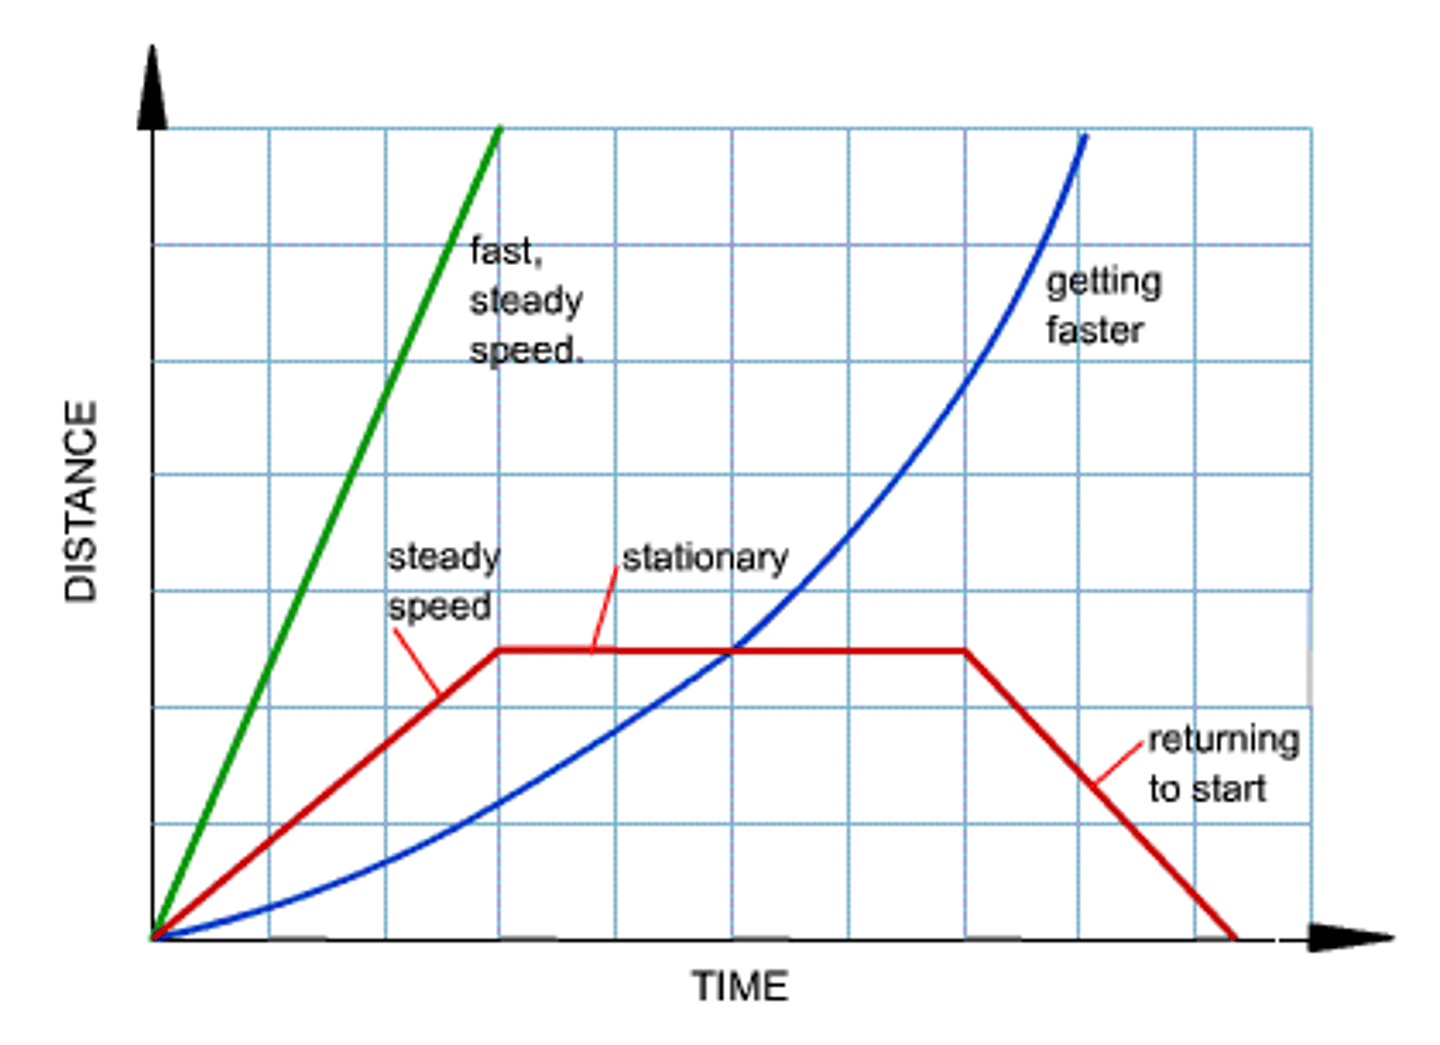
Line graph
A graph that shows relationships between variables that change over time
