Handout 8: Quantitative Data
1/15
Earn XP
Description and Tags
Histograms, stem & leaf plots, mean, median, range IQR, symmetry, scatterplots
Name | Mastery | Learn | Test | Matching | Spaced |
|---|
No study sessions yet.
16 Terms
What is a histogram?
A graphical display for quantitative data
how many bins?
where do bins start?
start at round number
need to label
area of all rectangles sum to 1
Don’t make a histogram for categorical variables! (bar/pie charts instead)
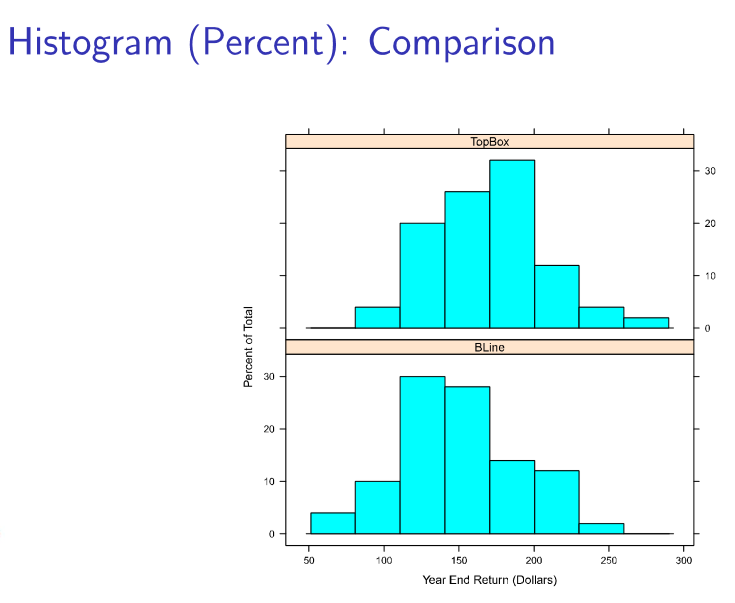
What are the type of scales that can be used for the y-axis for histograms?
Frequency = counts
Percent = counts/total counts
Density (total area = 1)
What are the steps to designing a histogram?
Sort dataset from lowest to highest
Find the range
choose number of bins
find width of bins (1st bin should be a nice number like 10)
Boundaries
Midpoints
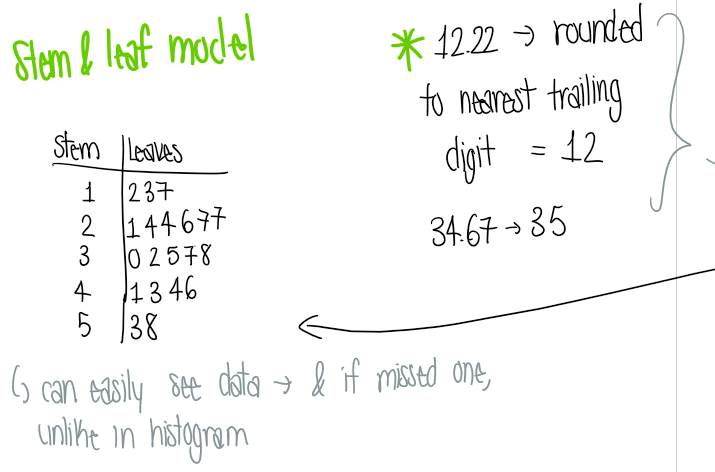
What is a stem & leaf diagram?
A simple way to graphically display quantitative data
1 leaf for every data point → fewer stems
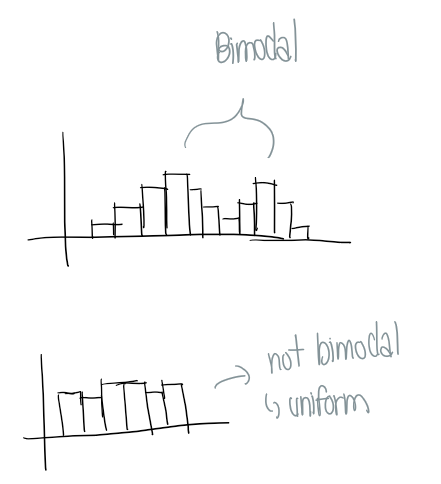
How do you describe the shape of a histogram?
Describe 3 things: Shape, center, spread
Shape: how many humps/modes?
unimodal - 1 peak
bimodal - 2 peak
multimodal - 3+ peaks
uniform - no modes (flat)
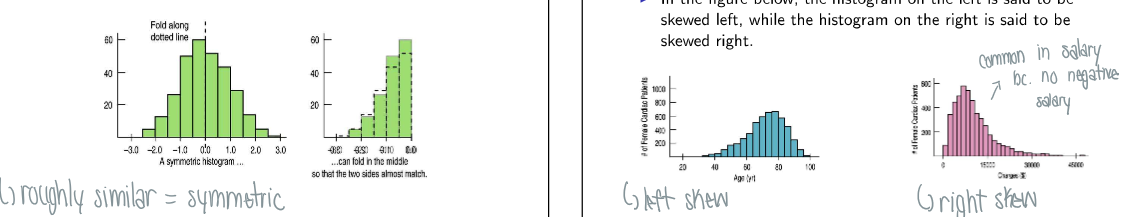
What is symmetry and skew in histograms?
Symmetric: if both sides look roughly similar
Skew: thinner ends of distribution are called tails, if one tail stretches out farther than other it is skewed to the side of the longer tail
Left skew (tail to the left)
Right skew (tail to the right)
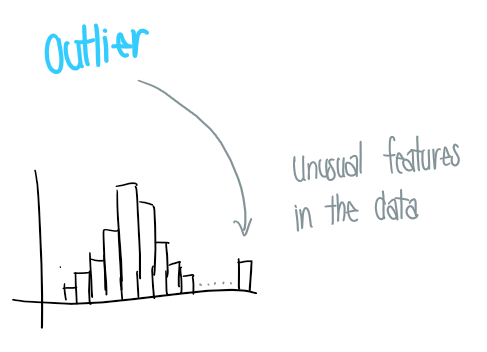
What are odd/unusual features of data/histogram?
Can tell us something interesting about the data
Outliers: stand off away from the body of the distribution
Gaps
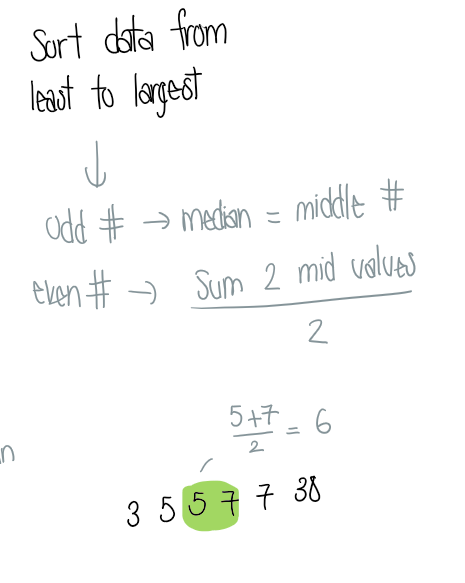
What is the median?
The midpoint of the data
sort data from smallest to largest → median is value in the middle
If the data is even numbered = sum 2 mid values / 2
insensitive to extreme values
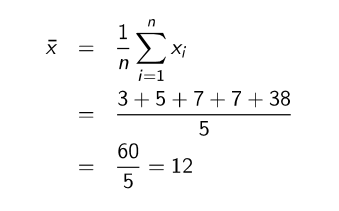
What is the mean?
The average value from adding at the values together & dividing the sum by the number of values
sensitive to extreme values
What are maesures of spread (the range)?
Simplest measure of spread is the range
Range = max - min
sensitive to outliers
What is the inter-quartile range (IQR)?
IQR = Q3 - Q1
Q1 = lower half of the data (25%)
Q3 = upper half of data (75%)
split the data into 2 using the median, find the median of the first half & the median of the second half
insensitive to outliers
What is a scatterplot?
Most common & effective display for data → see patterns, trends, relationships
best way to check if 2 quantitative variables are related
Look for: direction, form, scatter
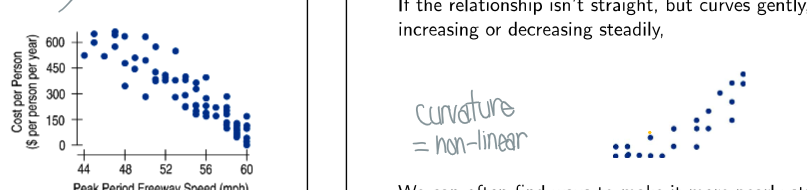
What is a linear & non-linear scatterplot?
Linear: If there is a straight line relationship
Non-linear: if there is curvature
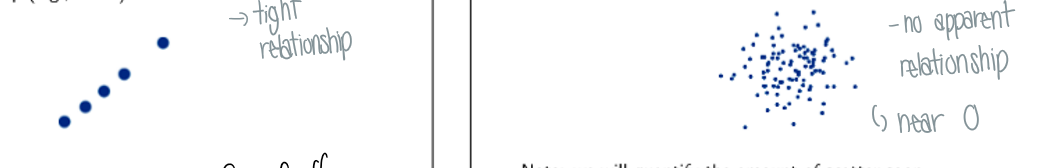
What is a tight relationship vs. no pattern scatterplot?
Tight: points appear to follow single linear relationship
extreme: all data falls on a line (± 1 corr coeff)
No pattern: points appear vague cloud with no trend
corr coeff = 0
What is a negative or positive scatter plot?
Negative: pattern runs in negative linear direction → substitute goods
Positive: trend runs in positive linear direction → complementary goods
What kind of variables go on the x & y axes?
X-axis: the explanatory/predictor variable (independent variable)
Y-axis: the reponse variable (dependent variable)