GEA1000 chap 1 variables, mean, standard deviation, median, interquartile range
1/34
Earn XP
Description and Tags
bruh im just combining the slides because there's sm shit man
Name | Mastery | Learn | Test | Matching | Spaced | Call with Kai |
|---|
No study sessions yet.
35 Terms
what is a variable
a variable is an attribute that can be measured or labelled
define independent and dependent variables
IV: an independent variable is a variable that may be subject to manipulation (either deliberately or spontaneously) in a study
DV: a dependent variable is a variable which is hypothesised to change depending on how the independent variable is manipulated in a study
what are the types of variables that can be used as an IV or DV
categorical variable
numerical variable
what is the uses of categorical variables
take label values
each observation can be placed in only one label + labels are mutually exclusive
what is the uses of numerical variable
take numerical values
and thus arithmetic operations such as adding and averaging make sense
what are the 2 types of categorical variables and their characteristics
ordinal
comes with some natural orderings
numbers are often used to represent the ordering (eg mood)
nominal
no intrinsic ordering for their variables (eg types of animals)
what is one thing to note for ordinal categorical variables
differences between numbers are subjective and (may) not be consistent
thus, labelling categories using numbers DOES NOT transform the nature of the variable to become numerical
calculating averages and performing arithmetic operations is not advisable
what are the 2 types of numerical variables and their characteristis
discrete
possible values of the variable form a set of numbers with ‘gaps’ (eg. no of family members, no of pets in a household)
continuous
can meaningfully take on all possible numerical values in a given range or interval (eg. time)
when should scatter plots be used
to model a relationship between 2 numerical values
when should histograms be used
to show a graph distribution of a single numerical value
when should bar graphs be used
to compare qualities across different categories
when should box plots be used
to compare summary statistics for a numerical variable across different categories
what should be done if the purpose of collecting the data is to get information on particular individuals
go to data set and extract the information for the particular individual(s)
what should be done if the purpose of collecting the data is to get information on groups/population
data visualisation
summary statistics
what is a pro and con of data visualisation
+: bring forth patterns which can be used to desc groups of individuals
-: cannot perform calculations → do summary statistics instead
what are the different summary statistics
measures of central tendency
mean
median
mode
measures of dispersion
standard deviation
interquartile range
what is the properties of the mean
x1 + x2 + … + xn = nx̄
adding a constant value to all the data points changes the mean by that constant value
multiplying all the values to the data points by a constant number c will result in the mean also being multiplied by c
what the mean can/cannot tell us and a misconception of the mean
eg rainfall:
can tell us:
total rainfall for that year
x̄ x12 = total for the entire year
cannot tell us:
how the rainfall is distributed across the year
misconception:
knowing the mean ≠ 50% of the months have a rainfall of at least x̄
what is proportion
proportion is the mean for a numerical variable that only takes 2 groups
what is standard deviation
standard deviation is a way of quantifying the ‘spread’ of the data about the mean
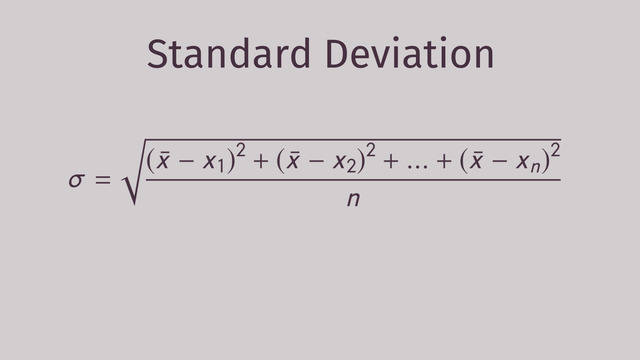
what is the formula of standard deviation
refer to picture
why is taking the difference between each value and the mean, add up the differences to get the ‘total spread’ and then divide by the number of points to get an ‘average spread’
if there are negative values of each positive value provided
the difference between each value to the mean cancels each other out to become 0
what is the explicit computation of standard deviation
find the average value of the data set
subtract the average value from each of the data points and square the answer
add up the values in 2. and divide by n-1
square root the answer to get S.D
properties of standard deviation
always non-negative
adding constant value, c to all the data points does not change the standard deviation
it shifts every point by the same amount
multiplying the data points by a constant value c results in the standard deviation being multiplied by |c| where |c| is the absolute value of c.
what is the coefficient variable
a way of quantifying the degree of spread, relative to the mean
what is the formula for coefficient variation
standard deviation / mean
what is median
the median of a numerical variable in a data-et is the middle value of the variable after arranging the values of the data-set in ascending/descending order
what is the median of an even and odd number of values
even: the average of the middle 2 values
odd: only one middle value after arranging
what are the properties of the median
add a constant value (positive or negative) to all the data points changes the median by a constant value → shift occurs but no change in spread
multiplying all the data points by a constant value c results in the median being multiplied by c → spread widens and shift does occur
what is the relationship between the mean and the median
when the distributions are roughly symmetric → mean and median will be quite close to one another
what is the first quartile
usually denotes as Q1 is the 25th percentile of data values
what is the third quartile
usually denoted by Q3 is the 75th percentile of the data values
what is the interquartile range
it is the difference between the third and the first quartile
IQR = Q3 - Q1
what are some similarities between the IQR and SD
IQR and SD is always non-negative (given that Q3 is at least as large as Q1)
adding a constant value, c to all the data points does not change the IQR and SD
multiplying all the data points by a constant value c results in the IQR and SD being multiplied by |c|
what is the mode
the mode of a variable is the value of the variable that appears most frequently