STA220- Module 7 Normal Distribution/A Continuous Random Variable
1/8
Earn XP
Description and Tags
Name | Mastery | Learn | Test | Matching | Spaced | Call with Kai |
|---|
No analytics yet
Send a link to your students to track their progress
9 Terms
What are density curves?
A smooth curve that may fit on the histogram
is always above the horizontal axis
has area exactly 1 underneath it
describes the pattern of a distribution
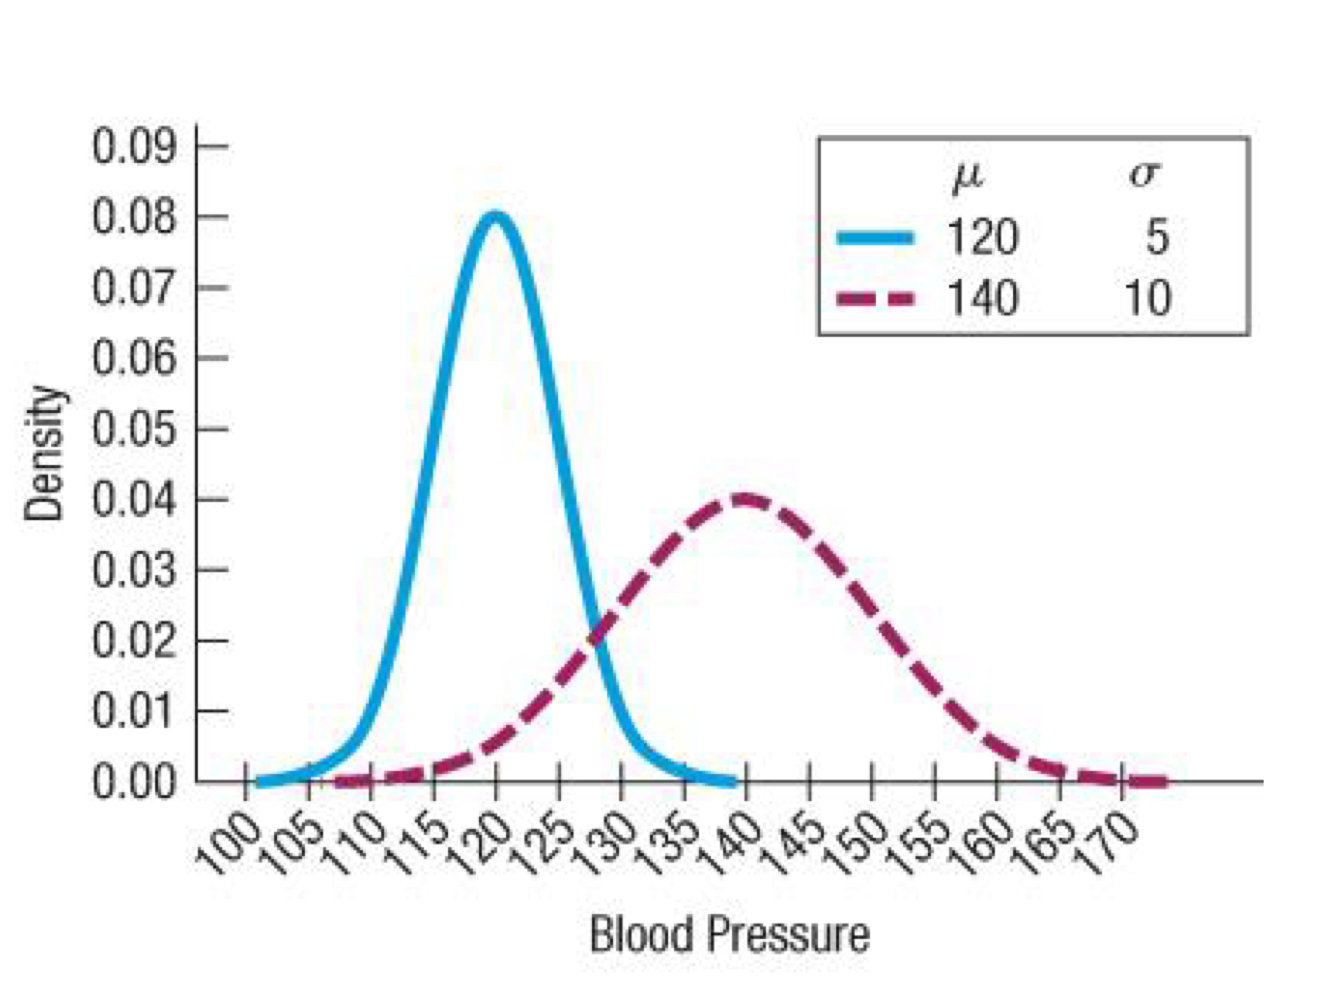
What is a normal model/normal distribution?
Smooth continuous curves that are symmetric unimodal bell-shaped curves; describe normal distribution
have the same overall shape
the mean is located at the centre of the symmetric curve and is the same as the median (and mode)
standard deviation controls the spread of a normal curve
Why are normal distributions an important model of probability distribution?
They approximate well the reall world distributions of variables
They are the most important distribution for statistical inference
What is the standard normal model?
Standardize the data values first using the mean and standard deviation
Then, use the model Z ~ N (0,1)
Normal model with mean zero and standard deviation 1
What are the z-scores in the empirical rule?
Z-score is a measure of position that tells us how many standard deviations and observation (y-value) is away from the mean
expresses in units of standard deviation
Z has mean 0, and standard deviation 1
if data comes from a normal distribution! Z ~ N (mean = 0, SD = 1)
What happens when the number is too high for the z table?
We would need a larger sample if the probability of a success were very low or very high
Binomial model is approximately normal if we expect at least 10 success and 10 failures
np > 10 and n (1-p) > 10
What is a normal probability plot?
Scatterplot of n ordered pairs (x,y)
x axis is expected standard normal observations (in order from smallest to largest)
y axis is z-scores of the observations
plot should look like a straight line with positive slope (should not be s-shaped)
can be a bit wobbly in the tails
if points in the plot lie close to a straight line then the plot indicates that the data appear to have come from a normal distribtion
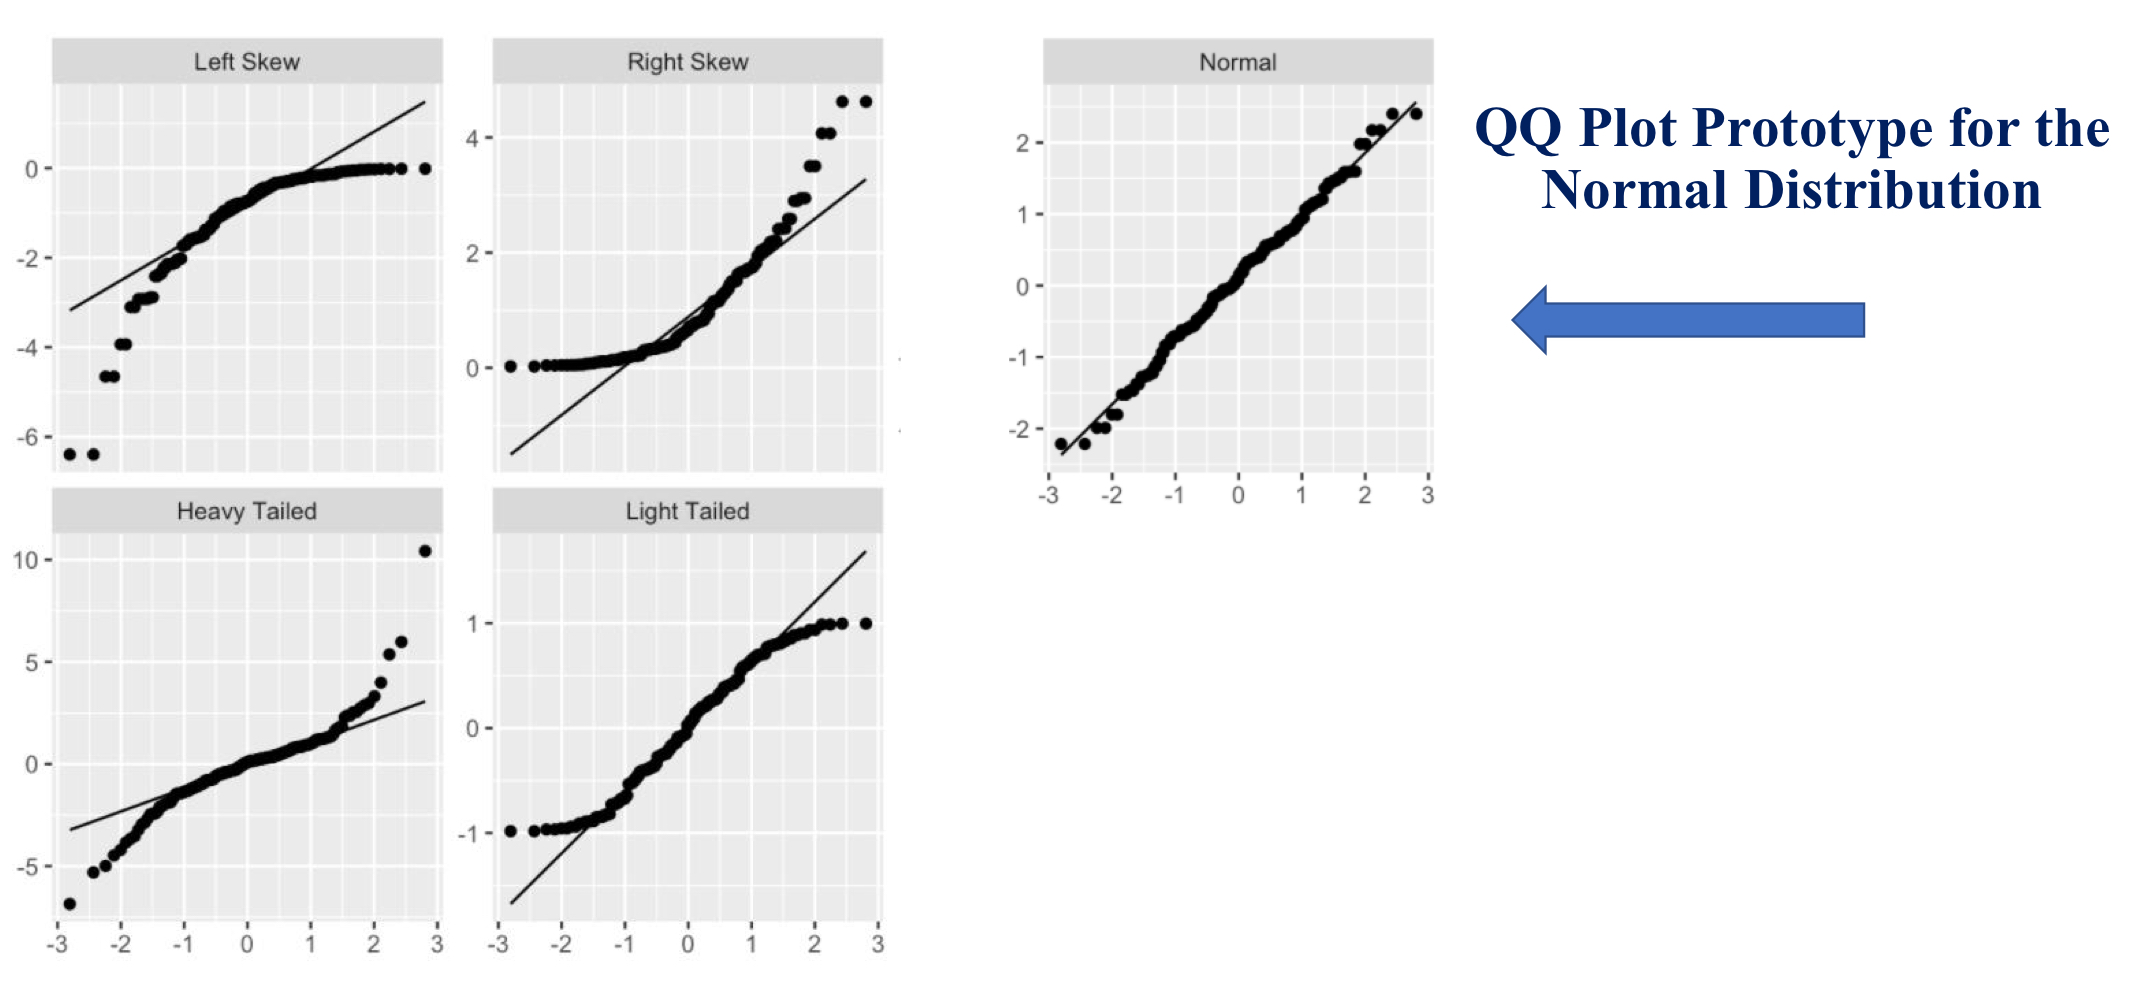
Right skewed distribution
Left skewed distribution
