Normal and Standard Normal Distribution in ECO 391
1/60
There's no tags or description
Looks like no tags are added yet.
Name | Mastery | Learn | Test | Matching | Spaced |
|---|
No study sessions yet.
61 Terms
Discrete Random Variables
Countable variables with distinct values.
Continuous Random Variables
Uncountable variables with infinite values.
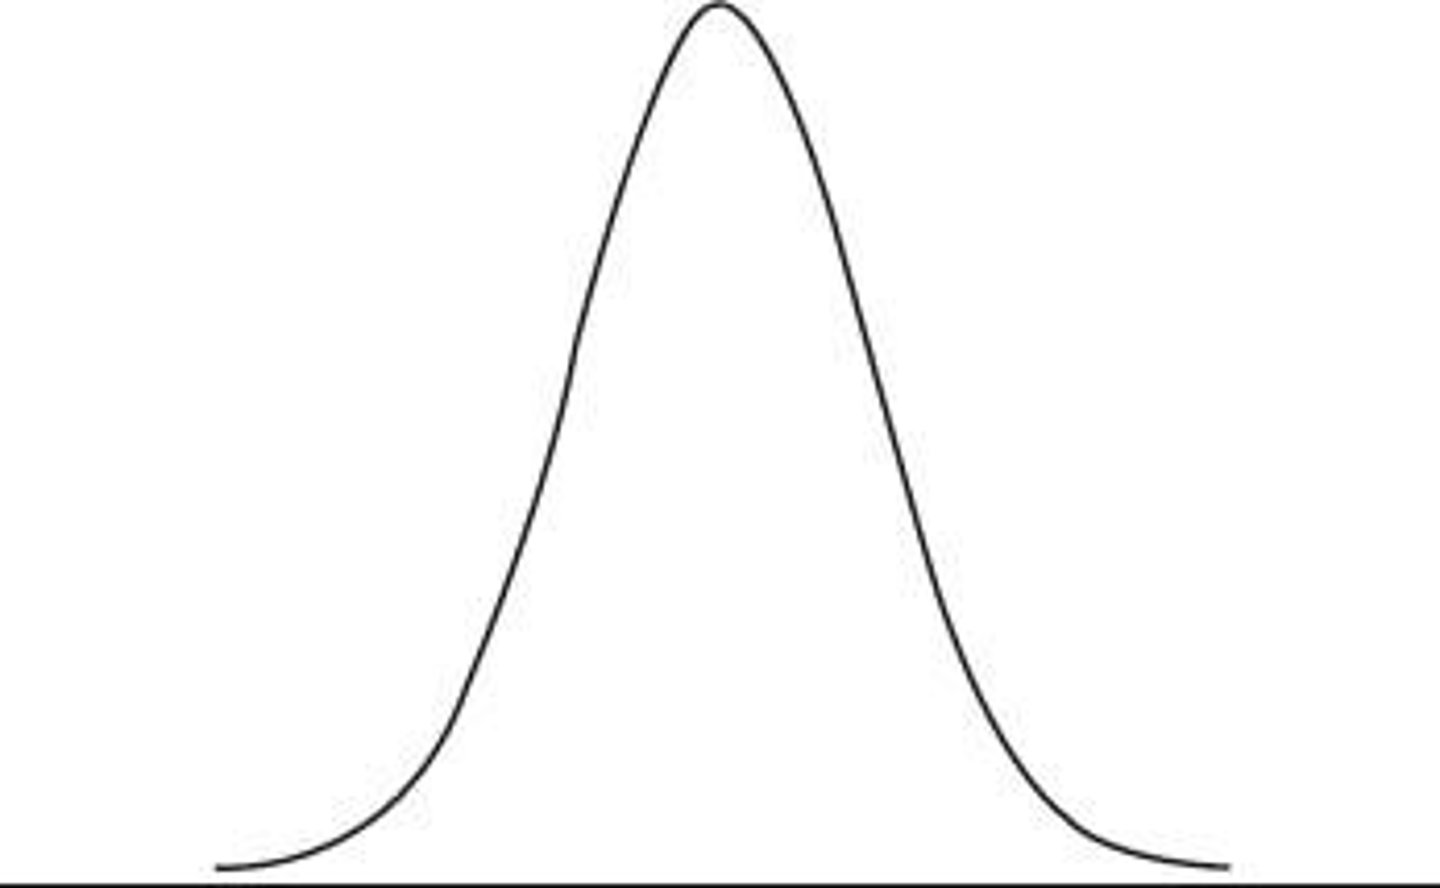
Normal Distribution
Symmetric, bell-shaped distribution with total area 1.

Standard Normal Distribution
Normal distribution with mean μ=0 and σ=1.
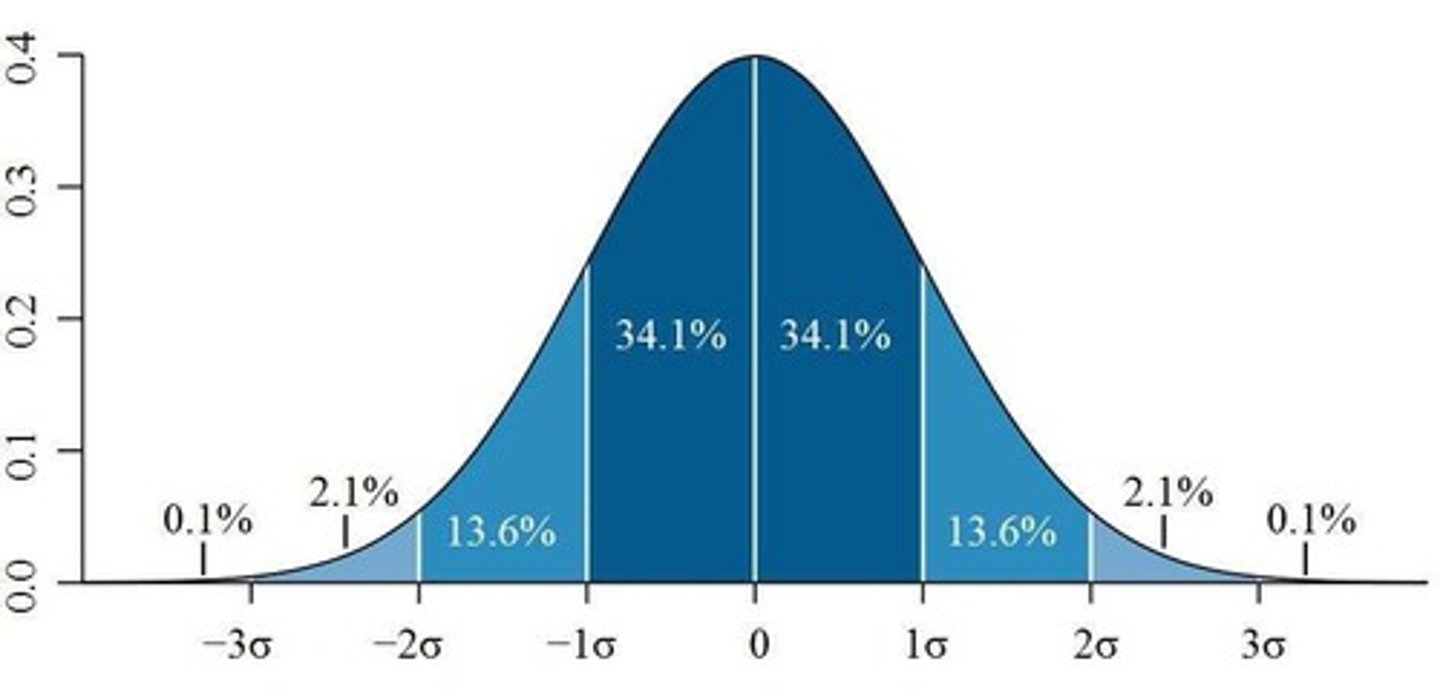
Empirical Rule
68-95-99.7 rule for normal distributions.

Z-score
Standardized score indicating number of standard deviations.
T-score
Standardized score used with sample standard deviation.
Mean
Average value of a data set.
Median
Middle value when data is ordered.
Mode
Most frequently occurring value in data.
Asymptotic
Tails approach axis but never touch.
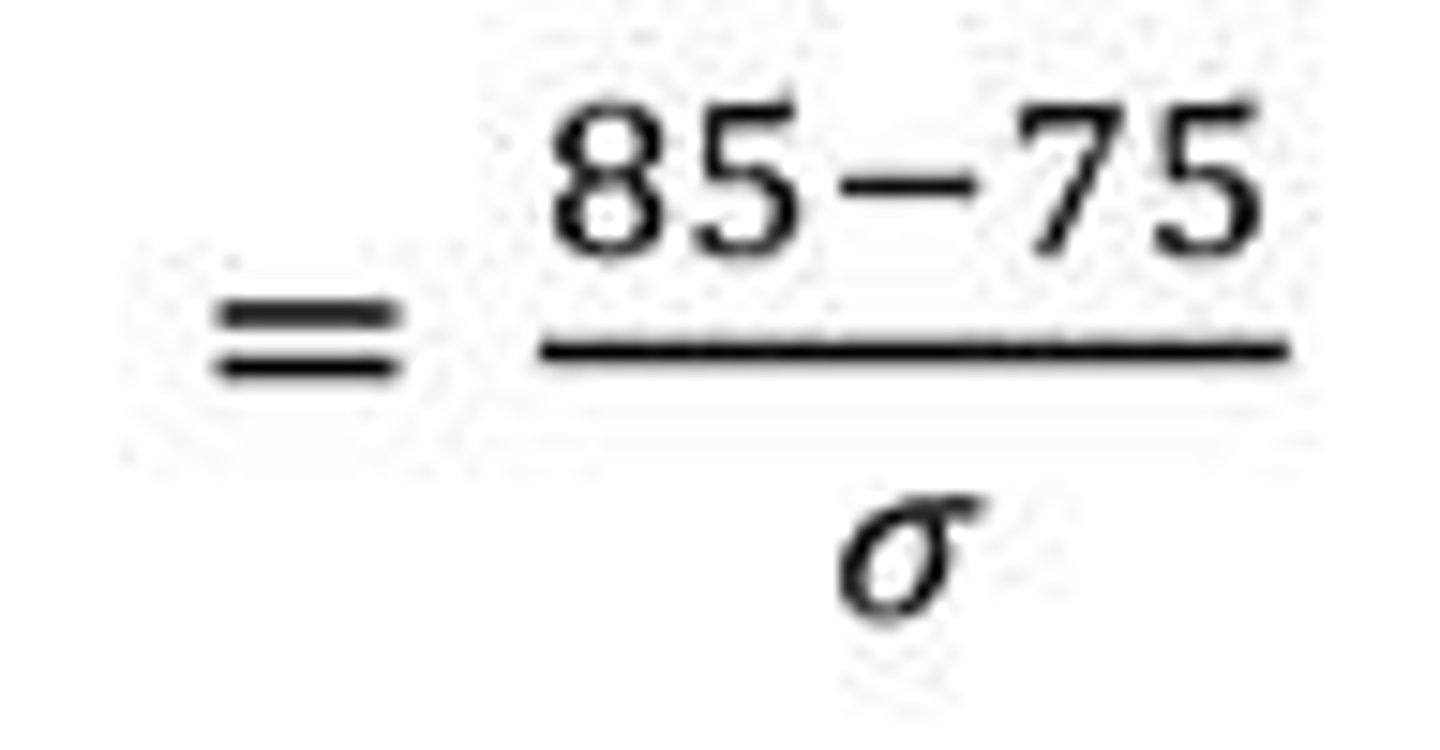
Z-score Formula
Z = (X - μ) / σ.

T-score Formula
t = (X - μ) / (s/√n).
Standard Deviation (σ)
Measure of data dispersion around the mean.
Sample Standard Deviation (s)
Estimate of standard deviation from sample data.
Normal Distribution Curve
Graphical representation of normal distribution.
Bell-shaped Curve
Characteristic shape of normal distribution graph.
Total Area Under Curve
Equals 1 for probability distributions.
Probability
Likelihood of an event occurring.
Random Variable
Variable whose values depend on chance.
X-value
Original value before transformation to Z or T.
Z-value
Value after standard transformation from X.
Probability
Likelihood of an event occurring, expressed as a decimal.
Z-score
Standardized score indicating how many standard deviations from the mean.
Normal Distribution
Symmetrical distribution where most values cluster around the mean.
Mean (μ)
Average value of a set of data points.
Cumulative Probability
Probability that a random variable is less than or equal to a certain value.
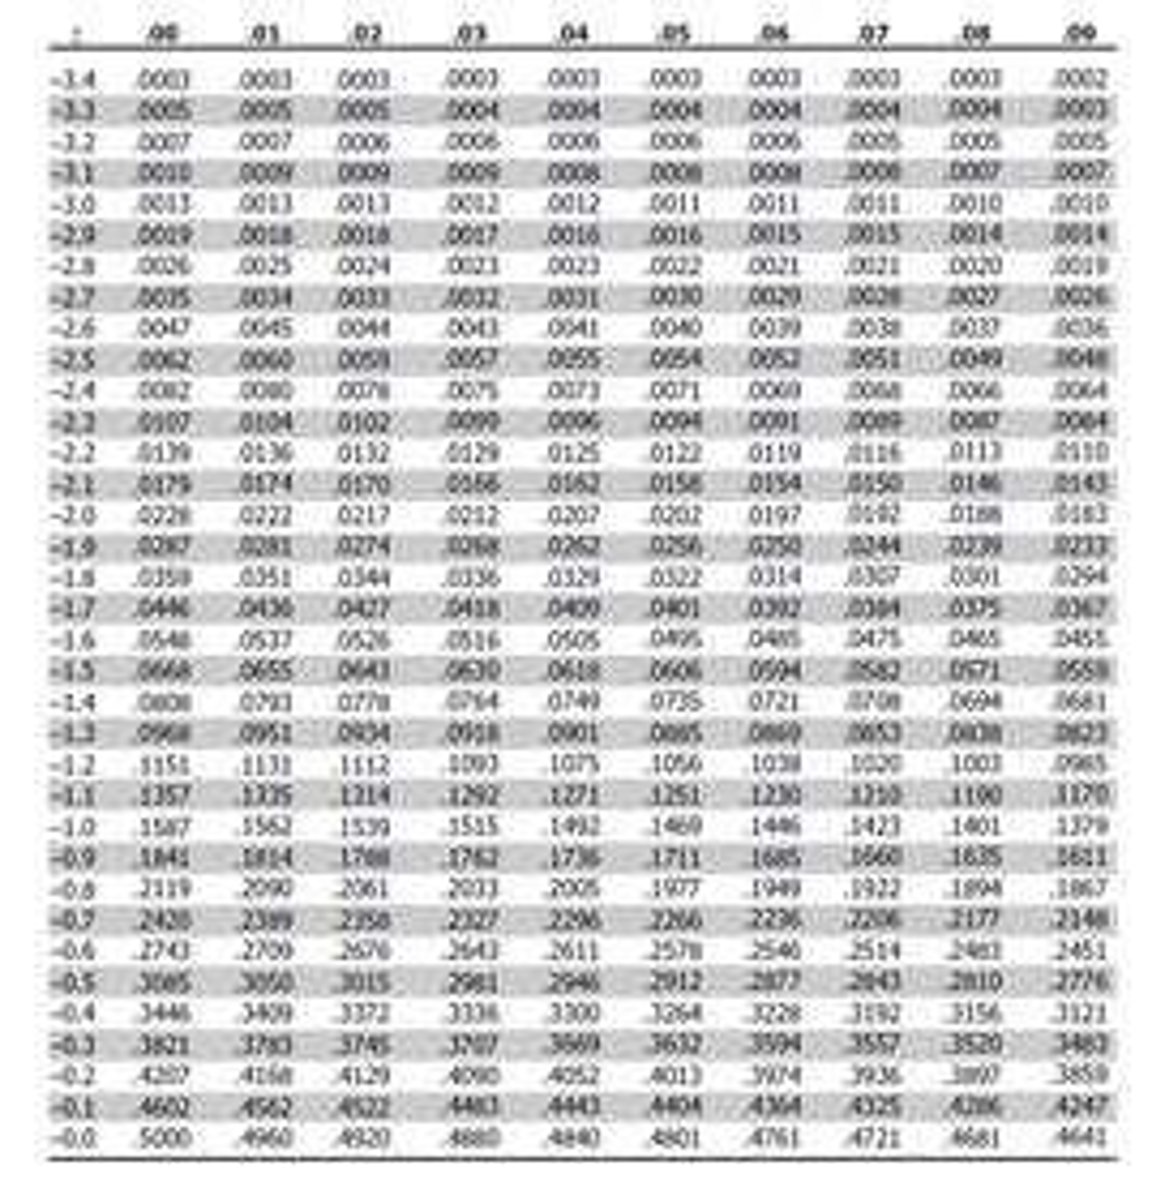
Z-table
Table showing cumulative probabilities for Z-scores.

Right Tail Test
Test assessing the probability of extreme values on the right.
Standard Normal Distribution
Normal distribution with mean 0 and standard deviation 1.
Area under the curve
Represents total probability in a probability distribution.
1σ Range
Approximately 68% of data falls within one standard deviation.
2σ Range
Approximately 95% of data falls within two standard deviations.
3σ Range
Approximately 99.7% of data falls within three standard deviations.
Discrete Random Variables
Variables with countable distinct values.
Continuous Random Variables
Variables with uncountable values within intervals.
Negative Z-score
Indicates a value below the mean.
Right Tail Probability
Probability of observing values greater than a certain score.
Less than 84 kg
Condition representing 1σ below the mean weight.
Between 73 and 117 kg
Condition representing 2σ around the mean weight.
More than 128 kg
Condition representing 3σ above the mean weight.
Z-score
Number of standard deviations from the mean.
Standard Normal Distribution
Normal distribution with mean 0 and SD 1.
Probability P(Z > 1)
Calculated as 1 - P(Z ≤ 1).
Standard Deviation (σ)
Measure of data dispersion from the mean.
P(Z ≤ 1)
Probability Z is less than or equal to 1.
P(Z > 1.6)
Probability Z is greater than 1.6.
Normal Distribution
Symmetrical distribution where mean = median = mode.
Probability of Z < -2
Equivalent to P(Z > 2) due to symmetry.
Average Return
Mean return of an investment portfolio.
Balanced Portfolio
Investment strategy diversifying across asset classes.
Z = (X - μ) / σ
Formula to calculate Z-score.
P(Z ≤ -1.92)
Probability Z is less than -1.92.
68.26%
Percentage of data within 1 standard deviation.
15.87%
Percentage of data below one standard deviation.
2.28%
Percentage of data above two standard deviations.
Average Rent
Mean monthly rent in a city.
Normal Distribution of Rent
Assumes rent values follow a bell curve.
Probability of Rent > $2,000
Calculated using standard deviations from the mean.
Z-score for 48 minutes
Calculated as 1.6 for task completion time.
Standard Deviation of Rent
Measure of rent variability in the city.