Week 9: Data Analysis and Presenting Findings
1/68
There's no tags or description
Looks like no tags are added yet.
Name | Mastery | Learn | Test | Matching | Spaced | Call with Kai |
|---|
No analytics yet
Send a link to your students to track their progress
69 Terms
Data Analysis Purpose
To answer the research question effectively.
Quantitative Data Analysis
Analyzing numerical data to draw conclusions.
Descriptive Statistics
Visual arrangement of data for understanding.
Measure of Central Tendency
Summarizes dataset by identifying typical value.
Levels of Measurement
Determines applicable statistics for data analysis.
Categorical Data
Data reflecting characteristics or categories.
Nominal Data
Categorical data without inherent order or rank.
Ordinal Data
Ranked categories without exact differences.
Numerical Data
Data based on numbers or quantities.
Interval Data
Numerical scales with equal intervals, no zero.
Ratio Data
Numerical data with true zero and equal intervals.
Frequency Distribution
Organizes data by frequency of values.
Histogram
Graphical representation of frequency distribution.
Mean
Average value of a dataset.
Survey
Method for collecting categorical data.
Questionnaire
Tool for gathering data through questions.
Statistical Testing
Analyzing data to validate hypotheses.
Natural Ordering
Meaningful arrangement of categories in data.
Satisfaction Levels
Ordinal data reflecting degrees of satisfaction.
Education Level Survey
Collects data on highest education attained.
Data Visualization
Graphical representation to enhance understanding.
Mean
Average of all data points in a dataset.
Median
Middle value when data is ordered.
Mode
Most frequent value in a dataset.
Unimodal
Dataset with one mode only.
Bimodal
Dataset with two modes present.
Multimodal
Dataset with multiple modes identified.
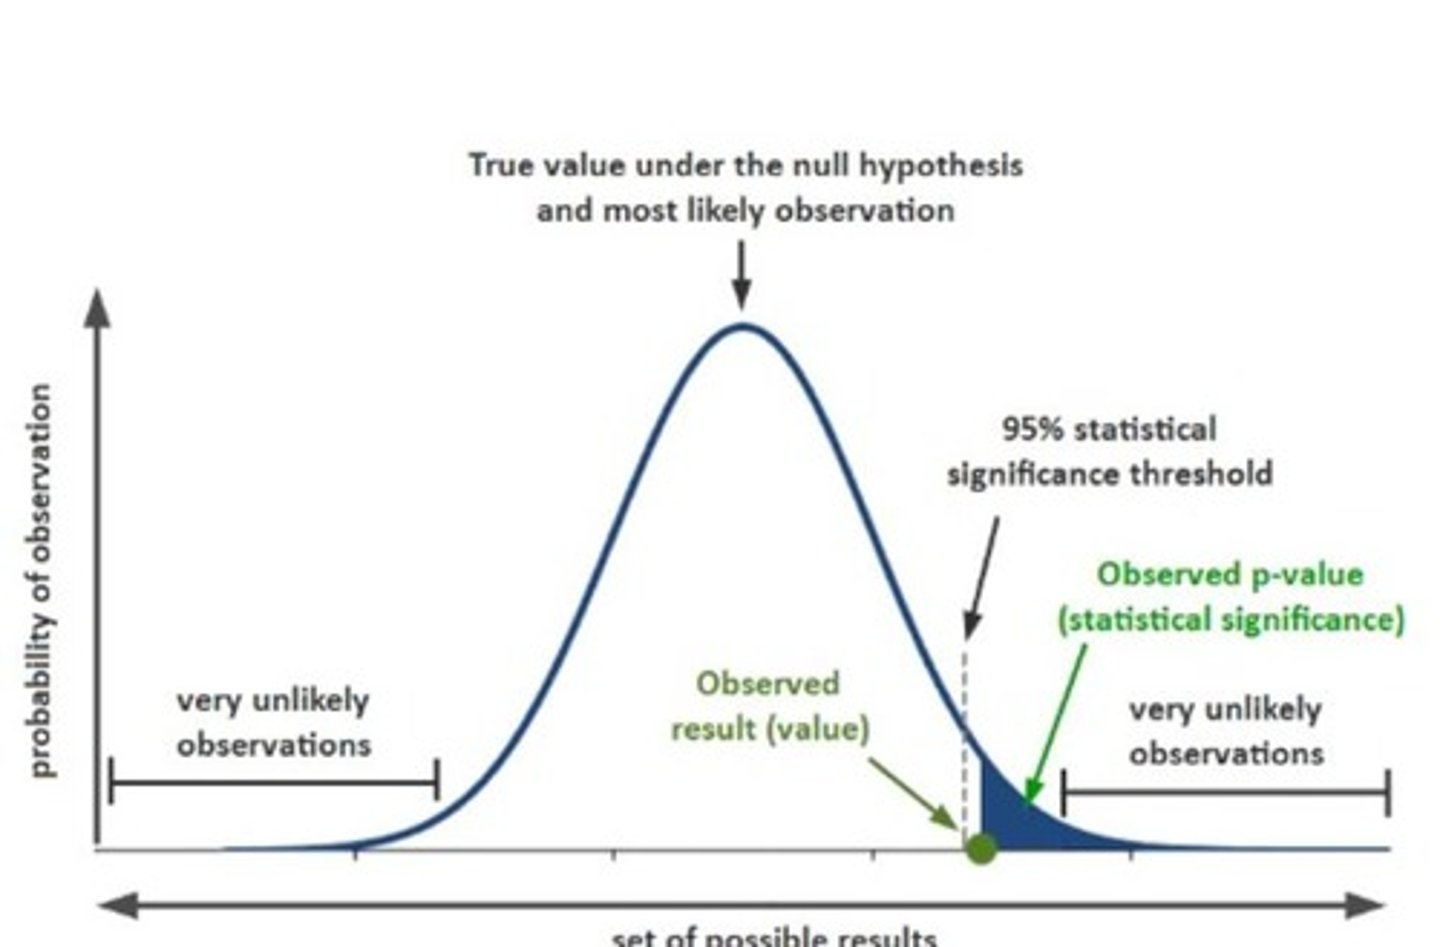
Normal Distribution
Symmetric probability distribution around the mean.
Bell Curve
Graph shape of normal distribution.

Standard Deviation (SD)
Measure of data spread around the mean.
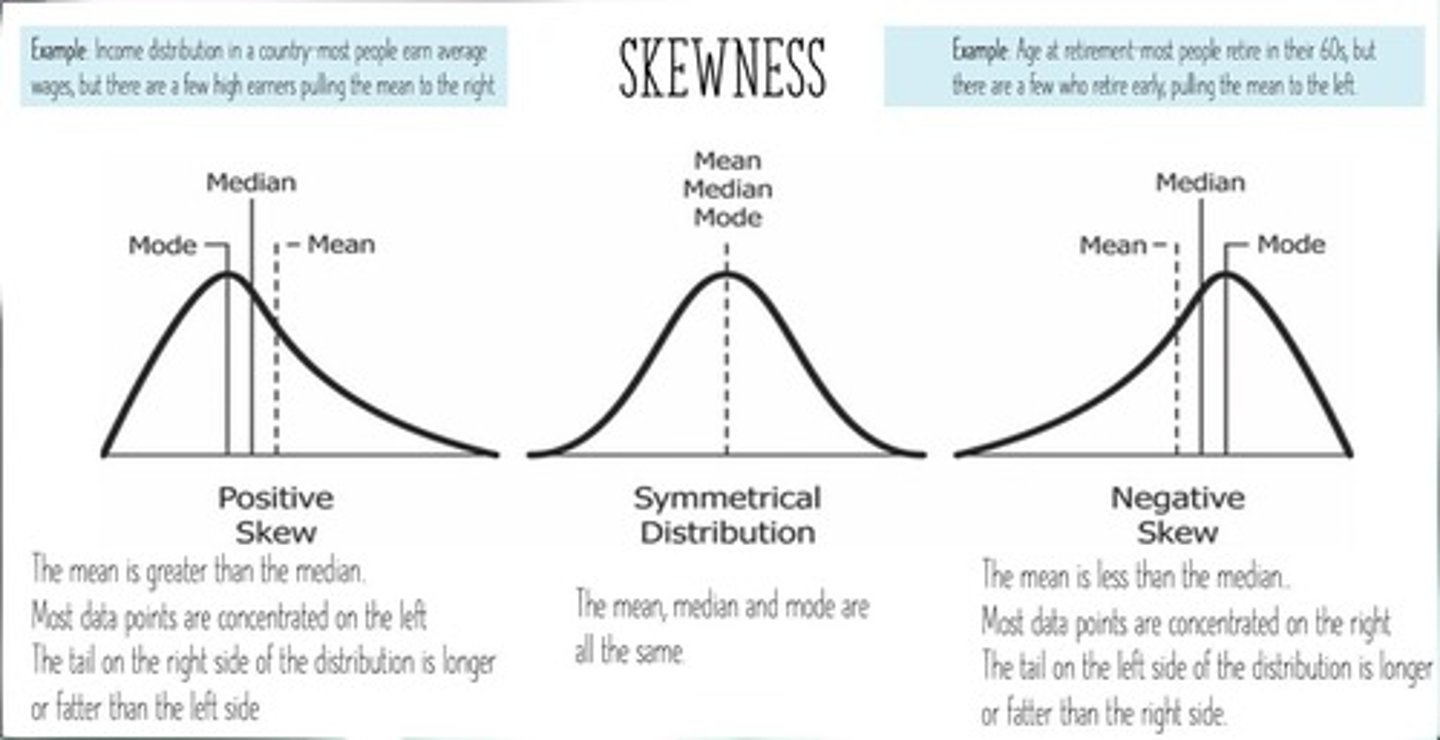
Skewness
Asymmetry of data distribution around the mean.

Positive Skew
Data concentrated on the right side.
Negative Skew
Data concentrated on the left side.
Range
Difference between highest and lowest scores.
Semi-Interquartile Range
Difference between 75th and 25th percentiles.
First Quartile (Q1)
Value below which 25% of data points fall.
Third Quartile (Q3)
Value below which 75% of data points fall.
Variance
Mean squared difference from the average.
Empirical Rule
Percentage of values within standard deviations.
68%
Percentage of values within one SD of mean.
95%
Percentage of values within two SDs of mean.
99.7%
Percentage of values within three SDs of mean.
Inferential Statistics
Using sample statistics to infer about population.
Probability Samples
Data obtained from randomly selected participants.
Power Analysis
Estimates necessary sample size for study.
Sample Statistics
Mean or SD calculated from sample data.
Parametric Statistics
Used for normally distributed numerical data.
Nonparametric Statistics
Used for non-normal distributions and categorical data.
Hypothesis Testing
Objective decisions based on statistical analysis.
Research Hypothesis (H1)
Predicts a relationship between variables.
Null Hypothesis (H0)
States no relationship exists between variables.
Directional Hypothesis
Specifies positive or negative relationship direction.
Non-directional Hypothesis
Indicates relationship existence without direction.
Simple Hypothesis
Predicts relationship between one independent and one dependent variable.
Complex Hypothesis
Predicts relationships involving multiple variables.
Type 1 Error
Rejecting true null hypothesis incorrectly.
Type 2 Error
Accepting false null hypothesis incorrectly.
Alpha Level
Probability of making a Type 1 error.
P-value
Probability result is statistically significant if < alpha.
Confidence Interval (CI)
Estimated range indicating certainty about sample findings.
Qualitative Data Analysis
Understanding and synthesizing studied phenomena.
Data Management
Organizing data for analysis and interpretation.
Data Reduction
Simplifying and organizing data into meaningful clusters.
Thematic Analysis
Identifying and recovering emerging themes from data.
Data Display
Organized information for drawing conclusions.
Phenomenological Analysis
Extracting significant statements from qualitative data.
Ethnographic Analysis
Interpreting cultural patterns and themes from data.
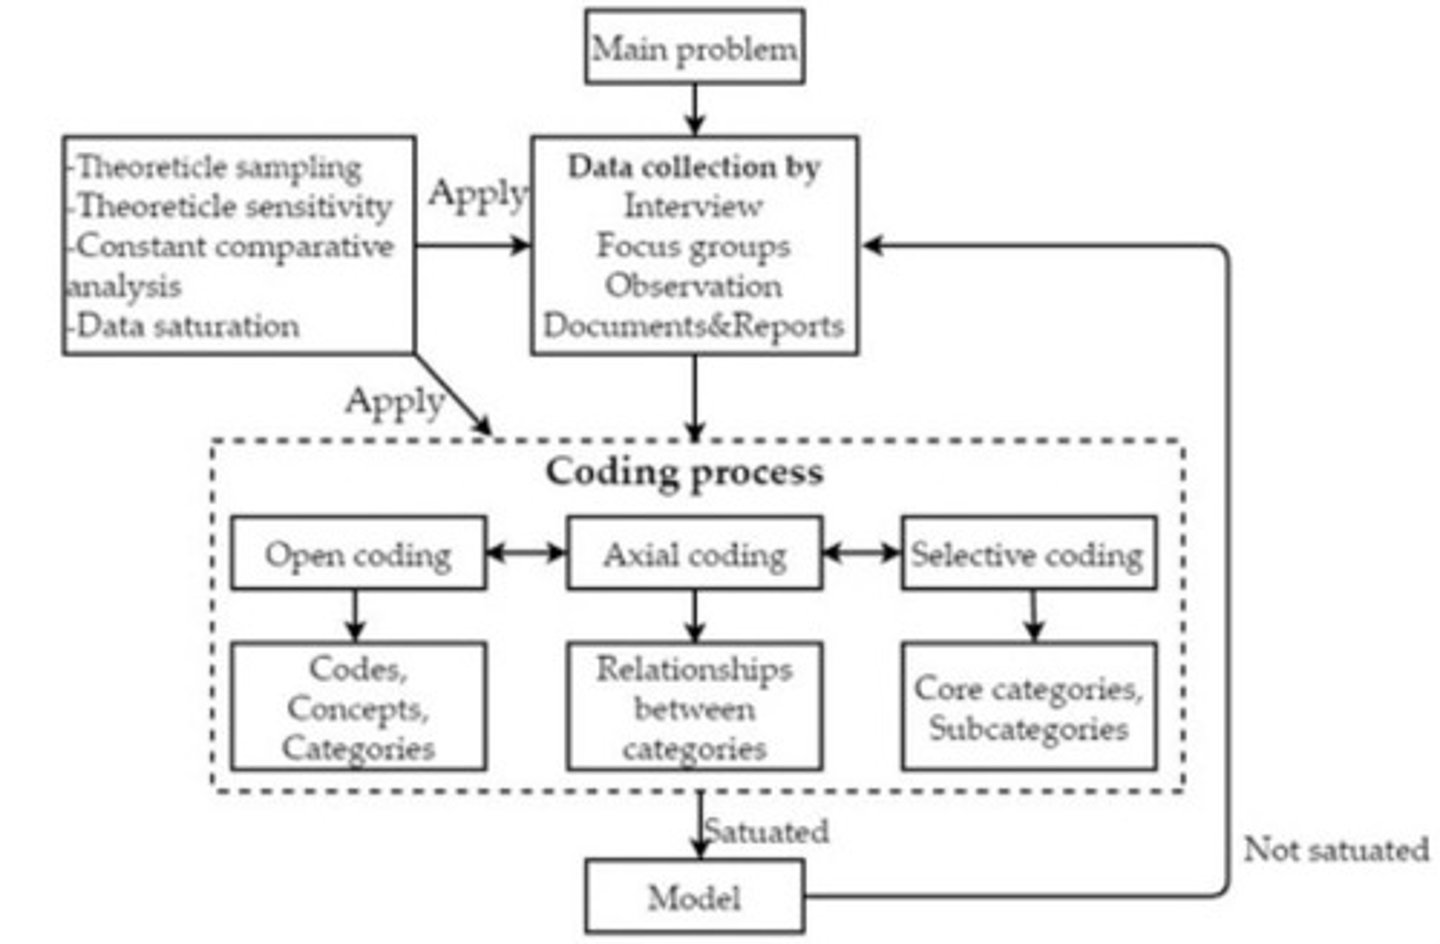
Grounded Theory Analysis
Comparative method for developing categories from data.

Presenting Findings
Sharing research results and interpretations.