Exam 3 Review - Psychology Statistics
1/44
Earn XP
Description and Tags
Vocabulary flashcards for reviewing key concepts in Psychology Statistics.
Name | Mastery | Learn | Test | Matching | Spaced |
|---|
No study sessions yet.
45 Terms
t-Test
Compares the means of two groups on a continuous DV.
IV: categorical with 2 levels
DV: scale/continuous
Example: Is there a difference in performance b/w short answer and MCQ tests?
ANOVA (Analysis of Variance)
Comparing 3 or more groups (or factorial designs with 2+ IVs).
IV(s): categorical
DV: continuous
Example: does type of lighting (natural, fluroescent, dim) affect productivity?
Correlation
Examining the relationship between 2 continuous variables.
NO IV or DV - just seeing if two variables relate
Pearson’s r
Summary statement: There was a [weak/moderate/strong], [positive/negative] correlation between X and Y, r = [r], p = [p]. This relationship was [statistically significant / not significant]. - Include CI and other descriptives as fit
Example: Is there a relationship between study hours and exam scores?
Chi Square
Both variables are categorical, and you're testing for associations or independence.
χ²
Example: Does exposure to a persuasive message (message A vs B) influence whether participants support a policy (Yes/No)?
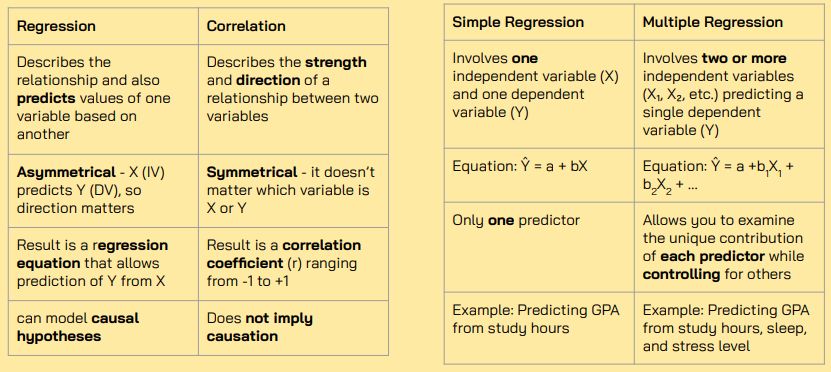
Simple Regression
Predicting a continuous outcome (DV) from 1 continuous predictor (IV).
Regression coefficient (β) and R²
Example: does the number of hours of cognitive training predict memory test performance?
Ŷ = a + bX
Multiple Regression
Predicting a continuous DV from 2 or more predictor variables
Regression coefficient (β) and R²
Ex: do hours of sleep and caffeine intake together predict reaction time on a driving simulator?
Bayesian Tests
You want to compare models or estimate evidence for a hypothesis using Bayes factors rather than p-values. : what is the relative likelihood of my data given my research hypothesis vs the given null
Bayes Factor (BF₁₀)
Example: Is there evidence that participants in a music listening group have higher focus scores than those in a silence group?
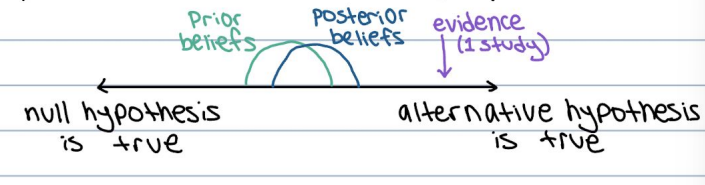
BAYESIAN INFERENCES
1) Prior knowledge - can set a prior belief, adjust study based on previous research (avoid type 1 errors)
2) Evidence - data fits the null vs. data fits the alternative
3) Posterior beliefs - strong collection of findings
p value
The probability of obtaining results as extreme as or more extreme than what was actually observed;
it helps us decide whether the observed effect is statistically significant.
Sampling distributions
The distribution of a statistic over many samples drawn from the same population.
Statistical tests
Procedures used to assess whether the observed data differs significantly from what we would expect under the null hypothesis.
Null Hypothesis Significance Testing
A framework for deciding if a result is statistically significant; involves comparing the p-value to alpha (α).
Statistical Significance
A result is statistically significant if the p-value is below a pre-set threshold;
the observed effect in your data is unlikely to have occurred under the null.
Factorial ANOVA - F-statistic
F-statistic = MSIV / MS Error ; tells us how much means of groups differ (MSIV) relative to variability within groups (MS Error)
Mean Square - measure of variance and calculated by dividing Sum of Squares by df
MSIV - variation b/w group means (variablity explained by IV)
MS Error - variability within groups not explained by IV
One-Way ANOVA (One-Factor ANOVA)
Compares the means of three or more groups based on one independent variable (IV).
Ex: Comparing exam scores between three different teaching methods
Two-Way ANOVA (Two-Factor ANOVA)
Compares the means based on two independent variables (IVs) and examines their interaction.
Example: Examining the impact of both teaching method and study time on exam scores
Repeated Measures ANOVA
Compares means within the same group of subjects measured at different points in time or under different conditions.
Example: Measuring anxiety levels before, during, and after an intervention in the same group
Between-Groups ANOVA
Compares the means independent groups to determine if there is a statistically significant difference between them.
- Example: You have three groups of students who used different study methods, and you want to compare their exam scores
Main Effect
The effect of one IV on the DV.
Interaction
When the effect of one IV on the DV changes across levels of the other IV.
Simple Effect
The effect of one IV on the DV, at a specific level of the other IV (how we go about describing an interaction).
Marginal Means
Calculating averages across levels of IVs; to calculate main effects.
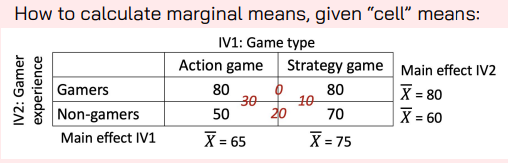
Cell Means
The means for all conditions of the experiment (both IVs combined).
Pearson correlation coefficient (r)
r = +1: perfect positive correlation (as one goes up, the other goes up)
r = -1: perfect negative correlation (as one goes up, the other goes down)
r = 0: no correlation (the null)
Cannot use if: more than two variables, [dramatic] outliers, non linear
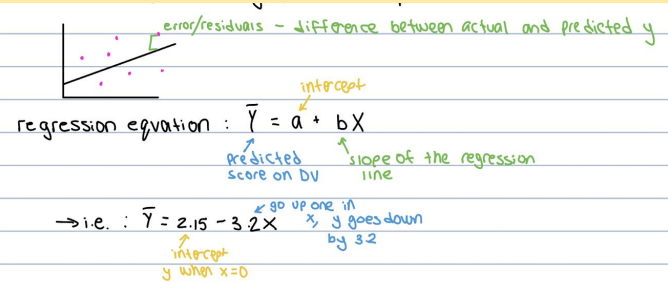
Ŷ = a + bX - Intercept (a)
The value of Y when X = 0.

Ŷ = a + bX - Raw/unstandardized regression coefficient (b)
Slope of regression line (change in Y for 1 unit change in X).
Standardized regression coefficient (beta, β)
Equal to r.
R2
Squaring the correlation gives us R^2; the proportion of the variance in the dependent variable (Y) that is explained by the independent variable (X).
b (in multiple regression)
The slope for each predictor variable, original units, useful for raw interpretation of slope, writing the regression equation.

Standardized β regression coefficient
Slope for regression after controlling for other variables, on a standardized scale, allows for comparison across predictors.
R2 (in multiple regression)
Coefficient of determination - effect size of the whole regression (with all predictor variables in it) / proportion of variance in the outcome variable explained by all predictors combined.
R 2 value tells us we are explaining ___% of the variance in___ with all predictor variables combined
Parametric tests
Tests that have assumptions that need to be true in order to conduct the test.
Everything we’ve done so far (t test, ANOVA, regression, correlation)
Non-parametric tests
when assumptions are violated:
DV is nominal
- Either the IV or DV is ordinal
- Small sample size
- Skewed population distribution of the DV
Welch: parametric t test but doesn’t have the equal variances assumption
Mann-Whitney: non-parametric version of a t test, doesn’t assume DV is normally distributed and scale -
Assumptions: 1) Equality of variances 2) Normality
Chi Square Test
A non-parametric test that tells you if there's a relationship between two categorical variables.
Use when:
- Your IV and DV are categorical (e.g., yes/no, type of group, male/female)
- You're working with frequencies (counts), not averages
Null hypothesis for Chi Square test
The pattern of responses in one variable doesn’t depend on the other variable; there is no association between the two categorical variables.
χ² statistic
How far observed counts deviate from expected counts under the null (in Chi Square). Higher values = more difference between groups.
(1) Look at the difference between what you expected and what you got
(2) Square that difference (to make it positive, even if you get a negative number)
(3) Add up all those squared differences
Bayes Factor (BF)
Tells you how much more likely the data are under one hypothesis than another; using conditional probabilities.
Bayes Factor (BF₁₀)
How much more likely the data are under H₁ (alternative) vs. H₀ (null).
Summary Statement
Start with the two main effects. For each, write whether IV had an effect on DV, including marginal means.
Include F ratio and say whether p is less or greater than alpha
Move to the interaction. Describe how the effect of the IV depends on the levels of the other IV.
Include the correct numbers, F ratio and the p value
Expected values under the Null
t-Test: 0
- ANOVA (F-test): 1
- Correlation (Pearson's r): 0
- Regression (slope, b): 0
- Chi-Square: Expected frequencies
How to make predictions using the regression equation
plug in a specific value of X (the predictor) into the equation
Let’s say your regression equation is: ■ Ŷ = 2 + 3X
■ If X = 4
■ Ŷ=2+3(4)
■ So, the predicted value of Ŷ is 14 when X is 4
How regression is different from correlation, simple vs. multiple regression
How to interpret beta in multiple regression
tells you the relationship between each predictor and the outcome, controlling for all other variables in the model
○ Beta is the same slope, but it's been adjusted so that all variables are on the same scale
○ allows us to compare the importance of different predictors, even if they're measured in different units
How to find the significant/strongest/weakest predictors (which values to look at, how to interpret):
Standardized β values: Larger absolute values (positive or negative) = stronger effect
○ p-values for each predictor: p < .05 = statistically significant
When to use multiple regression (the two scenarios)
Examines the influence of multiple predators on outcome variable
○ Examines the influence of a predator on an outcome while controlling for other variables
Difference between frequentist and Bayesian stats in interpretation and writeups
Frequentist stats test how likely the data are if the null is true (via p-values), while Bayesian stats estimate how likely a hypothesis is given the data (via Bayes Factors)