HES 105 After MT2
0.0(0)
0.0(0)
Card Sorting
1/155
Earn XP
Description and Tags
Study Analytics
Name | Mastery | Learn | Test | Matching | Spaced |
|---|
No study sessions yet.
156 Terms
1
New cards
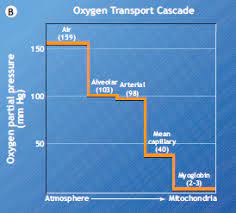
Oxygen transport cascade
• Represents O2 delivery from Atmosphere to Mitochondria Diffusive O2 transfer
• Across Lung, Across Tissue Convective O2 transfer
• Pulmonary Circulation
• Systemic Circulation
• Across Lung, Across Tissue Convective O2 transfer
• Pulmonary Circulation
• Systemic Circulation
2
New cards
oxygen transport system
the components of the cardiovascular and respiratory systems involved in transporting oxygen
1\. Diffusive O2 transfer from air to lungs to pulmonary capillary
2\. Convective O2 transfer from pulmonary capillaries to body
3\. Convective O2 transfer from blood to muscles
4\. Diffusive O2 transfer muscles to mitochondria
1\. Diffusive O2 transfer from air to lungs to pulmonary capillary
2\. Convective O2 transfer from pulmonary capillaries to body
3\. Convective O2 transfer from blood to muscles
4\. Diffusive O2 transfer muscles to mitochondria
3
New cards
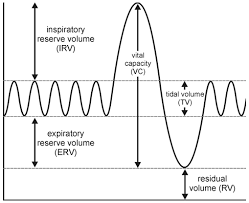
Tidal Volume (TV)
amount of air inhaled or exhaled with each breath under resting conditions (500ml)
4
New cards
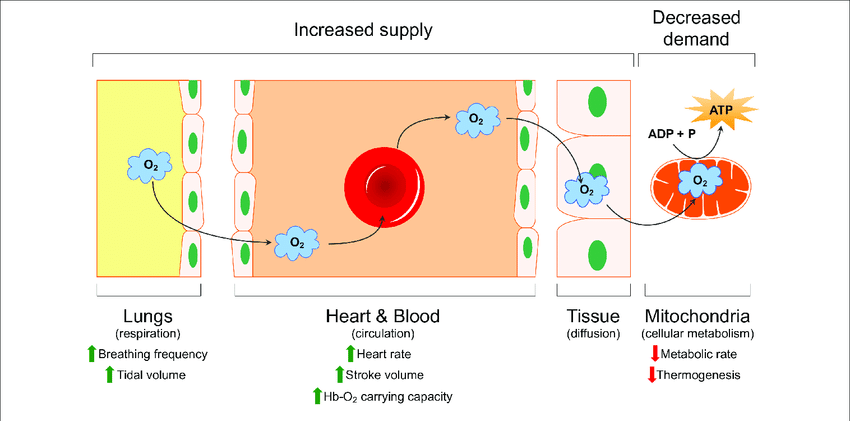
Purpose of ventilation
• Supply O2 to working muscles (and other cells) to be used for ATP resynthesis
• Remove CO2 - produced from metabolism- from maintenance of pH and buffering system
• Remove CO2 - produced from metabolism- from maintenance of pH and buffering system
5
New cards
calculate pulmonary ventilation
VE = 1 (breaths/minute) \* V- (Liters/breath) = L/min
VE = 15 br/min \* 0.600 L/br = 9.0 L/min
• Rest: 3 to 15 L/min
• Max exercise can exceed 200 L/min
VE = 15 br/min \* 0.600 L/br = 9.0 L/min
• Rest: 3 to 15 L/min
• Max exercise can exceed 200 L/min
6
New cards
alveolar ventilation
The volume of air that reaches the alveoli. It is determined by subtracting the amount of dead space air from the tidal volume.
• VE = 15 br/min \* 0.600 L/br = 9.0 L/min
• VA = 15 br/min \* (0.600 L/br - 0.150 L/br) = 6.75 L/min
• VE = 15 br/min \* 0.600 L/br = 9.0 L/min
• VA = 15 br/min \* (0.600 L/br - 0.150 L/br) = 6.75 L/min
7
New cards
lung capacity
the amount of air that can be taken into the lungs with one breath
No correlation between lung capacity and athletic performance
No very trainable (unless disease)
No correlation between lung capacity and athletic performance
No very trainable (unless disease)
8
New cards
Is ventilation a limiting factor to exercise?
No
9
New cards
What % of inspired air is oxygen?
21%
10
New cards
What % of expired air is oxygen at rest?
18%
11
New cards
pulmonary ventilation
Pulmonary Ventilation refers to the movement of air into (Vi) and out of (VE) the lungs. In exercise physiology we primarily measure VE which is the product of respiratory frequency and tidal volume
Respiratory frequency can be termed as either:
• f (frequency)
• bpm (breaths per minute)
Tidal volume can be termed as either: Vt or Tv
Respiratory frequency can be termed as either:
• f (frequency)
• bpm (breaths per minute)
Tidal volume can be termed as either: Vt or Tv
12
New cards
physiological dead space
anatomic dead space plus the volume of any alveoli in which gas exchange is less than normal
13
New cards
anatomical dead space
the conducting zone; airways that fill with air but cannot perform gas exchange
M - 0.150 L
F - 0.100 L
M - 0.150 L
F - 0.100 L
14
New cards
Calculate VE
Tidal volume: 150ml
Breathing rate: 40 br/min
Dead space: 50ml
Tidal volume: 150ml
Breathing rate: 40 br/min
Dead space: 50ml
TV*(bpm)150ml*40br/min= 6L
15
New cards
Calculate VA
Tidal volume: 150ml
Breathing rate: 40 br/min
Dead space: 50ml
Tidal volume: 150ml
Breathing rate: 40 br/min
Dead space: 50ml
Bpm*(TV-dead space)40br/min * (150ml-50ml)= 4L
16
New cards
Fick's Law of Diffusion
The rate of gas transfer (V gas) is proportional to the tissue area, the diffusion coefficient of the gas, and the difference in the partial pressure of the gas on the two sides of the tissue, and inversely proportional to the thickness.
17
New cards
gas exchange in lungs
Alveoli provide surface for gas exchange
• Gasses diffuse across extremely thin (0.3micron) barrier of alveolar and capillary cells
• At rest 260ml/min of O2 enters The blood and 200ml/min of CO2 diffuses back into the alveolus
• Gasses diffuse across extremely thin (0.3micron) barrier of alveolar and capillary cells
• At rest 260ml/min of O2 enters The blood and 200ml/min of CO2 diffuses back into the alveolus
18
New cards
partial pressure of oxygen PO2
• Partial Pressure = % concentration x total pressure of gas mixture
• Partial pressure of O2 in room air at sea level: 0.2093 x 760mmHg\* = 159mmHg
• Partial pressure of O2 in room air at sea level: 0.2093 x 760mmHg\* = 159mmHg
19
New cards
alveolar pressure
Alveolar air = 0.145 x (760 mmHg - 47 mmHg) = 103 mmHg
Lower concentration due to CO, removal from blood and O, removal from lungs
• Must subtract water vapor pressure (47 mmHg)
Lower concentration due to CO, removal from blood and O, removal from lungs
• Must subtract water vapor pressure (47 mmHg)
20
New cards
Decreases in partial pressure at the top of the cascade
may limit diffusive/convective 02 transfer lower down in the cascade
Can be adapted with training
Can be adapted with training
21
New cards
Calculate the PO, on top of Mount Robson
Elevation: \~4000m
Barometric Pressure: \~484 mmHg
Elevation: \~4000m
Barometric Pressure: \~484 mmHg
PO, = FIO, \* barometric pressure
PO, = 0.2093 x 484PO, = 101 mmHg
PO, = 0.2093 x 484PO, = 101 mmHg
22
New cards
Fick's Law of Diffusion
A gas diffuses through a sheet of tissue at a rate:
1\. Directly proportional:
• To the tissue surface area
• A PO2 (pressure differential on each side of the membrane)
• A diffusion constant
2\. Inversely proportional:
• Tissue thickness
1\. Directly proportional:
• To the tissue surface area
• A PO2 (pressure differential on each side of the membrane)
• A diffusion constant
2\. Inversely proportional:
• Tissue thickness
23
New cards
Based on the oxygen cascade, can you predict some physiological limitations to VO2max?
* genetic factors,
* respiratory muscle strength,
* lung capacity,
* cardiac output,
* hemoglobin concentration,
* age,
* body composition.
Additionally, environmental conditions such as temperature and humidity can also affect VO2max.
* respiratory muscle strength,
* lung capacity,
* cardiac output,
* hemoglobin concentration,
* age,
* body composition.
Additionally, environmental conditions such as temperature and humidity can also affect VO2max.
24
New cards
Describe how oxygen is transported in the blood including the oxygen-hemoglobin dissociation curve
• Oxygen is transported in the blood with hemoglobin
• Red blood cells carry about 98% of oxygen in the form of hemoglobin.
• The oxygen-hemoglobin dissociation curve is a graph that shows the relationship between the amount of oxygen bound to a hemoglobin molecule, and the partial pressure of oxygen in the blood.
• At a higher partial pressure, more oxygen is able to bind to the hemoglobin molecule, while at a lower partial pressure, less oxygen binds to the hemoglobin.
25
New cards
Identify key components of the oxy-hemoglobin curve and apply to exercise and environmental conditions
The oxy-hemoglobin curve is composed of four key components:
oxygen saturation, oxygen delivery, release of oxygen from hemoglobin, and unloading of oxygen from tissue.
Oxygen saturation increases with greater oxygen delivery, which can be increased by increased levels of physical activity and an increase in environmental oxygen concentration.
Oxygen is released from hemoglobin as it binds to it and is unloaded from the tissue to be used for energy production.
Environmental conditions such as temperature, altitude, and air quality can also affect oxygen delivery and utilization.
26
New cards
how does oxygen move from high pressure to low pressure
Diffusion is a process in which molecules move from an area of high concentration to an area of low concentration. This process is driven by the kinetic energy of the molecules, which causes them to move randomly until they reach an equilibrium state.
27
New cards
Describe how oxygen is carried in the blood
• O2 molecules dissolved in the blood (Pa02)
• O2 bound to hemoglobin (SaO2)
• O2 bound to hemoglobin (SaO2)
28
New cards
Oxygen Dissolved in the Blood plasma
1st transport mechanismabout .003 mL of O2 will dissolve in 100 mL of blood for every 1mmHg of PO2Vol%=mL O2/100mL bloodSmall % of O2 is transported in the form of dissolved O2• Only sustain life for ~ 4 sHowever, dissolved is important as it sets the PO, of the blood and determines the magnitude to which hemoglobin is loaded with 02
29
New cards
Describe the oxygen-hemoglobin dissociation curve
shows how local partial pressure of oxygen controls oxygen loading and unloading from hemoglobin
30
New cards
Hemoglobin
An iron-containing protein in red blood cells that reversibly binds oxygen.
• Increases bloods O2 carrying capacity 65-70 times
• Hb + 4 02 > Hb,0g
• For each L of blood Hb binds \~ 19.7 ml of 0,/100 ml.
Blood contains \~ 15-16 g of Hb/100 ml
• Increases bloods O2 carrying capacity 65-70 times
• Hb + 4 02 > Hb,0g
• For each L of blood Hb binds \~ 19.7 ml of 0,/100 ml.
Blood contains \~ 15-16 g of Hb/100 ml
31
New cards
Hemoglobin cooperative binding
• Increasing infinity for 0, as sites become bound1 site bound = increase chance of 2 sites bound = increase chance of 3...etc4 sites per molecule
32
New cards
Relationship between PaO2 and SaO2
Sigmoidal relationship
33
New cards
How much oxygen is bound to hemoglobin at 100% saturation?
20ml /100ml blood
34
New cards
PaO2
partial pressure of oxygen in arterial blood0.3ml/100ml
35
New cards
SaO2
Bound oxygen saturation of hemoglobin in arterial blood20ml/100ml
36
New cards
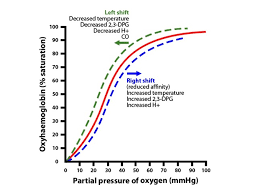
O2 dissociation curve
represents the percent of total blood hemoglobin that is saturated with oxygen at a given partial pressure of oxygen
Sigmoid curve
X - axis is PO2 mmHg
Y - axis is % saturated
Sigmoid curve
X - axis is PO2 mmHg
Y - axis is % saturated
37
New cards
O2 dissociation curve right shift
High temp, low pH, high PCO2During exercise
\-Decrease in O2 affinity
\-Indicates a larger partial pressure of O2 is required to saturate Hb at the level of the lungs
\-Decrease in O2 affinity
\-Indicates a larger partial pressure of O2 is required to saturate Hb at the level of the lungs
38
New cards
Bohr Effect on Oxyhemoglobin Dissociation Curve
decrease pH -\> rightincrease temp -\> rightincrease 2-3 BCG -\> right
39
New cards
O2 Dissociation Curve - Left Shift
Low temp, high pH, low PCO2In lungs
\-Increase in O2 affinity
\-Indicates that a lower partial pressure of O2 is required to saturate Hb
\-Increase in O2 affinity
\-Indicates that a lower partial pressure of O2 is required to saturate Hb
40
New cards
Why does the O2 dissociation curve shift right during exercise?
Working muscle increases temp, lowers pH, and increases PCO2. These conditions allow hemoglobin to lower O2 affinity and release O2 to working muscle.
41
New cards
Why is there a leftward shift of the O2 dissociation curve at the lungs?
Cooler ambient air in lungs increases hemoglobin affinity to O2 and O2 is more easily bound for transport
42
New cards
Ventilatory Control
• how our body controls rate and depth of breathing in response to metabolic need
• The respiratory center in our medulla regulates breathing
• Breathing is an intrinsic rhythmic activity largely under involuntary control (autonomic system)
• Control of somatic motor neurons in medulla oblongata
• The respiratory center in our medulla regulates breathing
• Breathing is an intrinsic rhythmic activity largely under involuntary control (autonomic system)
• Control of somatic motor neurons in medulla oblongata
43
New cards
Chemoreceptors
chemical sensors in the brain and blood vessels that identify changing levels of oxygen and carbon dioxide (primary stimulus)
44
New cards
peripheral chemoreceptors
(carotid and aortic bodies) sense change in PO2, PH, PCO2
When receptors activated -> AP -> brain stem - > Somatic motor neurons ->. skeletal muscle (ventilatory muscles)
When receptors activated -> AP -> brain stem - > Somatic motor neurons ->. skeletal muscle (ventilatory muscles)
45
New cards
PO2 regulator
not powerful regulator - must drop below 60 mmHg to see effect
46
New cards
central chemoreceptors
(medulla) sense change in PCO, and monitor cerebrospinal fluid (CSF)
MOST IMPORTANTLY CHEMICAL REGULATOR
MOST IMPORTANTLY CHEMICAL REGULATOR
47
New cards
Ventilation during exercise
• Disproportionate increase before exercise mostly due to stimulation from cerebral cortex and a rapid change in afferent neural activity from limb movement.
• This causes an overshoot in Ve that does not necessary match metabolic demand and is an anticipatory response.
• During progressive submaximal exercise, VE increases in a proportional manner and is highest at max exercise intensity.
• At some time point during increasingly intense submaximal exercise, the increase in Ve is not proportional but experiences a disproportionate increase. Due to CO2 increase
48
New cards
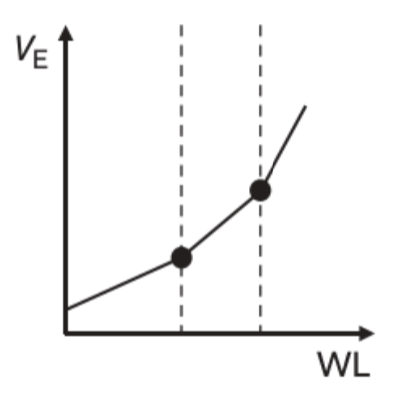
Minute Ventilation (VE) during exercise and Workload
There are two distinctive breakpoints in VE during incremental exercise
\- these represent aerobic and anaerobic threshold
\- these represent aerobic and anaerobic threshold
49
New cards
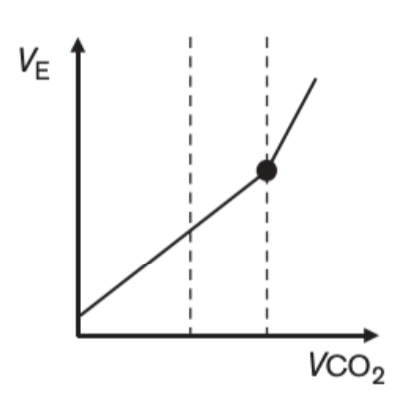
Minute Ventilation (VE) during exercise and CO2 production
VE is matched with CO2 production during incremental exercise until aerobic threshold
50
New cards
Describe how O2 is transported in the blood, and how this changes during exercise.
Oxygen is transported in the blood by hemoglobin, a protein found in red blood cells.
During exercise the body causes an increase in respiration and heart rate, which increases the amount of oxygen circulating in the blood. This increased demand is met by releasing oxygen from the hemoglobin, resulting in an increase in the concentration of oxygen in the blood. This process helps to provide the extra oxygen needed for increased muscle activity during exercise.
During exercise the body causes an increase in respiration and heart rate, which increases the amount of oxygen circulating in the blood. This increased demand is met by releasing oxygen from the hemoglobin, resulting in an increase in the concentration of oxygen in the blood. This process helps to provide the extra oxygen needed for increased muscle activity during exercise.
51
New cards
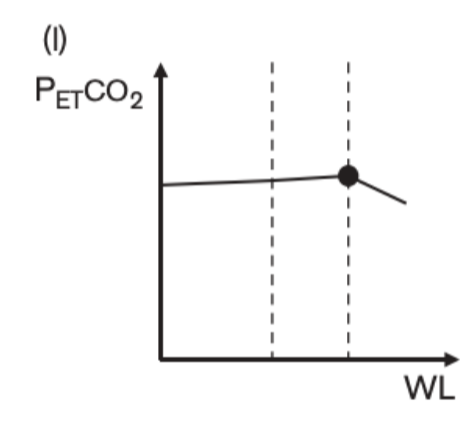
% of expired CO2 and workload during exercise
%of expired CO2 (shown as PetCO2 here) is stable throughout incremental exercise until anaerobic threshold. The disproportionate increase in VE causes the % to decrease as we blow off more CO2
52
New cards
Which of the following could stimulate an increase in breathing?
a) Decrease in PO2
b) Increase in pH
c) Increase in PCO2
d) Aand C
a) Decrease in PO2
b) Increase in pH
c) Increase in PCO2
d) Aand C
D
53
New cards
anaerobic threshold
"The anaerobic threshold (AnT) is defined as the highest sustained intensity of exercise for which measurement of oxygen uptake can account for the entire energy requirement" Svedahl & Macintosh (2003)
54
New cards
steady state exercise
A state of aerobic exercise in which the intensity remains consistent, as opposed to alternating between higher and lower intensities.
• can not be maintained above AnT. Exercise above AnT will result in VO2max being reached and the cessation of exercise
• can not be maintained above AnT. Exercise above AnT will result in VO2max being reached and the cessation of exercise
55
New cards
ventilatory threshold
The point during graded exercise in which ventilation increases disproportionately to oxygen uptake, signifying a switch from predominately aerobic energy production to anaerobic energy production.Double break point relationship
56
New cards
Which of the following is an indicator of anaerobic threshold
A. A disproportionate increase in VO2 compared to workload
B. A disproportionate increase in VE compared to VCO2
C. A decrease in VE/O2
D. A increase in FECO2
A. A disproportionate increase in VO2 compared to workload
B. A disproportionate increase in VE compared to VCO2
C. A decrease in VE/O2
D. A increase in FECO2
B
57
New cards
Describe the physiological causes of anaerobic threshold
• Increased perception of energy demand (exercise intensity) by respiratory center in brain, resulting in increased VE-
• Increased afferent neural activity from muscle and joint receptors.
• Increased H\* and CO, levels that stimulate chemoreceptors (central and peripheral) and stimulate an increase in VE.
• This is the primary link between LT and VT.
• Increased afferent neural activity from muscle and joint receptors.
• Increased H\* and CO, levels that stimulate chemoreceptors (central and peripheral) and stimulate an increase in VE.
• This is the primary link between LT and VT.
58
New cards
Does LT cause VT or is it coincidental?
• They are linked through the stimulation of Ve by chemoreceptors due to increased [H*] and from increased CO, levels through the bicarbonate buffering ofH* that are anaerobically produced during graded exercise.
• With this link, it could be concluded that LT causes VT and therefore slightly precedes VT during graded exercise.
• With this link, it could be concluded that LT causes VT and therefore slightly precedes VT during graded exercise.
59
New cards
Which of the following best describes the physiological cause of anaerobic threshold?
a. Increased lactate concentrations
b. Metabolic acidosis
c. A disproportionate increase in VE
d. A&B
a. Increased lactate concentrations
b. Metabolic acidosis
c. A disproportionate increase in VE
d. A&B
B
60
New cards
Exceptions to LT and VT link.
1. Neary et al. (1985) showed that VT can precede LT if subjects were depleted of muscle glycogen prior to having an AT test.
* Glycogen depletion causes a delay in the onset of lactate accumulation due to a decrease in anaerobic glyogenolysis but...
* VT is unchanged
2. McArdles' disease
* these people don't have phosphorylase and therefore don't produce (much) lactate during exercise
* but they display the usual changes in VE
61
New cards
Ventilation increases prior to the start of exercise (anticipatory response) due to what?
Activation of the respiratory center (central command) in the medulla (via motor cortex)
62
New cards
Describe the components and controllers of cardiac output and their adjustment and adaptation to exercise
• Increase in cardiac output• Increase in stroke volume
• Decrease in HR at a given submaximal load
• Decrease in HR at a given submaximal load
63
New cards
Describe intrinsic control of heart rate
The heart has internal control of contraction.The SA node/ pace maker can control rythme of the heart with out external stimuli
SA node -> artis -> to AV node -> throughout ventricles
SA node -> artis -> to AV node -> throughout ventricles
64
New cards
AV node (atrioventricular node)
region of the heart between the right atrium and right ventricle from which electrical impulses spread to the ventricles during a heartbeat
Electrical stimulation from SA node is slightly delayed so that ventricle can fill with blood.
Electrical stimulation from SA node is slightly delayed so that ventricle can fill with blood.
65
New cards
SA node
At rest, the heart has an intrinsic pacemaker
• The sinoatrial node (SA) in rear of right atrium have "leaky ion" channels (to Na\* &Ca?+) causing spontaneous depolarization after repolarization.
• The sinoatrial node (SA) in rear of right atrium have "leaky ion" channels (to Na\* &Ca?+) causing spontaneous depolarization after repolarization.
66
New cards
Describe extrinsic control of heart rate
Afferent stimulus from many sources that affect HR and vasoconstriction/dialation
67
New cards
parasympathetic nervous system affect on heart
Decreases excitability of SA node which decreases heart rate, decreases conductivity of electrical impulses through the atrioventricular conduction system and decreases the force of contraction. Parasympathetic influence increases during exhalation
68
New cards
sympathetic nervous system affect on Heart
Increases excitability of SA node which increases heart rate, increase conductivity of electrical impulses through the atrioventricular conduction system and increases force of atrioventricular contraction. Sympathetic influence increases during inhalation
69
New cards
Extrinsic Control of the HeartAutonomic Nervous System - Sympathetic outflow
Release of norepinephrine from sympathetic nerve endings accelerates the SA node depolarization thus increasing HR, SV and Q
• Increases HR - chronotropic
• Increase myocardial contractility - inotropic
Release of epinephrine from the adrenal gland also increases HR
Sympathetic stimulation also has a large effect on blood flow throughout the body:
• Vasoconstriction in organs not vital to exercise (stomach, spleen, bladder)
• Vasodilation of coronary vessels
Anticipatory response
70
New cards
Extrinsic Control of the Heart - parasympathetic input
Autonomic Nervous System - Parasympathetic outflow
Autonomic Nervous System - Parasympathetic outflow
Parasympathetic• Release of acetylcholine from nerve endings: decreases HR, SV and Q (reduces the SA nodes ability to depolarize).
Before and during exercise we undergo both an increase in sympathetic outflow as well as parasympathetic inhibition
Before and during exercise we undergo both an increase in sympathetic outflow as well as parasympathetic inhibition
71
New cards
Extrinsic Control of the Heart - peripheral receptors
Located in blood vessels, joints, and muscles.These send information to the cardiovascular center.
72
New cards
Baroreceptors
• Pressure-sensitive receptors found in the aortic arch and carotid sinus
• Act to inhibit sympathetic stimulation at a local level - decrease HR, Q, and BP
• Respond to stretch in arterial vessels such as during an increase in Q and systolic BP
• The need for increased blood flow to body during exercise actually overrides baroreceptors.
• Act to inhibit sympathetic stimulation at a local level - decrease HR, Q, and BP
• Respond to stretch in arterial vessels such as during an increase in Q and systolic BP
• The need for increased blood flow to body during exercise actually overrides baroreceptors.
73
New cards
Chemoreceptors
• Respond primarily to H* & PCO, which can increase sympathetic drive, increase Q which leads to increase blood flow to skeletal muscle
74
New cards
Mechanoreceptors
• Increase afferent nerve activity from mechanoreceptors lead to increased CNS drive, resulting in increased Q and thus increased blood flow to skeletal muscle
75
New cards
Neurotransmitters cardiovascular system
Sympathetic:Epinephrine & Norepinephrine
Parasympathetic:Acetylcholine
Parasympathetic:Acetylcholine
76
New cards
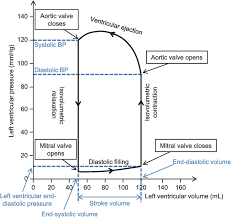
Describe the components of stroke volume (EDV, ESV, Contractility and their adjustment and adaptation to exercise)
Draw and label a resting pressure-volume loop
Draw and label a resting pressure-volume loop with changes to preload, afterload, and contractility
Draw and label a resting pressure-volume loop
Draw and label a resting pressure-volume loop with changes to preload, afterload, and contractility
• Stroke volume is defined by the amount (ml) of blood ejected by the left ventricle (LV)
•The left ventricle goes through a relaxation phase when it needs to fill with blood, and a contraction phase when it needs to eject the blood via the aorta
• Relaxation = diastole
• Contraction = systole
• The volume and pressure of the blood in the LV is related and will change depending on the phase
• We can explore the relationship between pressure and volume during a cardiac cycle by using a pressure-volume loop
77
New cards
Stroke volume
• Volume of blood pumped by the left ventricle in one contraction
• SV = EDV - ESV
• Average resting SV = 70 m
• Increases with exercise (acute adjustment/response)
• Average/untrained max \~100-140 ml
• Elite athlete could be as high as 200 ml (adaptation)
• SV = EDV - ESV
• Average resting SV = 70 m
• Increases with exercise (acute adjustment/response)
• Average/untrained max \~100-140 ml
• Elite athlete could be as high as 200 ml (adaptation)
78
New cards
Ventricular Contractility (inotropy)
Sympathetic response sends norepinephrine and increases ca+ availability
79
New cards
Stroke volume is affected by the Length-tension relationship:
Frank-Starling Law
Frank-Starling Law
Force created by the myocardium is directly related to the length of the sarcomereMore stretch = More forceIncrease sarcomere length \> increase tension -\> increase SV
80
New cards
End Systolic Volume (ESV)
volume of blood remaining in each ventricle after systole
81
New cards
End Diastolic Volume (EDV)
Volume of blood in the ventricles at the end of diastole ("preload")
82
New cards
Cardiac Output (Q)
Volume of blood pumped by the left ventricle per minute
Q = HR x SV
Expressed in ml/min or L/min.
Healthy individuals:
70kg male:
• SV at rest = 70ml
• HR at rest = 70bpmQ = 70 ml x 70bpm
Q = 4900ml/min
At rest, Q = \~ 5 L/min
Q = HR x SV
Expressed in ml/min or L/min.
Healthy individuals:
70kg male:
• SV at rest = 70ml
• HR at rest = 70bpmQ = 70 ml x 70bpm
Q = 4900ml/min
At rest, Q = \~ 5 L/min
83
New cards
Max cardiac output in athlete
Due to stroke volume
Q max can exceed 30 L/min in athletes
Q max can exceed 30 L/min in athletes
84
New cards
Stroke volume during exercise
increases to 50-75% then plateau or decrease
85
New cards
Why would stoke volume continue to increase?
• Enhanced venous return producing an increase in end diastolic volume(EDV) & contractility in elite endurance athletes during VO2max intensity exercise.
86
New cards
Why does stroke volume plateau?
• A decrease in preload: the heart is beating faster with less time to complete filling.
• An increase in afterload, ie. greater force to eject against, decreases output.
• Possible cardiac fatigue. Disease or age.
• An increase in afterload, ie. greater force to eject against, decreases output.
• Possible cardiac fatigue. Disease or age.
87
New cards
Frank-Starling Law of the Heart
the more the heart fills with blood during diastole, the greater the force of contraction during systole
Preload
Preload
88
New cards
preload, contractility, afterload
3 factors that affect stroke volume
89
New cards
cardiovascular adaptation to exercise
Increase in cardiac outputIncrease in stroke volumeDecrease in HR at a given submaximal load (stroke volume takes over)
90
New cards
decrease stroke volume
Decrease EDV
Increase ESV
• Wall stress during ejection is known as afterload
Increase ESV
• Wall stress during ejection is known as afterload
91
New cards
Afterload
the amount of resistance to ejection of blood from the ventricle
Can be thought of as the pressure at which blood leaves the aorta
Often considered to be the resistance of the circulation.
Heart has to overcome afterload in order to expel blood
If you increase the pressure that the ventricle has to generate to expel blood, stroke volume will decrease
Can be thought of as the pressure at which blood leaves the aorta
Often considered to be the resistance of the circulation.
Heart has to overcome afterload in order to expel blood
If you increase the pressure that the ventricle has to generate to expel blood, stroke volume will decrease
92
New cards
The Arterial System
• Responsible for delivering high-pressure oxygenated blood to periphery
• Layers of connective and smooth tissue
• No gas exchange due to thickness
• Elastic component to allow for vasocontraction and vasodilation
• Arteries -> arterioles -> capillaries
• Ability to dramatically alter diameter thus blood flow
• Layers of connective and smooth tissue
• No gas exchange due to thickness
• Elastic component to allow for vasocontraction and vasodilation
• Arteries -> arterioles -> capillaries
• Ability to dramatically alter diameter thus blood flow
93
New cards
Venous system
• Capillaries feed deoxygenated blood (1 RBC at a time) into the venous system
Eventually blood from the upper and lower portions of the body empty into the superior and inferior vena cava
Operates at a low pressure (almost 0 mmHo) by the time it reaches the rightatrium = con be problematic
Venous system contains 65% of total blood volume
Eventually blood from the upper and lower portions of the body empty into the superior and inferior vena cava
Operates at a low pressure (almost 0 mmHo) by the time it reaches the rightatrium = con be problematic
Venous system contains 65% of total blood volume
94
New cards
Which component of the arterial system has the slowest blood velocity?
Capillaries
95
New cards
Would the ability of our capillaries (i.e. capillarization) be a central or a peripheral factor?
Peripheral
96
New cards
Define blood pressure (SBP. DBP. MAP) and how it is calculated
The force of the blood during ejection from the left ventricle distends the vasculature creating pressure.
• This propagates a wave of pressure through arterial system and can be measured as a pulse
Systolic and diastolic
• This propagates a wave of pressure through arterial system and can be measured as a pulse
Systolic and diastolic
97
New cards
systolic pressure
Blood pressure in the arteries during contraction of the ventricles.~120mmHg
98
New cards
diastolic pressure
Blood pressure that remains between heart contractions.~80mmHg
99
New cards
Mean Arterial Pressure (MAP)
pressure forcing blood into tissues, averaged over cardiac cycle
MAP = Q X TPR
OR
MAP= DBP + (0.33(SBP-DBP))
MAP = Q X TPR
OR
MAP= DBP + (0.33(SBP-DBP))
100
New cards
Total Peripheral Resistance (TPR)
the resistance to the flow of blood through the entire systemic circulation
TRP = MAP/Q
TRP = MAP/Q