GW Blok 6 Seminar 3.1 Statistical inference for one or two samples
1/23
There's no tags or description
Looks like no tags are added yet.
Name | Mastery | Learn | Test | Matching | Spaced |
|---|
No study sessions yet.
24 Terms
What is the null hypothesis (H₀)?
A statement that there is no effect, no difference, or status quo. It always includes equality (e.g., =, ≤, ≥).
What is the alternative hypothesis (Ha)?
A statement that there is an effect or difference—what you are trying to find evidence for.
Are hypotheses about the sample or the population?
About the population parameters, not the sample statistics.
What does the significance level (α) represent?
The probability of rejecting the null hypothesis when it is actually true (Type I error). Commonly set at 0.05.
Het significantieniveau is de grens waaronder de nulhypothese wordt verworpen. Het stelt de maximale kans op een type I-fout in, dit is het onterecht verwerpen van een ware H0.
Alfa is de critical values, bepaalt de grenzen van region of rejection.
Why can we never “prove” H₀ or Ha?
Because hypothesis testing works by assessing the likelihood of data assuming H₀ is true; it doesn’t prove, only provides evidence.
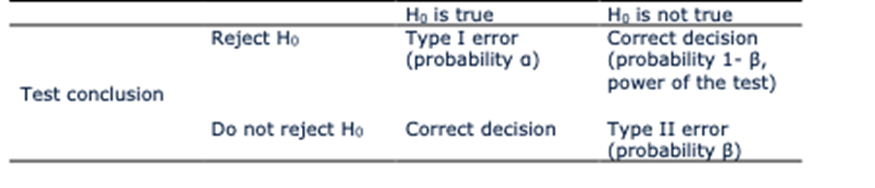
What is a type I error?
Rejecting the null hypothesis when it is actually true → false positive
Example (birth weight): Saying that the average birth weight ≠ 2000g, when in fact it is 2000g.
Probability: This error happens with probability α (e.g., 5% if significance level is 0.05).
Controlled by you — you set α before testing (commonly 0.05).
Interpretation: The maximum risk you're willing to take for claiming a false effect.
Thus, any conclusion based on statistical reasoning is uncertain, but with statistics it is possible to control for this uncertainty by means of the user-specified value α, which is called the ‘level of significance α’.
What is a type II error?
Not rejecting the null hypothesis when the alternative is true → false negative
Example: Saying that the average birth weight = 2000g, when in fact it isn’t.
Probability: Happens with probability β, which depends on factors like sample size and effect size.
Not directly controlled, but can be minimized with larger sample sizes or stronger effects.
Interpretation: Risk of missing a real effect.
What is the power of a test?
Probability of correctly rejecting the null hypothesis when the alternative is true.
Formula: Power = 1 – β
Goal: We usually aim for power ≥ 80% (β ≤ 0.2)
Increase power by:
Larger sample size (n)
Larger effect size (difference between μ and μ₀)
Lower data variability (standard deviation)
Higher α (but increases Type I error)
Summary tables of type of errors and power

What is the relation between α and β?
Lower α → Higher β
Lower β (higher power) → May require larger α or bigger sample size
Think of it like a court case:
H₀ = Innocent
Hₐ = Guilty
Type I Error = convicting an innocent person → serious → keep α low
Type II Error = letting a guilty person go → power matters!
What is a p-value?
The p-value is the probability—assuming the null hypothesis is true—of obtaining a test statistic as extreme or more extreme than the one observed.
It reflects how compatible your sample data is with the null hypothesis.
If the null value (e.g. 2000) falls outside the (1 − α)% confidence interval:
⇒ p-value ≤ α
Er is een significant verschil ⇒ Reject H₀
If it falls inside the CI:
⇒ p-value > α
Er is geen significant verschil ⇒ Do not reject H₀
How does the sample size affects the p-value
Large sample size: even small differences can lead to small p-values (i.e., statistically significant)
Small sample size: may not detect meaningful effects due to high variability
What is a one-sample problem?
Only one sample is used (no comparison between two groups)
We are comparing the sample against a fixed known/hypothesized value
What are the three methods of hypothesis testing?
Confidence interval approach
Test statistic (Z or T) approach
P-value approach
What is the confidence interval approach of hypothesis testing?
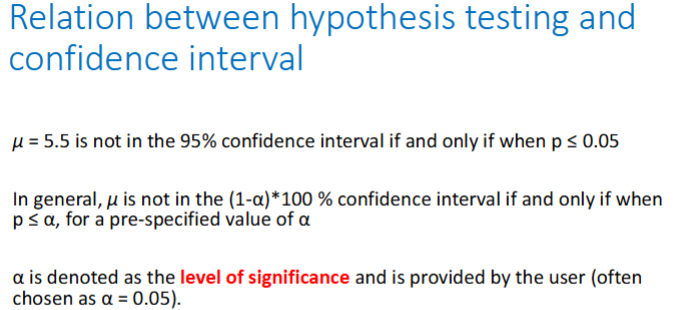
If H0 is covered by the 95% confidence interval, it is likely that the value of 5.5 is the population value with 95% confidence
If H0 is NOT covered by the 95% confidence interval, it is unlikely that the value of 5.5 is the population value with 95% confidence
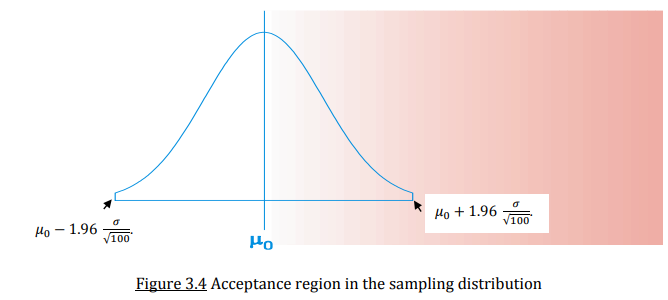
The region of acceptance: the interval between the upper and lower values of the CI
If sample average falls in the region of acceptance → significant difference → accept H0
The region of rejection: the interval outside the upper and lower values of the CI
If sample average falls in the region of rejection → no significant difference → reject H0
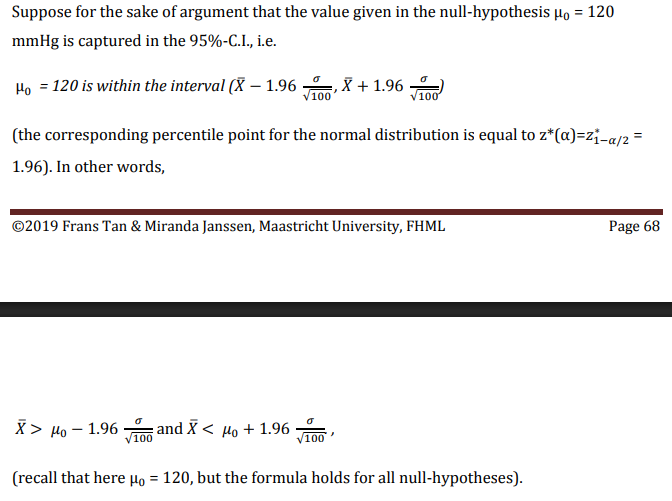
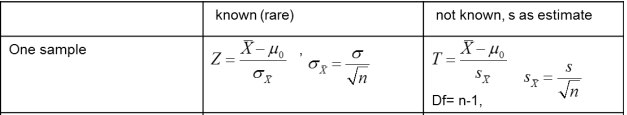
What is the test statistic approach of hypothesis testing?
Use Z-statistic if (sigma2 is known) and T-statistic if (sigma2 is unknown)
Known if n > 30
Unknown if < 30
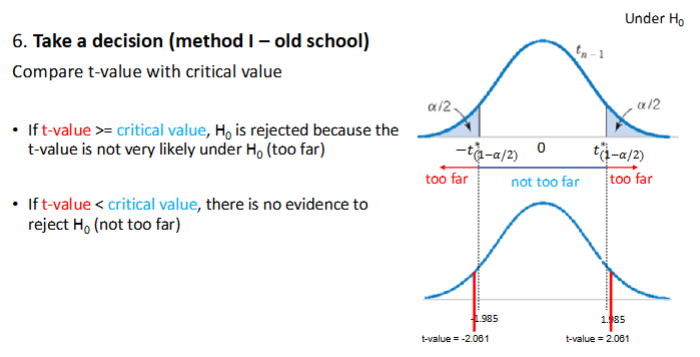
Region of acceptance: the test statistic lies between the critical values → accept H0
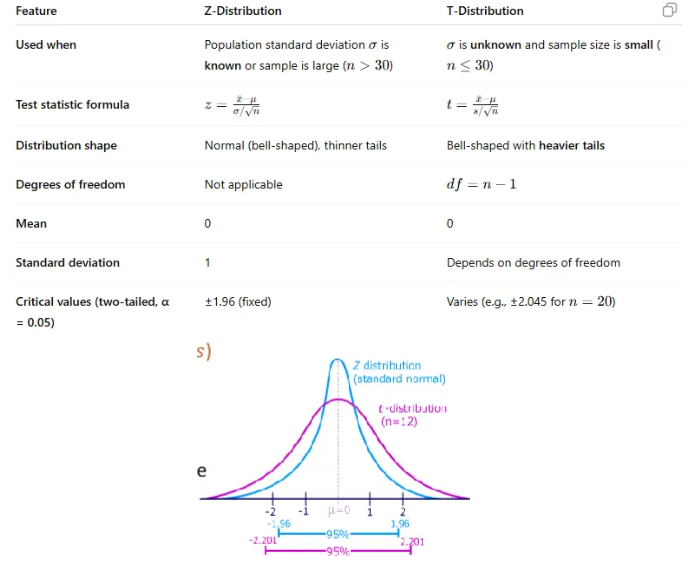
-1.96 < Z-statistic < 1.96
-2.201 < T-statistic < 2.201
Critical t-statistic is not standard → given on exam
Region of rejection: the test statistic lies outside the critical values → reject H0
Z-statistic ≤ -1.96 or Z-statistic ≥ 1.96
T-statistic ≤ -2.201 or T-statistic ≥ 2.201
Critical t-statistic is not standard → given on exam
What is the p-value approach of hypothesis testing?
If the null value (e.g. 2000) falls outside the (1 − α)% confidence interval:
⇒ p-value ≤ α
Er is een significant verschil ⇒ Reject H₀
If it falls inside the CI:
⇒ p-value > α
Er is geen significant verschil ⇒ Do not reject H₀
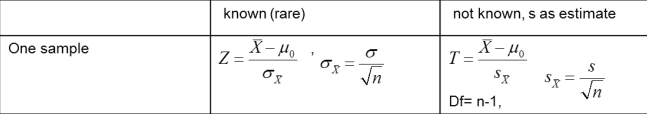
Summary statistics for groups comparison
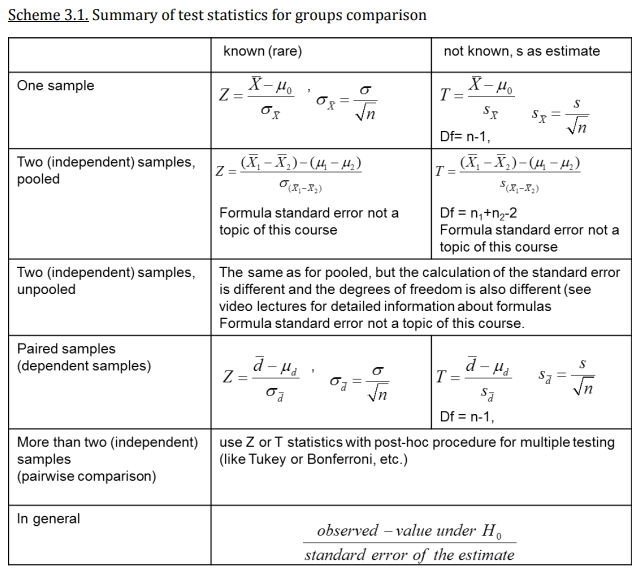
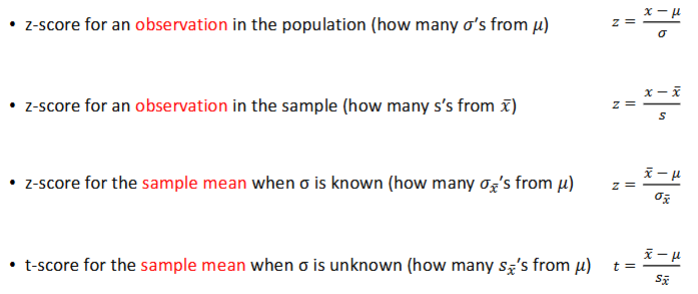
What is the difference between a Z- and T-distribution?
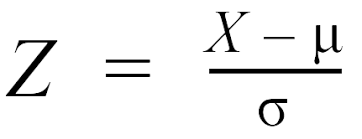
What are the different formulas for z-score if the observation is in the population and in a sample? And when the sample mean is known and unknown?
Expected score for one individual on the exam (first two)
Expected score for a group on the exam (last two)
What are the 6 steps of hypothesis testing?
State the hypotheses
H0: μ variable 1 = μ variable 2 or μ variable 1 = specific value
Ha: μ variable 1 ≠ μ variable 2 or μ variable 1 ≠ specific value
Choose a level of significance
α = 5% (1-α = 95% is the confidence level)
Critical value
Critical t-values: +-(1-α /2), +- (n-1)
This value is given on the exam
Under the H0 and unknown σ, the t-score follows a t-distribution with n-1 degrees of freedom
Under the H0 and known s, the z-score follows a z-distribution
Collect and summarize the data
n, x bar, and standard error of the estimate (x bar)
Compute the test statistic
T-statistic or z-statistic
Take a decision
Compare t-value/z-value with critical value
Compare p-value with significance level (α)
Decision making visualized
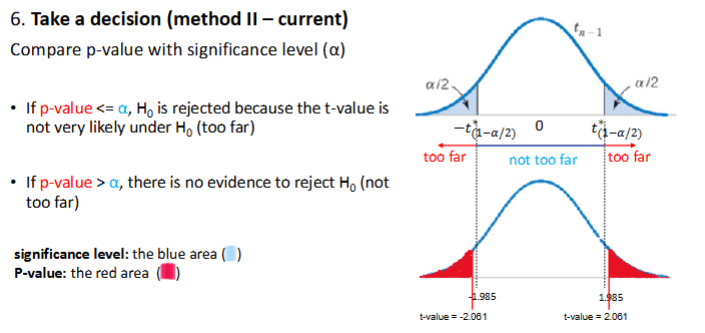
What is the relation between the p-value and hypothesis testing?
p-value: evidence of how favorable the null hypothesis is
(very) large p-values favor the null hypothesis
(very) small p-values favor the alternative hypothesis
IMPORTANT: p-value is NOT the probability that the null hypothesis is true
In SPSS specify what value of μ we want to test with the one sample test
What is the relation between confidence interval and hypothesis testing?
In SPSS specify what value of μ we want to test with the one sample test