Bio stats: problems
1/20
Earn XP
Description and Tags
Practice final exam: problems
Name | Mastery | Learn | Test | Matching | Spaced |
|---|
No study sessions yet.
21 Terms
The shiny silver mouse has a population mean size of 8.3 cm and and a population standard deviation of 1.2 cm. If one individual is sampled from the population what is the probability that it will be greater than 9 cm?
Choose the correct approach to calculate this probability.
Normal distribution equation
The shiny silver mouse has a population mean size of 8.3 cm and and a population standard deviation of 1.2 cm. If one individual is sampled from the population what is the probability that it will be greater than 9 cm?
Use the normal distribution equation and the appropriate statistical table to calculate the probability and enter it below.
0.28
A study was conducted of people who had bicycle crashes and whether or not they suffered facial injuries. Based on a sample of 531 individuals these results were obtained:
| Helmet Worn | No Helmet Worn |
Facial Injuries | 30 | 182 |
No Facial Injuries | 83 | 236 |
Calculate the conditional probability of a facial injury given that the individual did not wear a helmet. Enter the value below rounding to two decimal digits.
0.44
A study was conducted of people who had bicycle crashes and whether or not they suffered facial injuries. Based on a sample of 531 individuals these results were obtained:
| Helmet Worn | No Helmet Worn |
Facial Injuries | 30 | 182 |
No Facial Injuries | 83 | 236 |
Choose the correct hypothesis test to see if there is a difference in the probability of facial injury when we compare people wearing helmets to people that don’t.
Chi-square test for categorical data
A study was conducted of people who had bicycle crashes and whether or not they suffered facial injuries. Based on a sample of 531 individuals these results were obtained:
| Helmet Worn | No Helmet Worn |
Facial Injuries | 30 | 182 |
No Facial Injuries | 83 | 236 |
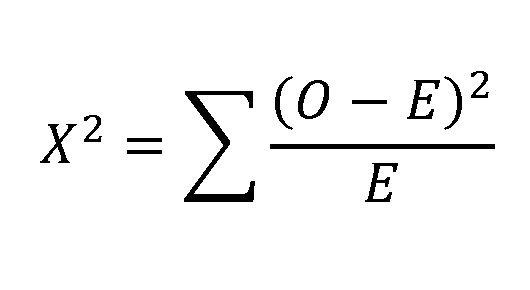
The correct approach is a Chi-square test for categorical data. Calculate the Chi-square statistic and enter it below.

10.69
A study was conducted of people who had bicycle crashes and whether or not they suffered facial injuries. Based on a sample of 531 individuals these results were obtained:
| Helmet Worn | No Helmet Worn |
Facial Injuries | 30 | 182 |
No Facial Injuries | 83 | 236 |
Enter below the Chi-square critical value from the Chi-square distribution table (don't round it and enter it exactly as it appears on the table)
3.84
A study was conducted of people who had bicycle crashes and whether or not they suffered facial injuries. Based on a sample of 531 individuals these results were obtained:
| Helmet Worn | No Helmet Worn |
Facial Injuries | 30 | 182 |
No Facial Injuries | 83 | 236 |
The correct calculated Chi-square statistic is 10.71 and the Chi-square critical value is 3.84. Choose the correct conclusion.
Reject the null hypothesis. The probability of facial injury is dependent on wearing a helmet.
A researcher is interested in studying the effects of seed variety and fertilizer type on corn plant growth. There are three different seed varieties and three different fertilizers that will be tested in context of a factorial design two-way ANOVA. Forty-five (45) seeds total were used in this experiment distributed in cells as follows:
Seed variety | Fertilizer | ||
I | II | III | |
A | 5 seeds | 5 seeds | 5 seeds |
B | 5 seeds | 5 seeds | 5 seeds |
C | 5 seeds | 5 seeds | 5 seeds |
The resulting ANOVA table is presented below:
Source of variation
|
Sum of Squares |
df |
Mean Squares |
F |
Critical value |
Cells Seeds Fertilizer | 1105.9 512.86 449.46 |
|
|
|
|
Interaction Error |
555.55 |
|
| ||
Total | 1661.45 |
|
|
|
|
Calculate the sum of squares for the interaction and enter the value below.
Correct answer:
143.58
A researcher is interested in studying the effects of seed variety and fertilizer type on corn plant growth. There are three different seed varieties and three different fertilizers that will be tested in context of a factorial design two-way ANOVA. Forty-five (45) seeds total were used in this experiment distributed in cells as follows:
Seed variety | Fertilizer | ||
I | II | III | |
A | 5 seeds | 5 seeds | 5 seeds |
B | 5 seeds | 5 seeds | 5 seeds |
C | 5 seeds | 5 seeds | 5 seeds |
The resulting ANOVA table is presented below:
Source of variation
|
Sum of Squares |
df |
Mean Squares |
F |
Critical value |
Cells Seeds Fertilizer | 1105.9 512.86 449.46 |
|
|
|
|
Interaction Error | 143.58 555.55 |
|
| ||
Total | 1661.45 |
|
|
|
|
Calculate the degrees of freedom for the interaction and enter the number below
4
A researcher is interested in studying the effects of seed variety and fertilizer type on corn plant growth. There are three different seed varieties and three different fertilizers that will be tested in context of a factorial design two-way ANOVA. Forty-five (45) seeds total were used in this experiment distributed in cells as follows:
Seed variety | Fertilizer | ||
I | II | III | |
A | 5 seeds | 5 seeds | 5 seeds |
B | 5 seeds | 5 seeds | 5 seeds |
C | 5 seeds | 5 seeds | 5 seeds |
The resulting ANOVA table is presented below:
Source of variation
|
Sum of Squares |
df |
Mean Squares |
F |
Critical value |
Cells Seeds Fertilizer | 1105.9 512.86 449.46 | 8 2 2 4 36 |
|
|
|
Interaction Error | 143.58 555.55 |
|
| ||
Total | 1661.45 | 44 |
|
|
|
Calculate the F statistic for the interaction and enter it below.
2.23
A researcher is interested in studying the effects of seed variety and fertilizer type on corn plant growth. There are three different seed varieties and three different fertilizers that will be tested in context of a factorial design two-way ANOVA. Forty-five (45) seeds total were used in this experiment distributed in cells as follows:
Seed variety | Fertilizer | ||
I | II | III | |
A | 5 seeds | 5 seeds | 5 seeds |
B | 5 seeds | 5 seeds | 5 seeds |
C | 5 seeds | 5 seeds | 5 seeds |
The resulting ANOVA table is presented below:
Source of variation
|
Sum of Squares |
df |
Mean Squares |
F |
Critical value |
Cells Seeds Fertilizer | 1105.9 512.86 449.46 | 8 2 2 4 36 |
256.43 224.73 35.90 15.43 |
|
|
Interaction Error | 143.58 555.55 | 2.33 |
| ||
Total | 1661.45 | 44 |
|
|
|
Enter below the F critical value for the interaction from the F distribution table used in class (enter it exactly as it appears on the table).
Incorrect answer:
2.69
A researcher is interested in studying the effects of seed variety and fertilizer type on corn plant growth. There are three different seed varieties and three different fertilizers that will be tested in context of a factorial design two-way ANOVA. Forty-five (45) seeds total were used in this experiment distributed in cells as follows:
Seed variety | Fertilizer | ||
I | II | III | |
A | 5 seeds | 5 seeds | 5 seeds |
B | 5 seeds | 5 seeds | 5 seeds |
C | 5 seeds | 5 seeds | 5 seeds |
The resulting ANOVA table is presented below:
Source of variation
|
Sum of Squares |
df |
Mean Squares |
F |
Critical value |
Cells Seeds Fertilizer | 1105.9 512.86 449.46 | 8 2 2 4 36 |
256.43 224.73 35.90 15.43 |
|
|
Interaction Error | 143.58 555.55 | 2.33 | 2.69 | ||
Total | 1661.45 | 44 |
|
|
|
The correct F statistic for the interaction is 2.33 and the critical value is 2.69. What can be concluded about the interaction.
Fail to reject the null hypothesis. The interaction between fertilizer and seed variety is not significant.
A researcher is studying how testosterone levels affect the size of the territory of individual fence lizards (Sceloporus undulatus). He samples 8 individuals and injects them with different doses (standardized by weight) of testosterone and observes the size of their territory in the field. The researcher conducts a linear regression and needs help completing the following ANOVA table to test for the significance of the slope.
Source of variation
|
Sum of Squares |
df |
Mean Squares |
F |
Critical value |
Regression | 1050 |
|
|
|
|
Error |
|
|
|
|
|
Total | 1200 |
|
|
|
|
Calculate the F statistic and enter it below:
42
A researcher is studying how testosterone levels affect the size of the territory of individual fence lizards (Sceloporus undulatus). He samples 8 individuals and injects them with different doses (standardized by weight) of testosterone and observes the size of their territory in the field. The researcher conducts a linear regression and needs help completing the following ANOVA table to test for the significance of the slope.
Source of variation
|
Sum of Squares |
df |
Mean Squares |
F |
Critical value |
Regression | 1050 | 1 | 1050 | 42 |
|
Error | 150 | 6 | 25 |
|
|
Total | 1200 | 7 |
|
|
|
Enter below the F critical value from the F distribution table used in class (do not round it and enter it exactly as it appears in the table):
5.99
A researcher is studying how testosterone levels affect the size of the territory of individual fence lizards (Sceloporus undulatus). He samples 8 individuals and injects them with different doses (standardized by weight) of testosterone and observes the size of their territory in the field. The researcher conducts a linear regression and needs help completing the following ANOVA table to test for the significance of the slope.
Source of variation
|
Sum of Squares |
df |
Mean Squares |
F |
Critical value |
Regression | 1050 | 1 | 1050 | 42 | 5.99 |
Error | 150 | 6 | 25 |
|
|
Total | 1200 | 7 |
|
|
|
The ANOVA table above is complete. Choose the correct conclusion from the options below:
Reject the null hypothesis. The slope for the linear relationship between testosterone dose and territory size is significantly different from zero.
A researcher is studying how testosterone levels affect the size of the territory of individual fence lizards (Sceloporus undulatus). He samples 8 individuals and injects them with different doses (standardized by weight) of testosterone and observes the size of their territory in the field. The researcher conducts a linear regression and needs help completing the following ANOVA table to test for the significance of the slope.
Source of variation
|
Sum of Squares |
df |
Mean Squares |
F |
Critical value |
Regression | 1050 | 1 | 1050 | 42 | 5.99 |
Error | 150 | 6 | 25 |
|
|
Total | 1200 | 7 |
|
|
|
Calculate the coefficient of determination (r2) and enter the value below
0.875
A researcher is studying how testosterone levels affect the size of the territory of individual fence lizards (Sceloporus undulatus). He samples 8 individuals and injects them with different doses (standardized by weight) of testosterone and observes the size of their territory in the field. The researcher conducts a linear regression and needs help completing the following ANOVA table to test for the significance of the slope.
Source of variation
|
Sum of Squares |
df |
Mean Squares |
F |
Critical value |
Regression | 1050 | 1 | 1050 | 42 | 5.99 |
Error | 150 | 6 | 25 |
|
|
Total | 1200 | 7 |
|
|
|
The correct coefficient of determination (r2) is 0.875. Choose the correct interpretation for this value.
87.5% of the variation in territory size is explained by differences in testosterone dose.
The Hardy-Weinberg equilibrium is a theoretical model that predicts the frequency of different genotypes in a population that is not evolving. A scientist studying the population genetics of the rainbow fish finds that the Hardy-Weinberg model predicts that the frequencies of the three different genotypes for the albino gene in a given lake should be as follow: AA: 49%, Aa: 42%, and aa: 9%. However, the scientist obtained a sample of 320 individuals of this species and found that the numbers of individuals for the different genotypes are: AA: 180, Aa: 120, and aa: 20.
Choose the correct statistical approach to examine if the observed frequencies are consistent with Hardy-Weinberg equilibrium
Chi-square test for categorical data
The Hardy-Weinberg equilibrium is a theoretical model that predicts the frequency of different genotypes in a population that is not evolving. A scientist studying the population genetics of the rainbow fish finds that the Hardy-Weinberg model predicts that the frequencies of the three different genotypes for the albino gene in a given lake should be as follow: AA: 49%, Aa: 42%, and aa: 9%. However, the scientist obtained a sample of 320 individuals of this species and found that the numbers of individuals for the different genotypes are: AA: 180, Aa: 120, and aa: 20.
The correct approach is a Chi-square test for categorical data. Calculate the Chi-square statistic and enter the obtained value below:
7.66
The Hardy-Weinberg equilibrium is a theoretical model that predicts the frequency of different genotypes in a population that is not evolving. A scientist studying the population genetics of the rainbow fish finds that the Hardy-Weinberg model predicts that the frequencies of the three different genotypes for the albino gene in a given lake should be as follow: AA: 49%, Aa: 42%, and aa: 9%. However, the scientist obtained a sample of 320 individuals of this species and found that the numbers of individuals for the different genotypes are: AA: 180, Aa: 120, and aa: 20.
Enter below the Chi-square critical value from the the Chi-square distribution table used in class (do not round it and enter it exactly as it appears in the table)
5.99
The Hardy-Weinberg equilibrium is a theoretical model that predicts the frequency of different genotypes in a population that is not evolving. A scientist studying the population genetics of the rainbow fish finds that the Hardy-Weinberg model predicts that the frequencies of the three different genotypes for the albino gene in a given lake should be as follow: AA: 49%, Aa: 42%, and aa: 9%. However, the scientist obtained a sample of 320 individuals of this species and found that the numbers of individuals for the different genotypes are: AA: 180, Aa: 120, and aa: 20.
The correct calculated Chi-squared value is 7.66 and the critical value is 5.99. Choose the correct conclusion
Reject the null hypothesis. The genotype frequencies are not consistent with Hardy-Weinberg equilibrium.