Ratio Analysis
1/76
There's no tags or description
Looks like no tags are added yet.
Name | Mastery | Learn | Test | Matching | Spaced | Call with Kai |
|---|
No analytics yet
Send a link to your students to track their progress
77 Terms
Activity
How efficiently a company completes day-to-day tasks
Liquidity
Ability to meet its short term obligations
Solvency
Ability to meet long term obligations
Profitability
Ability to generate profitable sales from resources
Valuation
Quantity of asset or flow relative to specified claim
Activity ratios
Also known as asset utilization or operating efficiency.
Answers the question: “How well does a company manage its assets?”
Efficiency has a direct impact on liquidity, so some activity ratios are useful in assessing liquidity.
Recall that Working Capital = Current Assets – Current Liabilities.
Receivables Turnover
= Revenue ÷ Average Receivables
What it shows: How efficiently the company collects cash from credit sales.
Days of Sales Outstanding (DSO)
= 365 days ÷ Receivables Turnover
What it shows: Average number of days it takes to collect receivables.
Inventory Turnover
= Cost of Goods Sold ÷ Average Inventory
What it shows: How quickly a company sells and replaces its inventory.
Days of Inventory on Hand (DHO)
= 365 days ÷ Inventory Turnover
What it shows: Average number of days inventory is held before being sold.
Payables Turnover
= Cost of Goods Sold ÷ Average Accounts Payable
What it shows: How quickly a company pays its suppliers.
Number of Days Payable
= 365 days ÷ Payables Turnover
What it shows: Average number of days the company takes to pay suppliers.
Working Capital Turnover
= Revenue ÷ Average Working Capital
What it shows: How efficiently the company uses working capital to generate sales.
Total Asset Turnover
= Revenue ÷ Average Total Assets
What it shows: How effectively a company uses all of its assets to generate revenue.
Fixed Asset Turnover
= Revenue ÷ Average Net Fixed Assets
What it shows: How efficiently the company uses fixed assets (e.g., property, plant, equipment) to generate revenue.
Liquidity Ratios
Liquidity ratios are a class of financial metrics used to determine a debtor's ability to pay off current debt obligations without raising external capital.
Current Ratio
= Current Assets ÷ Current Liabilities
What it shows: The company’s ability to cover short-term obligations with short-term assets.
Quick Ratio
= (Cash + Short-Term Marketable Investments + Receivables) ÷ Current Liabilities
What it shows: The company’s ability to meet short-term liabilities with most liquid assets (excludes inventory).
Cash Ratio
= (Cash + Short-Term Marketable Investments) ÷ Current Liabilities
What it shows: The company’s ability to meet short-term obligations using only cash and near-cash assets.
Cash Conversion Cycle (Net Operating Cycle)
= Days of Inventory on Hand (DIO) + Days of Sales Outstanding (DSO) − Number of Days Payable
DSO (Days Sales Outstanding): Lower is better ✅
DIO (Days Inventory on Hand): Lower is better ✅
DPO (Days Payables Outstanding): Higher is better ✅
What it shows: Measures the length of time it takes to convert cash invested in operations into cash received from customers. A smaller number is better, as it reflects less cash tied up in working capital.
How it Works
Credit extended / Inventory on credit: Company receives inventory from suppliers on credit (accounts payable).
Take inventory, put it on the shelf: Goods sit in inventory (DIO).
Sell that inventory: Company makes the sale (DSO starts).
Collect receivables, then pay payables: Company collects cash from customers and later pays suppliers (DPO).
Shorter CCC is good:
Less cash tied up in operations → better liquidity and efficiency.
Home Depot and Walmart have negative CCC, meaning they collect cash from customers before paying suppliers, effectively using their customers to finance their suppliers.
This is possible because of their massive scale and consistent sales volume.
Solvency Ratios
Measures ability to pay debts
Two types:
1) Debt ratios: measure the amount of debt capital to equity capital
Focus on balance sheet items
For measurement of debt, take sum of interest-bearing short-term and long-term debt, excluding liabilities such as accrued expenses and accounts payable
Want it to be lower
High debt ratios indicate greater financial leverage and potentially higher risk.
2) Coverage ratios: measure the ability of the firm to cover its interest payments
Focus on income statement items
Want it to be higher
Higher coverage ratios indicate a stronger ability to meet interest obligations, implying lower default risk.
Debt Ratios
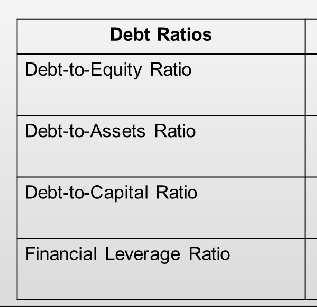
Debt to Equity
= Total Debt ÷ Total Equity
What it shows: Measures the proportion of financing coming from debt relative to equity. Higher ratios mean more leverage and potentially higher financial risk.
Debt-to-Assets Ratio
= Total Debt ÷ Total Assets
What it shows: Indicates the percentage of assets financed through debt. Higher ratios suggest heavier reliance on debt to fund operations.
Debt-to-Capital Ratio
= Total Debt ÷ Total Capital (Debt + Equity)
What it shows: Shows the proportion of total capital structure that is made up of debt. Useful for assessing capital structure risk.
Financial Leverage Ratio
= Average Total Assets ÷ Average Total Equity
What it shows: Measures how much assets are supported by each dollar of equity. A higher ratio indicates greater use of leverage.
Coverage Ratios
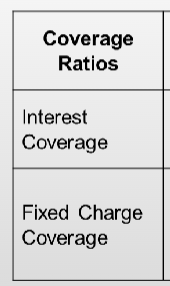
Interest Coverage
= EBITDA ÷ Cash Interest Payments
What it shows: Measures how easily a company can cover its interest expenses with operating earnings. Higher is better and indicates lower default risk.
Fixed Charge Coverage
= (EBITDA − Capex − Cash Taxes) ÷ (Cash Interest + Scheduled Amortization)
What it shows: A broader measure of coverage that includes not only interest but also required principal repayments. Indicates how well the company can meet all fixed financing obligations.
Profitability Ratios (Return on Revenue)
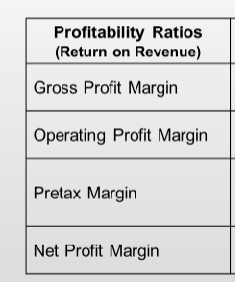
Gross Profit Margin
= Gross Profit ÷ Revenue
What it shows: Reflects input costs, pricing power over customers, and product mix. Indicates how much profit is left after covering the cost of goods sold.
Operating Profit Margin
= EBIT ÷ Revenue
What it shows: Measures the firm’s ability to control operating costs and overhead, showing profitability from core operations.
Pretax Margin
= EBT ÷ Revenue
What it shows: Reflects the effects of profitability after operating costs but before taxes, including the impact of leverage and non-operating income/expenses.
Net Profit Margin
= Net Income ÷ Revenue
What it shows: Measures the overall profitability after all expenses, interest, and taxes. May be adjusted for non-recurring items.
Profitability Ratios (Return on Investment)
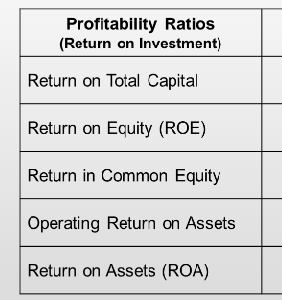
Return on Total Capital
= EBIT ÷ Average Total Capital
What it shows: Measures the return generated from both debt and equity capital used in the business.
Return on Equity (ROE)
= Net Income ÷ Average Total Equity
What it shows: Indicates how efficiently the company uses shareholders’ equity to generate profits.
Return on Common Equity
= (Net Income − Preferred Dividends) ÷ Average Common Equity
What it shows: Measures the return available to common shareholders after paying preferred dividends.
Operating Return on Assets
= Operating Income ÷ Average Total Assets
What it shows: Evaluates how efficiently the company’s assets generate operating income.
Return on Assets (ROA)
= Net Income ÷ Average Total Assets
What it shows: Measures how effectively the company uses its assets to generate net income, reflecting overall efficiency and profitability.
Inventory Analysis
Inventory Turnover
= COGS ÷ Ending (or Average) Inventory
What it shows: How efficiently inventory is sold and replaced.
A decreasing number may indicate problems such as slow-moving or excess inventory.
Number of Days of Inventory
= 365 ÷ Inventory Turnover
What it shows: Average number of days inventory is held before being sold.
Rising numbers may indicate problems with inventory buildup or weak sales.
Gross Profit Margin
= Gross Profit ÷ Total Revenue
What it shows: Reflects input cost pressures, pricing ability, and customer/product mix.
A lower or declining result may signal inability to raise prices, rising costs, or weak pricing power.
Current Ratio
= Current Assets ÷ Current Liabilities
What it shows: Company’s ability to meet short-term obligations.
A lower number (below 1) may indicate liquidity problems.
Effects of Rising Prices on Financial Ratios
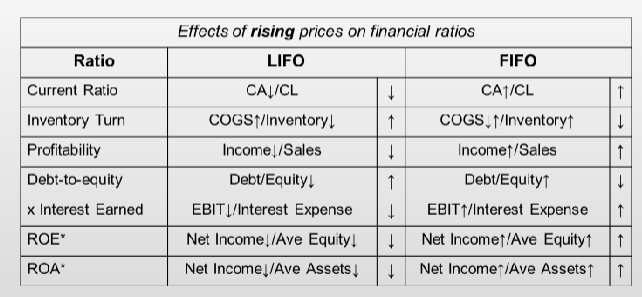
Current Ratio (CA ÷ CL)
LIFO: ↓ (Current assets lower under LIFO due to older, cheaper inventory values)
FIFO: ↑ (Current assets higher under FIFO because inventory reflects more recent, higher prices)
Inventory Turnover (COGS ÷ Inventory)
LIFO: ↑ (COGS higher, inventory lower → turnover increases)
FIFO: ↓ (COGS lower, inventory higher → turnover decreases)
Profitability (Income ÷ Sales)
LIFO: ↓ (Higher COGS leads to lower income → lower margins)
FIFO: ↑ (Lower COGS leads to higher income → higher margins)
Debt-to-Equity (Debt ÷ Equity)
LIFO: ↑ (Lower equity from lower income → higher ratio)
FIFO: ↓ (Higher equity from higher income → lower ratio)
Times Interest Earned (EBIT ÷ Interest Expense)
LIFO: ↓ (Lower EBIT from higher COGS → lower coverage)
FIFO: ↑ (Higher EBIT → better coverage)
ROE (Net Income ÷ Avg. Equity)
LIFO: ↓ (Net income lower → ROE decreases)
FIFO: ↑ (Net income higher → ROE increases)
ROA (Net Income ÷ Avg. Total Assets)
LIFO: ↓ (Net income lower → ROA decreases)
FIFO: ↑ (Net income higher → ROA increases)
Inventories — Write-downs
If inventories are written down, both profitability and the carrying amount of inventory decrease.
The loss is recognized as an expense on the income statement (usually part of COGS).
Profitability, liquidity, and solvency ratios are negatively impacted.
Activity ratios (e.g., inventory turnover) are positively impacted because inventory values shrink, making turnover appear stronger.
📊 Inventories — ROE & ROA Impact
For both ROE and ROA, the numerator effects (changes in net income) are greater than denominator effects (equity or assets).
LIFO is primarily used for its tax benefits.
Under IFRS, LIFO is not permitted — if U.S. adopts IFRS, the LIFO method would be eliminated.
Net profit margin (Straight-line vs Accelerated depreciation)
Formula: Net Income ÷ Sales
Straight-line: Net Income ↑ → Net Profit Margin ↑
Accelerated: Net Income ↓ → Net Profit Margin ↓
ROA in early years (Straight-line vs Accelerated depreciation)
Formula: Net Income ÷ Total Assets
Straight-line: Net Income ↑ and Total Assets ↑ → ROA ↑
Accelerated: Net Income ↓ and Total Assets ↓ → ROA ↓
ROE in early years (Straight-line vs Accelerated depreciation)
Formula: Net Income ÷ Equity
Straight-line: Net Income ↑ and Equity ↑ → ROE ↑
Accelerated: Net Income ↓ and Equity ↓ → ROE ↓
Debt-to-Equity
Formula: Total Debt ÷ Total Equity
Straight-line: Debt/Equity ↑ → Ratio ↓
Accelerated: Debt/Equity ↓ → Ratio ↑
Asset Turnover
Formula: Sales ÷ Total Assets
Straight-line: Sales/Assets ↑ → Asset Turnover ↓
Accelerated: Sales/Assets ↓ → Asset Turnover ↑
Capitalization / Expensing
Assets & Equity
Capitalization: Higher (assets stay on balance sheet)
Expensing: Lower (costs expensed immediately)
Net Income (first year)
Formula: Net Income = Revenues − Expenses
Capitalization: Higher (costs spread out over time)
Expensing: Lower (all cost hits income immediately)
Net Income (other years)
Capitalization: Lower (depreciation hits future years)
Expensing: Higher (no future depreciation)
Income Variability
Capitalization: Lower variability (costs smoothed)
Expensing: Higher variability (spikes when incurred)
ROA & ROE (first year)
ROA Formula: Net Income ÷ Total Assets
ROE Formula: Net Income ÷ Equity
Capitalization: Higher (higher income + higher assets/equity)
Expensing: Lower (lower income)
ROA & ROE (other years)
Capitalization: Lower (depreciation expense in later years)
Expensing: Higher (no future charges)
Debt Ratio & Debt-to-Equity
Debt-to-Equity Formula: Total Debt ÷ Total Equity
Capitalization: Lower (equity higher)
Expensing: Higher (equity lower)
Cash Flow from Operations (CFO)
Capitalization: Higher (costs capitalized, not expensed immediately)
Expensing: Lower
Cash Flow from Investing (CFI)
Capitalization: Lower (cash outflow classified as investing)
Expensing: Higher (no investing cash flow)
ROE (Return on Equity)
Formula:
ROE = Net Income ÷ Average Shareholders’ Equity
What it shows:
Measures how effectively a company generates profit from the equity invested by shareholders.
DuPont Decomposition (3-Step)
Formula:
ROE = Profit Margin × Total Asset Turnover × Financial Leverage
= (Net Income ÷ Revenue) × (Revenue ÷ Average Total Assets) × (Average Total Assets ÷ Average Shareholders’ Equity)
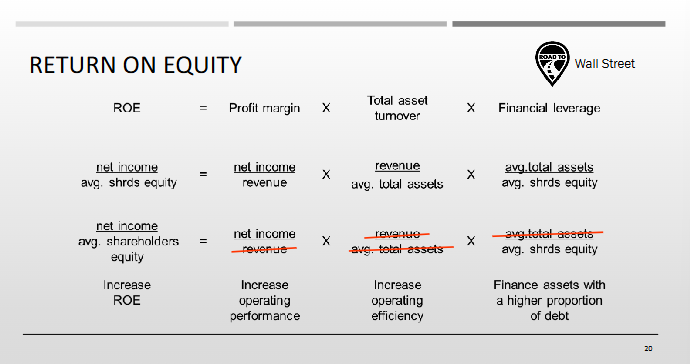
Profit Margin (Net Income ÷ Revenue)
→ Measures operating performance — how much profit is generated per dollar of sales.
→ Higher profit margin increases ROE.
Total Asset Turnover (Revenue ÷ Average Total Assets)
→ Measures operating efficiency — how effectively assets generate revenue.
→ Higher asset turnover increases ROE.
Financial Leverage (Average Total Assets ÷ Average Shareholders’ Equity)
→ Measures how much assets are supported by each dollar of equity.
→ A higher ratio indicates a larger asset base relative to equity, meaning the firm is financing more assets with liabilities relative to equity.
→ This amplifies ROE when returns on assets exceed the cost of financing.
→ Note: This is not simply “more debt” — it’s about the asset/equity relationship
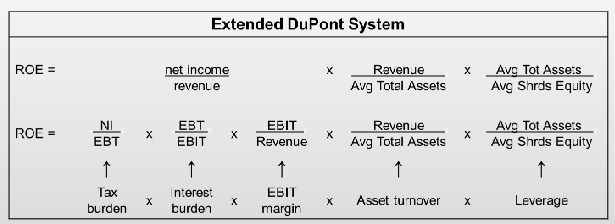
Extended DuPont (5-Step)
Formula:
ROE = (Net Income ÷ EBT) × (EBT ÷ EBIT) × (EBIT ÷ Revenue) × (Revenue ÷ Average Total Assets) × (Average Total Assets ÷ Average Equity)
Tax Burden (NI ÷ EBT) → 1 − effective tax rate
Interest Burden (EBT ÷ EBIT) → Effect of interest expense on profit
EBIT Margin (EBIT ÷ Revenue) → Operating profitability
Asset Turnover (Revenue ÷ Average Total Assets) → Efficiency
Leverage (Average Total Assets ÷ Average Equity) → Financing structure