Unit 8 - Statistical Inference
1/32
There's no tags or description
Looks like no tags are added yet.
Name | Mastery | Learn | Test | Matching | Spaced |
|---|
No study sessions yet.
33 Terms
probability
the likelihood that any one event will occur, given all the possible outcomes
what is probability symbol
p = probability (ratio or decimal)
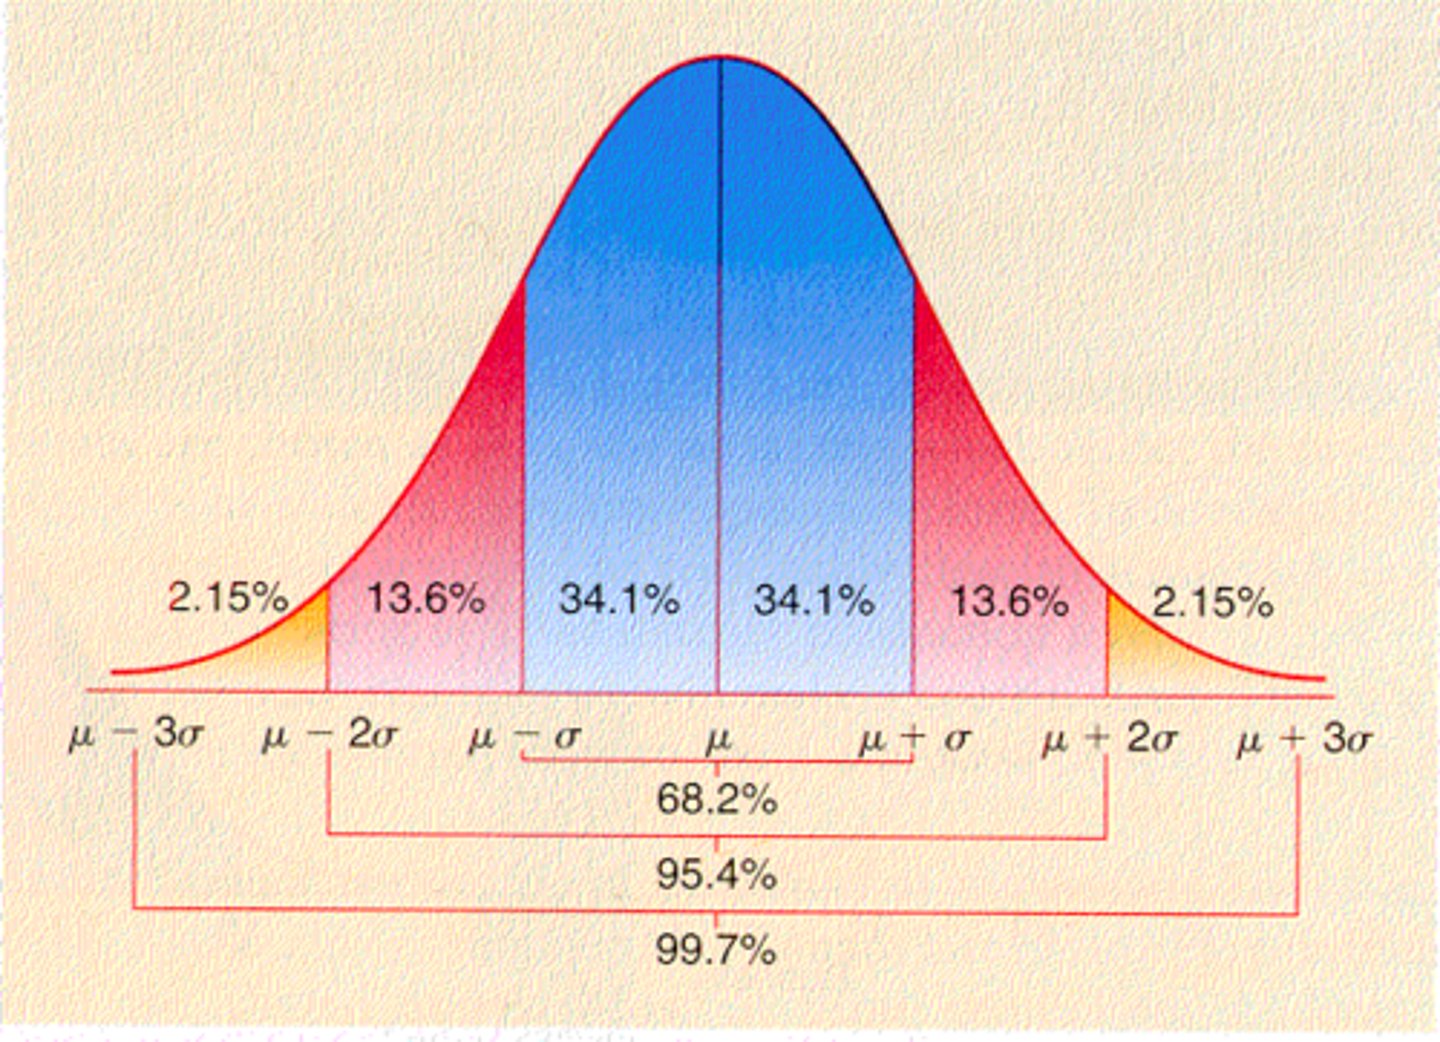
distribution of scores
the general shape of data which includes a mean, median, and mode
example of distribution of scores
height of adults
- mean = 69 inches (z score = 0)
- standard deviation= +- 3 inches
standard deviation
show how spread out the scores are.
e.g +-3 (3 sd away from the mean)
where is probability under distribution curve?
the more area there is under the graph for a certain score equals probability of those scores
sampling distribution of means
A frequency distribution showing all possible sample means that occur when samples of a particular size are drawn from a population
assumption of sampling distribution
samples are randomly selected and valid representations of the population
sampling error
the larger the error, the less accurate the sample represents the population
- as sample size increases, variability from mean is reduced
type of inferential statistics that does not establish cause and effect
relation/prediction
- correlation & regression analysis
type of inferential statistics that tries to establish cause & effect
1 group -> one sample z-test or t-test
2 groups or 1 group measured twice -> 2 sample t-test or paired t-test
more than 2 groups -> ANOVA
what if sample size is small
- use t-distribution, instead of z-distribution as variability decreases with larger sample size
- t-distrbution curves are more platykurtic
- t-distribution also depends on sample size
hypothesis
a declarative statement that predicts the relationship between the independent and dependent variables, specifying the population that will be studied
two types of hypothesis
- research hypothesis
- null hypothesis
research hypothesis
states the researcher's true expectations of results guiding the interpretation of outcomes and conclusions
- depends on the field of study
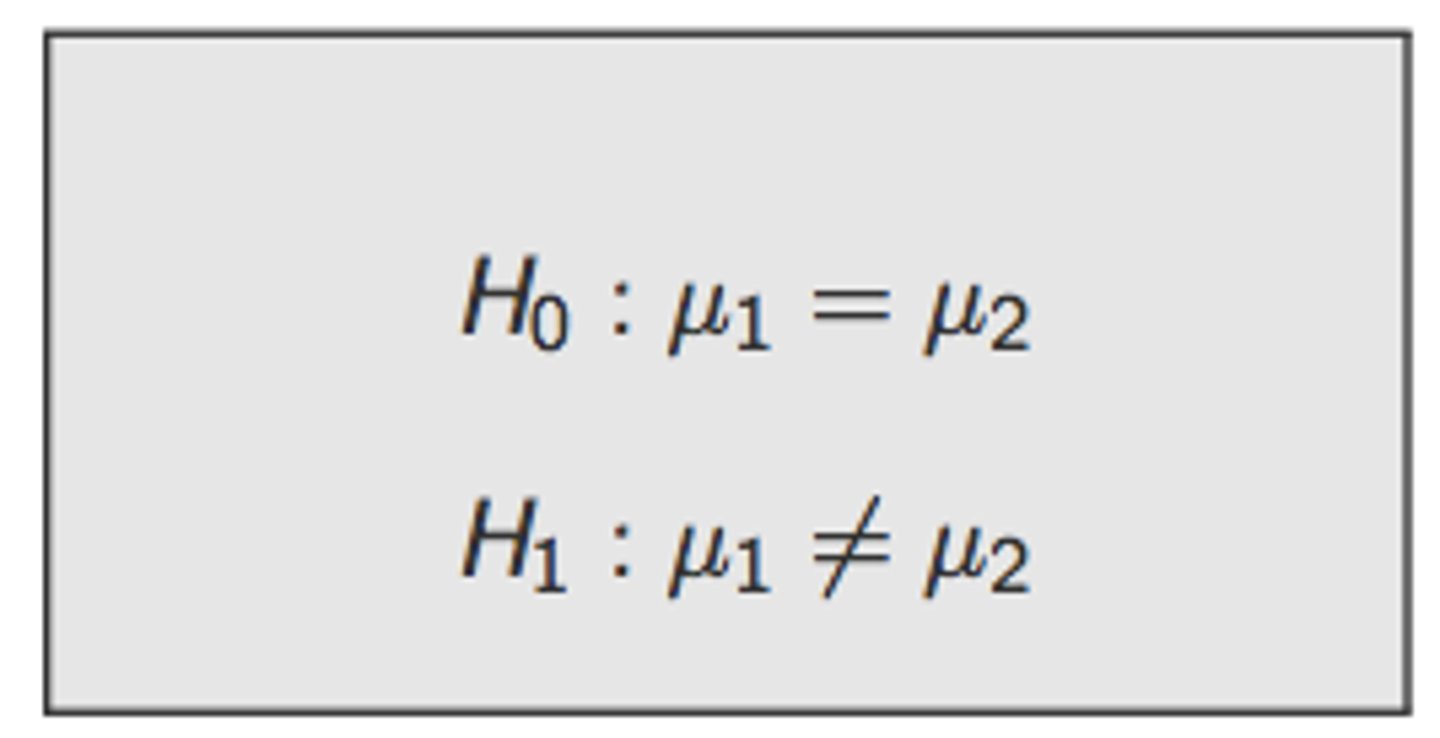
null hypothesis
statistical hypothesis where statistically testing of data is allowed once data is collected as part of the research study
- does not depend on the field of study
criteria for hypothesis testing
characteristics and inclusion criteria for participants to be grouped must be specific to the population to which conclusion are to be inferred to
how is statistical null hypothesis stated
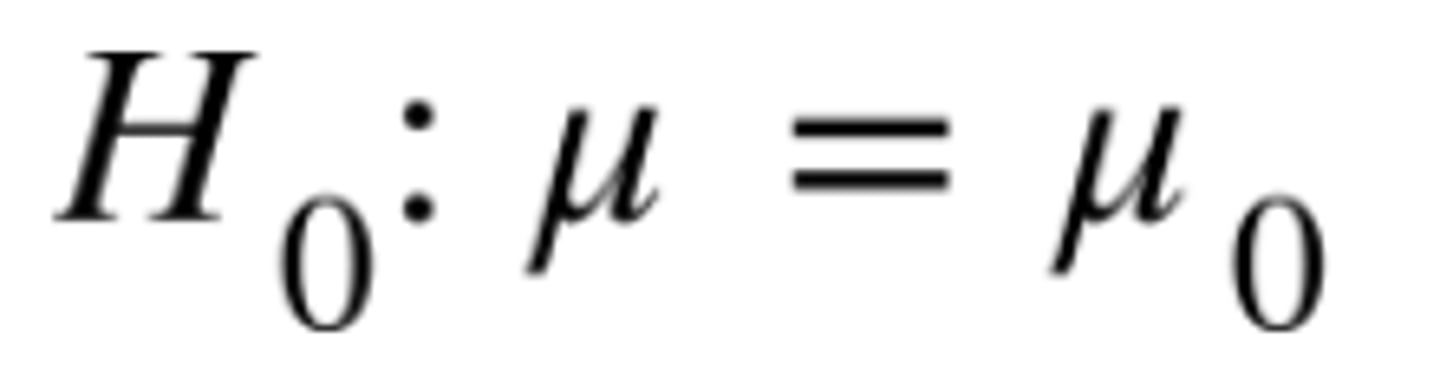
objective of null hypothesis
to be able to use statistic to infer back to respective population (why population symbol is used)
how is statistical alternative hypothesis stated
directional hypothesis
researchers have reasonable expectations that one group is greater or less than another
- directional doesn't play out in null hypothesis, only alternative hypothesis
errors in hypothesis testing
-must ONLY accept or reject null hypothesis
- when accepting null hypothesis, you reject alternative hypothesis (vise versa)
- based on results of statistical test (i.e, calculations)
Type I error (alpha)
False positive results
ex: reject the null hypothesis when you should accept it
at what % of error do researcher usually stays at?
5% (1% is when researchers are very confident they didn't make mistake)
Type II error (beta)
false negative
ex: accept null hypothesis when you should reject it
statistical power
the probability that statistical tests will lead to rejection of the null hypothesis (ex: when ejecting null, you are stating 2 or more groups are significantly different)
factors affecting statistical power
1) alpha level chosen
- selecting 5% vs 1% risk of type i error will increase statistical power
- using one-tailed vs two tailed approach will increase statistical power
2) sample size
- greater sample size = tighter distribution
- smaller sample size = wider distribution
3) variability
- large sigma: wider distribution of scores which will decrease statistical data
- smaller sigma: tight distribution will increase statistical data
4) the magnitude of differences between groups
- greater differences between means = larger statistical power
- magnitude is determined by effect size
statistical testing
using established statistical testing (equations) to determine the acceptance or rejection of a null hypothesis
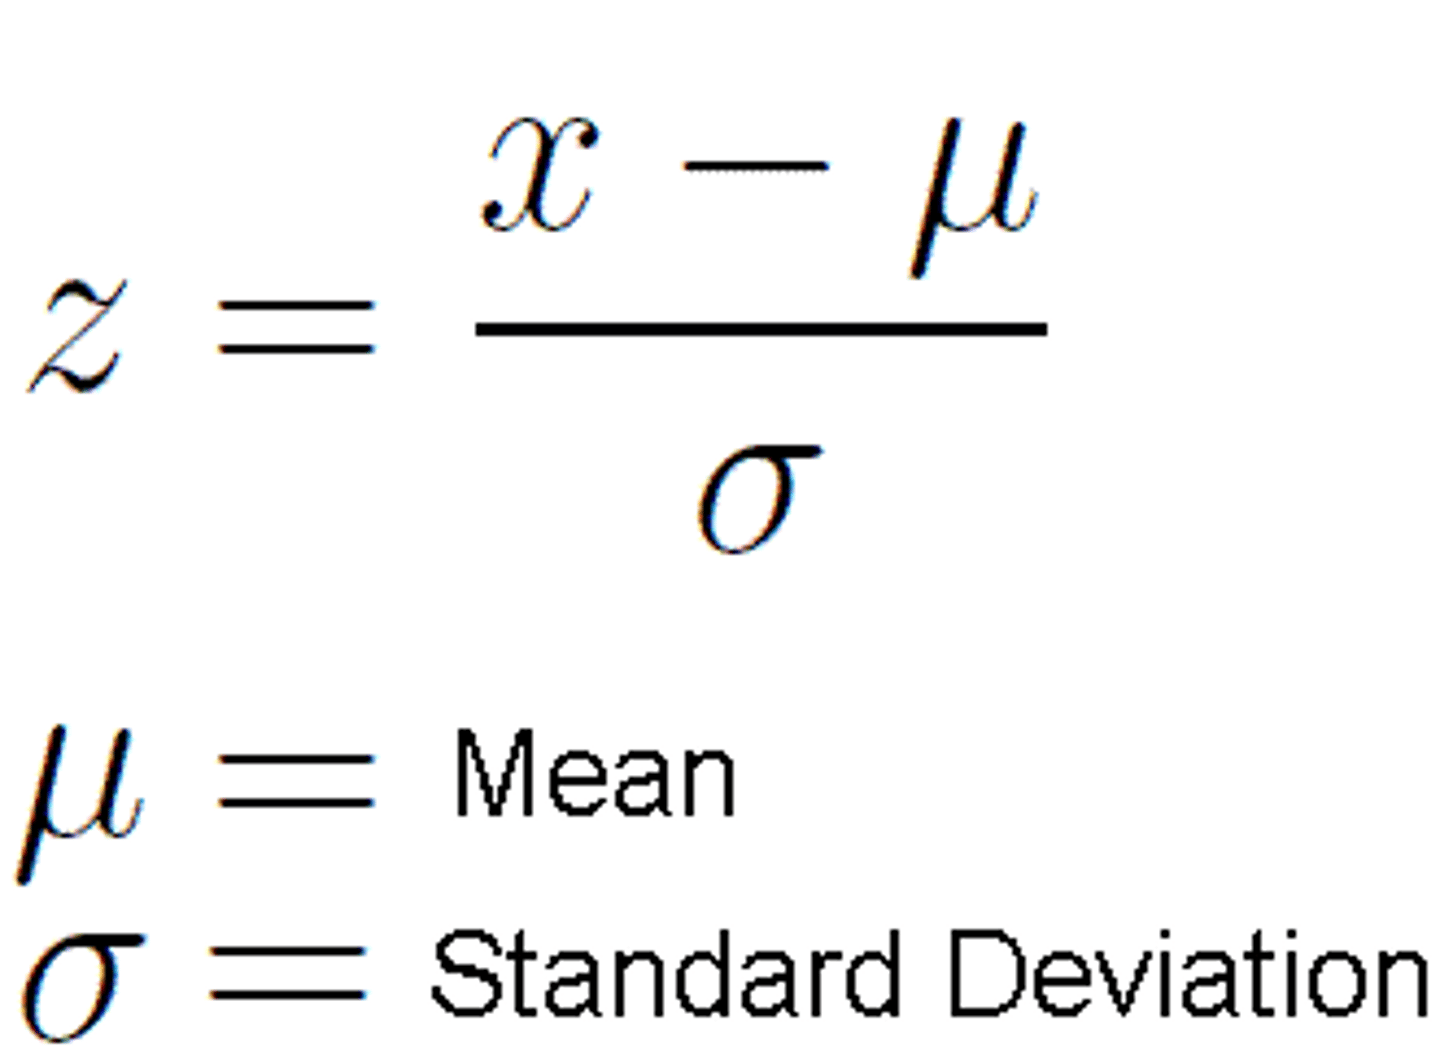
z-score
difference between raw score and the group (sample) mean divided by the standard deviation
- it's unitless
one sample z-test
determine if sample is representative of population
critical region
the area in the tails of the comparison distribution in which the null hypothesis can be rejected
noncritical region
the range of values of the test value that indicates that the difference was probably due to chance and that the null hypothesis should not be rejected
steps in hypothesis testing
1. state null hypothesis in symbols and words
2. state alternative hypothesis in symbols and words
3. choose an alpha level (usually 5%) and one or two-tailed (often used where 5% is split between upper & lower tail)
4. state rejection and retain rule
5. compute appropriate statistic (z test)
6. make decision by applying rejection/retain rule
7. write conclusion in context of study